Acetazolamide prevents hypoxia-induced reactive oxygen species generation and calcium release in pulmonary arterial smooth muscle
Abstract
Upon sensing a reduction in local oxygen partial pressure, pulmonary vessels constrict, a phenomenon known as hypoxic pulmonary vasoconstriction. Excessive hypoxic pulmonary vasoconstriction can occur with ascent to high altitude and is a contributing factor to the development of high-altitude pulmonary edema. The carbonic anhydrase inhibitor, acetazolamide, attenuates hypoxic pulmonary vasoconstriction through stimulation of alveolar ventilation via modulation of acid–base homeostasis and by direct effects on pulmonary vascular smooth muscle. In pulmonary arterial smooth muscle cells (PASMCs), acetazolamide prevents hypoxia-induced increases in intracellular calcium concentration ([Ca2+]i), although the exact mechanism by which this occurs is unknown. In this study, we explored the effect of acetazolamide on various calcium-handling pathways in PASMCs. Using fluorescent microscopy, we tested whether acetazolamide directly inhibited store-operated calcium entry or calcium release from the sarcoplasmic reticulum, two well-documented sources of hypoxia-induced increases in [Ca2+]i in PASMCs. Acetazolamide had no effect on calcium entry stimulated by store-depletion, nor on calcium release from the sarcoplasmic reticulum induced by either phenylephrine to activate inositol triphosphate receptors or caffeine to activate ryanodine receptors. In contrast, acetazolamide completely prevented Ca2+-release from the sarcoplasmic reticulum induced by hypoxia (4% O2). Since these results suggest the acetazolamide interferes with a mechanism upstream of the inositol triphosphate and ryanodine receptors, we also determined whether acetazolamide might prevent hypoxia-induced changes in reactive oxygen species production. Using roGFP, a ratiometric reactive oxygen species-sensitive fluorescent probe, we found that hypoxia caused a significant increase in reactive oxygen species in PASMCs that was prevented by 100 μM acetazolamide. Together, these results suggest that acetazolamide prevents hypoxia-induced changes in [Ca2+]i by attenuating reactive oxygen species production and subsequent activation of Ca2+-release from sarcoplasmic reticulum stores.
Introduction
Reductions in alveolar oxygen concentration can occur under a variety of conditions, including with ascent to high altitude or in the setting of acute and chronic lung diseases. As oxygen tensions fall, pulmonary blood vessels respond with hypoxic pulmonary vasoconstriction (HPV) in an attempt to divert blood flow away from poorly oxygenated regions of the lung. When excessive, HPV can cause high-altitude pulmonary edema (HAPE).1, 2 Although studied extensively, the exact cellular mechanisms by which hypoxia induces HPV are still being defined. In general, HPV is believed to require Ca2+ influx into the cytoplasm of pulmonary arterial smooth muscle cells (PASMCs), as HPV is attenuated by the removal of extracellular Ca2+ and by antagonists of voltage-gated Ca2+ channels3–9 and Ca2+-permeable non-selective cation channels (NSCC).10–12 Other studies have demonstrated a role for Ca2+ release from internal stores in the sarcoplasmic reticulum (SR) in the response,13–18 likely facilitating influx of extracellular Ca2+ through store-dependent plasma membrane channels.
Pharmacological treatments for HAPE include prophylactic use of various known pulmonary vasodilating drugs, such as nifedipine and tadalafil. Acetazolamide (AZ), a carbonic anhydrase (CA) inhibitor used to prevent the development of acute mountain sickness,19 is proposed to reduce HAPE susceptibility through reduction of renal bicarbonate reabsorption and generation of a metabolic acidosis to stimulate ventilation, improving alveolar and arterial oxygenation and attenuating the onset and magnitude of HPV in a variety of species,20–22 including humans.23–25 In the lung, however, CA inhibition impaired ventilation–perfusion matching and HPV even when ventilation, alveolar PO2 and PCO2 were carefully controlled or held constant,20–22,26 suggesting additional direct effects on the vascular cells. Consistent with this premise, vascular smooth muscle contains CA27, 28 and it was previously demonstrated that AZ prevents the hypoxia-induced increase in intracellular calcium concentration ([Ca2+]i) in pulmonary vascular smooth muscle cells (PASMCs) that initiates HPV.29 Interestingly, the effects of AZ were not due to interference with alkalinization or membrane depolarization during hypoxia. The effects of AZ also were independent of CA inhibition, since N-methyl-acetazolamide (N-Meth-AZ), a compound structurally similar to AZ but in which an amine hydrogen of the sulfonamide moiety responsible for CA inhibition was replaced with a methyl group to prevent binding to CA,30, 31 had an effect that was similar to that of AZ on the hypoxia-mediated increase in [Ca2+]i29 and on HPV in spontaneously breathing dogs.32, 33
Thus, in this study, we explored mechanisms by which AZ might prevent hypoxia-induced changes in [Ca2+]i. Since a direct inhibition of voltage-gated Ca2+ channels was previously ruled out,29 we hypothesized that AZ might modulate HPV by inhibiting increases in PASMC cytosolic Ca2+ due to influx through plasmalemmal NSCC and/or release from inositol triphosphate (IP3) or ryanodine receptors (IP3R and RyR, respectively) on SR stores. Since hypoxia-mediated alterations in reactive oxygen species (ROS) generation may also be a signaling mechanism for increasing cytosolic Ca2+ during hypoxia, we also tested whether AZ could prevent hypoxia-induced changes in ROS production. To test these hypotheses, we used fluorescent microscopy, the Ca2+-sensitive dye, Fura-2 AM and roGFP, a ratiometric ROS-sensitive fluorescent probe, to determine the ability of AZ to inhibit these pathways in response to hypoxia and direct channel agonists in PASMC.
Methods
All procedures and protocols in this study were conducted in accordance with NIH guidelines for the proper care and use of animals in research and were approved by the Institutional Animal Care and Use Committee.
Isolation of PASMCs
PASMCs were isolated following protocols described previously by Shimoda et al.34 Briefly, intrapulmonary arteries (200–600 μm outer diameter) were isolated from adult male Wistar rats (250–350 g) under a dissecting microscope and cleaned of adventitial tissue. Only male animals were used in this study due to known sex-dependent differences in pulmonary responses to acute hypoxia.35–37 The endothelium was removed by gently rubbing the lumen with a cotton swab after which the arteries were allowed to recover for at least 30 min in N-[2-hydroxyethyl]piperazine-Nʹ-[2-ethanesulfonic acid] (HEPES)-buffered saline solution (HBSS) containing (in mM): 130 NaCl, 5 KCl, 1.2 MgCl2, 1.5 CaCl2, 10 HEPES and 10 glucose on ice. The pH of the solution was adjusted to 7.2 using 5 M NaOH. The arteries were then transferred to reduced-Ca2+ (20 μM CaCl2) HBSS at room temperature for at least 20 min. The tissue was digested for 15–20 min at 37°C in reduced-Ca2+ HBSS to which was added collagenase (type I; 1750 U/ml), papain (9.5 U/ml), bovine serum albumin (2 mg/ml) and dithiothreitol (1 mM). Single PASMCs were obtained by gentle trituration in Ca2+-free HBSS. Cells were transiently cultured on uncoated 25 mm glass cover slips in Ham’s-F-12 media supplemented with 0.5% fetal bovine serum and 1% penicillin/streptomycin for 24–48 h. For each isolation, PASMCs were validated by using one coverslip of cells to measure change in [Ca2+]i in response to 80 mM KCl (Fig. 1a) and one coverslip fixed and incubated in primary antibodies against smooth muscle-specific actin and smooth muscle specific myosin heavy chain, and counterstained with DAPI (Fig. 1b). Only isolations where >85% of cells stained positive for smooth muscle-specific actin and myosin and responded with >50 nM increase in [Ca2+]i were used for experiments.
Measurement of [Ca2+]i
Coverslips containing PASMCs incubated with Fura-2 AM (5–7 µM for 60 min at 37°C) were mounted in a laminar flow cell chamber and perfused with modified Krebs bicarbonate (KRB) solution that contained (in mM): 118.3 NaCl, 4.7 KCl, 1.2 MgSO4, 25 NaHCO3, 11 glucose and 1.2 KH2PO4. Cells were perfused with KRB solution for 15 min at 37°C to remove extracellular dye and allow equilibration to a stable baseline prior to beginning protocols. Ratiometric measurement of Fura-2 fluorescence was performed on a workstation (Intracellular Imaging Inc., Cincinnati, OH) consisting of an inverted microscope with epi-fluorescence attachments. Light from a xenon arc lamp was filtered at 340 and 380 nm using an electronic filter wheel, and focused onto the PASMCs under examination via a 20× fluorescence objective (Super Fluor 20, Nikon). Emitted light from the cells was filtered at 510 nm using a band pass filter cube, returned through the objective and detected by a CCD imaging camera. Unless otherwise stated, images were captured at a rate of 5/min. Photobleaching of Fura-2 was minimized by use of a shutter within the filter wheel. Protocols were executed and data collected online with InCytim 2 software (Intracellular Imaging Inc.). [Ca2+]i was estimated from in vitro calibration curves generated using solutions consisting of Fura-2 and known concentrations of free Ca2+ ranging from 0 to 1350 nM. Up to five reservoirs containing experimental solutions and gassed with either 16% O2; 5% CO2 (control) or 4% O2; 5% CO2 (hypoxia) were connected via stainless steel tubing to a manifold and solutions changed via stopcocks, allowing rapid switching between experimental conditions.
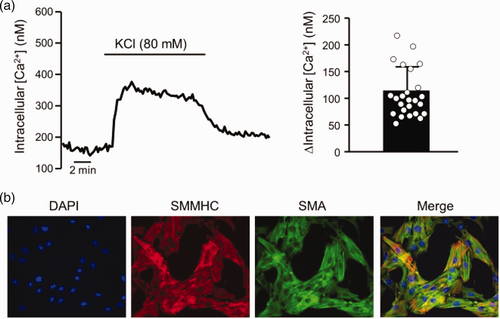
Validation of PASMC isolations. (a) Representative trace showing change in intracellular calcium concentration ([Ca2+]) response to KCl (80 mM) in PASMCs and bar graph showing mean ±SD values for average change (Δ) in intracellular [Ca2+] within an isolation of PASMCs. Each dot represents a single cell. (b) Representative images showing immunofluorescence for DAPI (nuclei), smooth muscle cell myosin heavy chain (SMMHC), smooth muscle-specific α-actin (SMA) and the merged image.
For experiments measuring store-operated calcium entry (SOCE) through NSCCs, PASMCs were briefly perfused with Ca2+-free KRB solution containing 1 mM EGTA to chelate any residual free Ca2+ in the system and nifedipine (5 µM) to inhibit voltage-gated (L-type) Ca2+ channels. After 10 min, cells were exposed to cyclopiazonic acid (CPA; 10 μM) for 5 min to deplete intracellular Ca2+ stores. Cells were then perfused with Ca2+-containing KRB solution containing nifedipine and CPA, and the change in [Ca2+]i recorded as a measure of SOCE. These experiments were complimented by measuring the quenching of Fura-2 fluorescence when extracellular Ca2+ was replaced with Mn2+. Under these conditions, Mn2+ enters the cells in place of Ca2+ and quenches Fura-2 dye fluorescence, the rate of which is a direct estimate of Ca2+ influx through NSCCs. Fura-2 fluorescence was monitored after exciting the cells at 360 nm (F360) at 30 s intervals. Fluorescence excited at 360 nm is the same for Ca2+-bound and Ca2+-free Fura-2; therefore, changes in fluorescence are assumed to be caused by Mn2+ alone. PASMCs were treated with nifedipine in the absence and presence of CPA, and F360 recorded before and after addition of MnCl2 (200 μM) to the perfusate. SOCE was evaluated from the rate at which Fura-2 fluorescence was quenched by Mn2+. In a subset of experiments, AZ (100 µM) was added to all the perfusates.
To measure Ca2+ release from SR stores, PASMCs were perfused with Ca2+-free KRB solution for 10 min. This duration of perfusion with Ca2+-free solution was previously shown to not deplete intracellular stores.16 Cells were then exposed to phenylephrine (PE; 100 μM) or caffeine (1 mM) for 10 min. For cells where the effect of AZ on store release was tested, AZ (100 μM) was added to all solutions beginning with perfusion with the Ca2+-free solution. For Ca2+ release measurements, images were captured at a rate of 10/min.
DCF measurements of ROS generation
In a subset of early experiments, changes in ROS were measured using the cell-permeant fluorescent dye, 2ʹ,7ʹ-dichlorodihydrofluorescein diacetate (H2DCFDA). Upon cleavage by intracellular oxidases and oxidation, H2DCFDA is converted to 2ʹ,7ʹ-dichlorofluorescein (DCF). H2DCFDA-loaded PASMCs were excited with light filtered at 490 nm, and emitted light was detected at 510 nm. Cells were incubated with H2DCFDA by continuous perfusion with Krebs solution containing 500 nM H2DCFDA for at least 15 min before beginning measurements to allow stable uptake of dye. Baseline DCF fluorescence was monitored for at least 5 min prior to beginning drug exposures to verify that a stable baseline had been established. PASMCs were then exposed to control KRB solution or KRB solution containing AZ (100 μM) for 10 min. At the end of this period, cells were challenged with endothelin-1 (ET-1; 10−8 M). Since DCF fluorescence is detected at a single wavelength, any change in the concentration of the dye in the perfusion medium (i.e. differing concentrations between perfusion reservoirs) could result in a change in fluorescence that is not due to a change in ROS. To minimize the possibility of this type of error, all experiments were performed by perfusing from a single reservoir into which AZ and/or ET-1 were dissolved directly.
roGFP measurements of ROS generation
Because DCF is a single wavelength dye and emission values can be altered by differences in light intensity, amount of dye and photobleaching, we performed experiments exploring the effect of hypoxia on ROS generation with roGFP following the methods described by Suresh et al.38 In brief, the same experimental equipment as described for [Ca2+]i measurements was used. PASMCs cultured on glass coverslips were infected with a baculovirus containing roGFP-Grx1 (Premo redox sensor, Invitrogen) at 80 MOI. After 24 h, cells were washed and changed to basal media for 48 h prior to experimental protocols. PASMCs were mounted in the flow chamber and washed for 15 min prior to data collection. Cells were excited at 380 nm and 490 nm, and emission was observed at 510 nm. F380/F490 was measured at baseline for 5 min, followed by perfusion with KRB solution bubbled with 4% O2 for 10 min and then returned to perfusion with 16% O2-containing KRB solution. In some experiments, cells were perfused with AZ (100 µM) for 15 min prior to challenge with KRB solution containing AZ and gassed with 4% O2. Images were acquired at 5 images/min. Regions of interest containing individual cells were selected following background subtraction, and the F380/F490 ratio was calculated using ImageJ software.
Drugs and reagents
Endothelin-1 was obtained from American Peptides. roGFP was purchased from Life biotechnologies. H2DCF-DA and Fura-2 AM were purchased from Molecular Probes/ThermoFisher Scientific. Collagenase was purchased from Worthington. All other drugs were purchased from Sigma Aldrich.
Statistical analysis
All data are presented as scatter plots with bars representing mean ± SEM. For each experiment, cells from different animals were used; thus, “n” refers to both the number of biological replicates (i.e. number of animals from which cells were derived) and number of distinct experiments. Each experimental condition was performed on a different coverslip, and data from 10–30 cells per coverslip were measured and averaged to obtain a single value. Data were tested for normality and statistical comparisons were performed using Student’s t-test (paired or unpaired as appropriate).
Results
Effect of AZ on store-operated Ca2+ entry
Previous reports demonstrated that Ca2+ influx through both L-type Ca2+ channels and NSCCs contributes to the hypoxia-induced increase in [Ca2+]i in rat PASMCs.10 Previous work also showed that AZ did not directly inhibit L-type Ca2+ channels.29 Thus, as a first step in this study, we tested the ability of AZ to directly block SOCE occurring through NSCCs. In the presence of 0 mM external Ca2+, application of CPA caused a transient increase in [Ca2+]i (Fig. 2a), consistent with store depletion. Restoration of extracellular Ca2+ caused a rapid increase in [Ca2+]i that was sustained for the duration of CPA exposure. The peak change in [Ca2+]i was 210 ± 26 nM (Fig. 2b). Application of AZ did not alter baseline [Ca2+]i (117.4 ± 17.1 nM for control and 96.2 ± 15.5 nM for AZ; n = 5 each) nor the change in [Ca2+]i induced by CPA (142.0 ± 21.0 nM for control and 134.2 ± 19.9 nM for AZ; n = 5 each). Similarly, AZ had no effect on either the peak or sustained change in SOCE (Fig. 2a and b). Because the increase in [Ca2+]i measured with Ca2+ restoration is a combination of both influx and efflux mechanisms, we also measured SOCE using Mn2+ quenching of Fura-2 fluorescence. In the absence of extracellular Ca2+, the addition of extracellular Mn2+ traverses open Ca2+ channels and binds Fura-2, reducing fluorescence. It was previously demonstrated that when L-type Ca2+ channels are inhibited, the main entry pathway in PASMCs following exposure to CPA is SOCE via NSCC.39 Under these conditions, the rate of decrease in fluorescence at the 360 nm wavelength provides an estimate of Ca2+ entry through NSCCs. Mn2+-quenching of F360 was present in control cells treated with CPA to induce SOCE and was not different in the presence of AZ (Fig. 2c and d).
AZ and hypoxia-induced Ca2+ release
Since AZ had no direct effect on SOCE and did not appear to be directly inhibiting the pathways of Ca2+ influx from the extracellular space that are known to be involved in the hypoxia-induced increase in PASMC [Ca2+]i, we next tested whether the compound could be inhibiting hypoxia-induced release of Ca2+ from the SR. In control PASMCs perfused with Ca2+-free external solution, switching to KRB solution gassed with 4% O2 resulted in rapid, transient increase in [Ca2+]i (Fig. 3). However, in PASMCs pretreated with AZ, the change in [Ca2+]i in response to hypoxia was abolished in most experiments, suggesting that AZ was preventing hypoxia-induced changes in [Ca2+]i by inhibiting Ca2+ release from intracellular stores.
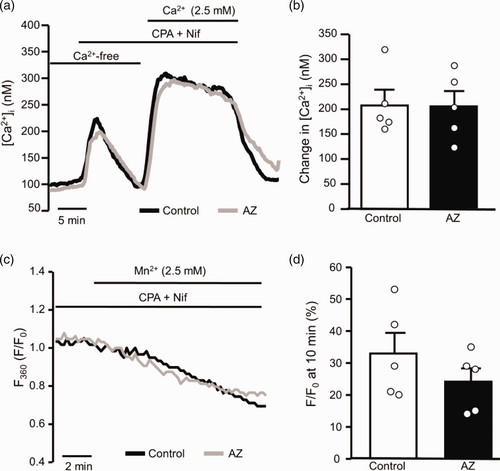
Effect of acetazolamide (AZ; 100 μM) on store-dependent Ca2+ entry in PASMCs. (a) Representative traces showing capacitative Ca2+ entry through non-selective cation channels in PASMCs in the absence and presence of AZ. Ca2+ was measured using Fura-2 in cells where intracellular stores were depleted using cyclopiazonic acid (CPA; 10 μM) in the absence of extracellular Ca2+. Reintroduction of extracellular Ca2+ caused a rapid and sustained rise in Ca2+ due to Ca2+ entry. L-type Ca2+ channels were inhibited by nifedipine (Nif; 5 μM) in the perfusate. (b) Scatter plots and bars (mean± SEM) show values for the peak change in [Ca2+]i induced by Ca2+ restoration in the absence and presence of AZ. Student’s t-test was used to test for statistical differences between groups. (c) Representative traces illustrate Mn2+-quenching of Fura-2 fluorescence at 360 nm (F360) in PASMCs perfused with Ca2+-free Krebs solution and treated with Nif and CPA in the presence and absence of AZ. (d) Scatter plots with bars showing mean±SEM indicates values for the percent change in F360, normalized to F360 at time = 0 (F0) at 10 min (F/F0) in individual Mn2+-quenching experiments. Each dot in the scatter plots represents a single experiment (average of 10–30 cells) and also represents the number of animals.
Effect of AZ on Ca2+ release from internal stores
Given the striking effect of AZ on hypoxia-induced Ca2+ release from intracellular stores, we speculated that the compound might act as a direct inhibitor of IP3R or RyRs. To test this hypothesis, we measured the effect of AZ on the change in [Ca2+]i induced by activation of SR receptors by agonists. In the absence of extracellular Ca2+, activating either RyRs (Fig. 4a–c) with caffeine (1 mM) or IP3Rs (Fig. 4b and d) with PE (100 μM) caused a rapid and pronounced, but transient, increase in [Ca2+]i. Pretreatment with AZ did not inhibit the peak change in [Ca2+]i induced by either PE or caffeine, suggesting that agonist-induced activation of SR receptors is not sensitive to AZ.
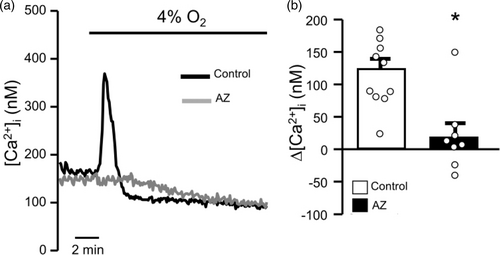
Effect of acetazolamide (AZ; 100 μM) on hypoxia-induced Ca2+ release. (a) Representative traces showing the effect of AZ on hypoxia-induced Ca2+ release from the SR. In the absence of AZ (Control) and extracellular Ca2+, hypoxia (4% O2) caused a rapid, transient increase in [Ca2+]i indicative of release from SR stores that was not observed in cells treated with AZ. (b) Scatter plot and bar graph show individual and mean± SEM values for the peak change in [Ca2+]i induced by hypoxia in the absence (Control) and presence of AZ. * indicates p < 0.05 from Control by unpaired Student’s t-test. For scatter plots, each dot represents a single experiment (average of 10–30 cells) and also represents the number of animals.
Effect of AZ on ET-1-induced ROS production
Because AZ blocked hypoxia – but not agonist-induced Ca2+ release, we next tested whether AZ might be interfering with a pathway upstream of Ca2+ release. Several studies have shown a role for hypoxia-induced ROS production in initiating the change in [Ca2+]i observed in response to hypoxia.14, 18,40–44 In order to test whether AZ might act as a general antioxidant, we measured the ability of AZ to alter ROS levels at baseline and/or prevent ROS production in response to an agonist known to induce ROS: the vasoactive peptide, endothelin-1 (ET-1), which has been shown to induce ROS production via activation of NADPH oxidase.45, 46 In the absence of AZ, we found that ET-1 caused a significant increase in DCF fluorescence in PASMCs (Fig. 5). Addition of AZ alone had no significant effect on baseline DCF fluorescence after 5 min (3.3 ± 8.9% change; n = 5; p = 0.446). In the presence of AZ, the effect of ET-1 on DCF fluorescence was not diminished, still averaging over 50% increase from baseline. These data suggest the compound was not acting as a general ROS scavenger.
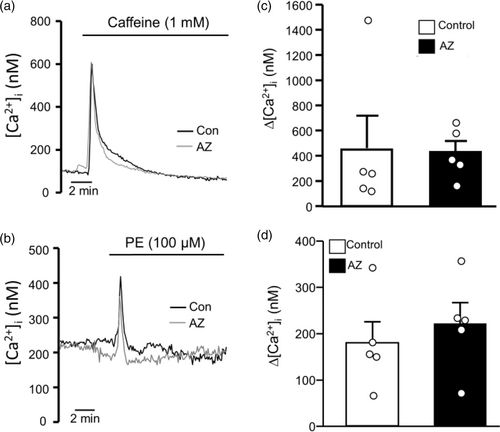
Effect of acetazolamide (AZ; 100 μM) on agonist-induced intracellular Ca2+ release. Representative traces showing the effect of (a) the RyR agonist, caffeine (1 mM), and (b) the IP3 receptor agonist, phenylephrine (PE; 100 μM), on intracellular Ca2+ concentration ([Ca2+]i) in the absence (Control) and presence of AZ. (c) Scatter plots and bars show mean ± SEM values for peak change in [Ca2+]i induced by caffeine in the absence (Control) and presence of AZ. (d) Scatter plot and bars represent individual and mean ± SEM values for peak change in [Ca2+]i induced by PE in the absence (Control) and presence of AZ. For scatter plots, each dot represents a single experiment (average of 10–30 cells) and also represents the number of animals. p Values were obtained using unpaired Student’s t-test.
Effect of AZ on hypoxia-induced ROS generation
Although we initially used DCF as a means to detect ROS production, this approach has a major limitation with respect to hypoxia. As a single wavelength dye, DCF is only appropriate for measurement of changes in ROS within a sample and with perfusion from a single reservoir. However, eliciting hypoxic responses in PASMCs requires rapid reduction in oxygen levels, which cannot be achieved by changing the gas within a reservoir and instead requires two reservoirs with pre-gassed solution. Thus, we chose to explore other newly developed ROS-detecting tools, i.e. roGFP sensors, to directly determine whether AZ might be preventing hypoxia-induced Ca2+ release by altering ROS production. Using cells infected with a baculovirus containing the roGFP construct, we measured changes in cellular ROS during challenge with hypoxia in the absence and presence of AZ. In untreated cells, reducing oxygen levels to 4% O2 resulted in a rapid increase in roGFP fluorescence (Fig. 6a), consistent with production of ROS. With re-oxygenation, roGFP fluorescence rapidly returned to original levels. However, in cells pretreated with AZ, no change in roGFP fluorescence was observed in response to hypoxia (Fig. 6b and c). The lack of response to hypoxia in AZ-treated cells could not be attributed to a direct effect of AZ on basal roGFP fluorescence, as perfusion with AZ alone for 15 min resulted in no significant change in fluorescence (3.5 ± 12.0% change in fluorescence (n = 3; p = 0.67)).
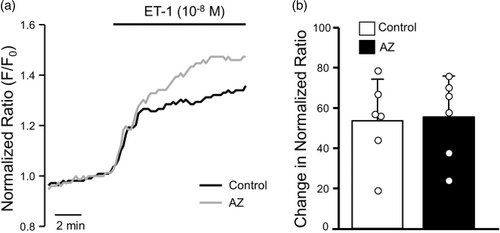
Effect of acetazolamide (AZ; 100 μM) on endothelin-1 (ET-1)-induced reactive oxygen species generation. (a) Representative traces showing DCF fluorescence normalized to baseline value (F/F0) in response to ET-1 (10−9 M) challenge in the absence (Control) and presence of AZ. (b) Scatter plot and bars represent individual and mean ± SEM values for percent change in F/F0 at 10 min after challenge with ET-1 in the absence (Control) and presence of AZ. For scatter plots, each dot represents a single experiment (average of 10–30 cells) and also represents the number of animals.
Discussion
While the inhibiting effects of AZ on HPV have been known for some time, the mechanism by which AZ affords protection from HPV and hypoxia-induced changes in PASMC [Ca2+]i remains incompletely understood. Previous experiments ruled out changes in intracellular acidification, membrane potential or direct effects on voltage-gated Ca2+ channels.29 In this study, we found that AZ does not directly inhibit Ca2+ influx through NSCCs induced by store-depletion nor does it block agonist-induced Ca2+ release from receptors (IP3R or RyRs) on the SR. Rather, during hypoxia AZ prevented production of ROS, which was associated with a lack of Ca2+ release from the SR.

Effect of acetazolamide (AZ; 100 μM) on oxidant production in response to hypoxia (4% O2). (a) Representative traces show roGFP fluorescence normalized to baseline in response to hypoxia in the absence (Control) and presence of AZ. (b) Scatter plots and bar graphs show individual and mean ± SEM values for change in normalized fluorescence measured at peak response (15 min) in the absence (Control) and presence of AZ. * indicates p < 0.05 from Control via unpaired Student’s t-test. For scatter plots, each dot represents a single experiment (average of 10–30 cells) and also represents the number of animals.
It is widely accepted that generation of HPV requires an elevation in [Ca2+]i. The sources of Ca2+ comprising the response to hypoxia in PASMCs have been extensively studied, with general consensus that release from internal stores and influx through voltage-gated (L-type) Ca2+ channels and NSCCs are contributing factors.10,12–17, 41, 47 Interestingly, previous work showed that AZ had no effect on basal [Ca2+]i levels and did not alter changes in [Ca2+]i induced by potassium chloride (KCl),29 indicating that the drug did not act as a Ca2+ chelator and did not block depolarization-driven Ca2+ influx through L-type Ca2+ channels. The differential inhibitory effect of AZ on the increases in [Ca2+]i in response to hypoxia and KCl corroborated data reporting that hypoxia can cause Ca2+ influx through pathways other than L-type Ca2+ channels. For example, NSCCs, which include Ca2+ permeable channels that can be activated when intracellular stores are depleted, have been implicated in hypoxia-induced Ca2+ responses in PASMCs and in HPV measured in whole animals and intact lung preparations.10–12, 48, 49 Thus, a first step in the current study was to evaluate the ability of AZ to directly block Ca2+ influx through NSCCs induced by store-depletion (SOCE). Under these conditions, capacitive Ca2+ entry following store depletion is believed to act as a mechanism to refill SR stores and can be visualized as a large increase in [Ca2+]i when extracellular Ca2+ levels are returned to normal. As expected, restoration of extracellular Ca2+ levels following store depletion resulted in a large and sustained increase in [Ca2+]i, consistent with previous reports.10, 39, 50, 51 Because the increase in [Ca2+]i measured in this type of Ca2+-restoration experiment reflects a composite response including both influx and effluent mechanisms, we also measured the effect of AZ on Mn2+ quenching, a more direct measure of Ca2+ entry. Surprisingly, AZ at a concentration and time of treatment sufficient to block hypoxia-induced changes in [Ca2+]i29 had no effect on SOCE measured by either method. Since AZ blocks the overall Ca2+ response to hypoxia, which several labs have shown requires SOCE, our main intent with these experiments was to demonstrate whether AZ had a direct effect on SOCE (i.e. directly inhibited this channel). Thus, we only performed experiments under non-hypoxic conditions. Overall, our data suggest that AZ does not directly inhibit Ca2+ influx through NSCCs.
Given the inability of AZ to directly inhibit the activation of NSCCs and L-type Ca2+ channels, the major Ca2+ influx pathways responsible for hypoxia-induced changes in PASMC [Ca2+]i, we next determined whether AZ might be blocking hypoxia-induced Ca2+ release from intracellular stores. In control PASMCs, we observed a large, transient increase in [Ca2+]i in response to hypoxia in the absence of extracellular Ca2+, which has previously been shown to be due to release from both RyRs and IP3Rs.14–17 We found that AZ completely prevented hypoxia-induced Ca2+ release and speculated that the lack of response might be due to a direct inhibitory action of AZ on either SR receptor type. To our surprise, Ca2+ release in response to PE, which stimulates release from IP3Rs, or caffeine, which stimulates release from RyRs, was unaltered by AZ. The lack of inhibition of Ca2+ release in response to PE or caffeine indicates that AZ was not directly inhibiting these channels and is consistent with the lack of effect of AZ on CPA-induced Ca2+ responses measured in the capacitive Ca2+ entry experiments, since CPA increases [Ca2+]i by inhibiting Ca2+ reuptake into the SR following passive leak from IP3Rs and RyRs. These results also confirm that the effect of AZ on PASMC Ca2+-signaling during hypoxia was not due to toxicity or a non-specific inability to mobilize intracellular Ca2+. Rather, our results suggested that AZ may be interfering with hypoxia signaling pathways upstream of IP3Rs and RyRs.
The exact mechanism by which hypoxia triggers Ca2+ release from the SR is still being investigated. Several possibilities have been proposed (reviewed in Sylvester et al.52), including ROS-dependent activation of Ca2+ release.14, 18 While it is clear that ROS production changes with hypoxia in PASMCs, whether hypoxia causes an increase42 or decrease53 in ROS has been a matter of some debate (see literature52,54–56 for review). In our current study, roGFP fluorescence increased in response to hypoxia, consistent with other reports demonstrating hypoxia induced an increase in ROS production.42,57–60 Surprisingly, AZ completely prevented the hypoxia-induced increase in roGFP fluorescence.
Interestingly, Waypa et al.43, 61 showed that hypoxia caused an increase in mitochondrial ROS production in PASMCs that was required for the hypoxia-induced increase in [Ca2+]i. Similar results were observed in mouse lung slices, where blockade of mitochondrial ROS production or removal of extracellular Ca2+ reduced HPV.40 While the exact source of the increased [Ca2+]i in those studies was not explored, other work has linked activation of Ca2+ release from SR stores to ROS generation from NADPH oxidase and mitochondria.14, 18, 41, 62 Our results showing that inhibition of hypoxia-induced Ca2+ release by AZ was associated with suppression of hypoxia-induced ROS generation support the idea that ROS promote Ca2+ release in PASMCs during hypoxia; however, we acknowledge that since we did not specifically test whether production of ROS was required for the hypoxia-induced increase in [Ca2+]i in this study, it remains possible that AZ prevented the hypoxia-induced Ca2+ release by interference with a non-ROS-dependent mechanism.
The mechanism by which AZ prevented hypoxia-induced increases in ROS remains unclear. To test whether AZ might be acting as a general ROS scavenger, we examined whether basal ROS levels were altered by addition of AZ, finding no effect on baseline fluorescence of either DCF or roGFP. Thus, AZ itself was not oxidizing or reducing our ROS sensors. We next tested whether AZ could diminish ROS production by a different agonist: ET-1. ET-1 is a known pulmonary vasoconstrictor believed to modulate HPV52, 63 and has been shown to produce ROS in PASMCs,64–66 likely via activation of NADPH oxidase.45, 46 However, in our experiments, AZ had no effect on ROS production in response to ET-1, refuting the possibility that AZ was simply acting as a general antioxidant, which has been reported for other compounds containing a similar thiadiazole ring.67 These results would also appear to suggest that AZ does not inhibit NADPH oxidase, which has been proposed as part of the mechanism by which ROS generation and [Ca2+]i are increased during hypoxia.18, 41 Instead, it is likely that AZ targets mitochondrial ROS. In several studies, the site of hypoxia-induced ROS production in PASMCs has been localized to Complex III in mitochondria,43, 44, 61, 62 whereas other studies have demonstrated the requirement for Complex II.68 While our data point to AZ interfering with ROS production during hypoxia, whether this occurs at Complex III, at a different site in mitochondria, or via different ROS generating pathways will require further exploration.
One limitation of this study was that we used two different fluorescent dyes to measure ET-1- and hypoxia-induced changes in ROS. While DCF, a single wavelength dye, could easily be used to examine the effects of ET-1 on ROS where perfusion occurred from a single reservoir, exploring the effect of hypoxia was more uncertain since experiments using hypoxia required perfusion of cells from different pre-gassed reservoirs, which could introduce errors due to differences in DCF concentration between solutions. With the development of roGFP,69 a genetically encoded construct that allows ratiometric measures of ROS levels, we were able to more accurately measure hypoxia-induced changes in ROS. Although our experiments utilized different ROS sensors, we nonetheless believe that the results obtained point to a specific role of AZ in inhibiting hypoxia-induced ROS.
In previous experiments, the effect of AZ on HPV and hypoxia-induced Ca2+ responses was shown to be independent of carbonic anhydrase inhibition as an AZ analogue with the sulfonamide group substituted with a methyl group (N-meth-AZ) was similarly potent in inhibiting HPV and hypoxia-induced elevations in PASMC [Ca2+]i.29, 33 While we did not perform experiments using N-meth-AZ in this study, the fact that Ca2+ release is required for the global hypoxia-induced increase in [Ca2+]i in PASMCs, which was blocked by N-meth-AZ in earlier studies,29 strongly supports the likelihood that the effects of AZ on ROS and Ca2+ release are independent of carbonic anhydrase.
In addition to attenuating acute HPV, AZ has also been shown to reduce the development of pulmonary hypertension in response to chronic hypoxia.70 Although the exact extent to which contractile mechanisms involved in HPV contribute to enhanced contraction and increased pulmonary arterial pressure during chronic hypoxia are unclear, it is tempting to speculate that reducing pulmonary arterial contraction could contribute to the effect of AZ on pulmonary hypertension. Along these lines, an elevation in [Ca2+]i via NSCCs maintains elevated baseline tone in pulmonary vascular smooth muscle from chronically hypoxic rats.71 Moreover, enhanced production of ROS in PASMCs from chronically hypoxic rats, contributing to augmented contraction, has been reported,65 raising the possibility that AZ may mediate effects on hypoxia-induced pulmonary hypertension via modulation of ROS and Ca2+ signaling.
In summary, we found that AZ blocks the rise in PASMC [Ca2+]i that occurs in response to hypoxia by preventing hypoxia-induced Ca2+ release. Given the previously reported links between ROS and [Ca2+]i and the requirements of Ca2+ release for elevated [Ca2+]i during hypoxia, it seems likely that AZ exerts its inhibitory effect on HPV and the hypoxia-mediated increase in [Ca2+]i in PASMCs by preventing hypoxia-induced ROS production and subsequent triggering of Ca2+ release. Thus, this study sheds new light on the mechanism of action of AZ with respect to repression of hypoxia-induced Ca2+ signaling, and points to future areas of investigation to further refine our understanding of how this compound modulates HPV.
Authors’ contribution
LAS, CU, XY, JTS, KS and ERS designed experiments, LAS, CU, XY, HJ and KS performed experiments, LAS and CU analyzed results, LAS, CU, KS, XY, HJ, JTS and ERS drafted article and approved final version.
Conflict of interest
The author(s) declare that there is no conflict of interest.
Ethical approval
Procedures and protocols were approved by the Johns Hopkins University Animal Care and Use Committee.
Guarantor
NA.
Funding
The author(s) disclosed receipt of the following financial support for the research, authorship, and/or publication of this article: This work was funded by grants from NIH (K08 HL132055, R01 HL067191 and R01 HL073859).
ORCID iD
Larissa A. Shimoda https://orcid.org/0000-0001-5987-1378


