Guild Dynamics and Pathogen Interactions in Hyalomma Ticks From Algerian Cattle
Abstract
Ticks are pivotal in transmitting a variety of pathogens that affect both humans and animals. These pathogens often occur in guilds, groups of species that exploit similar resources in similar ways. Although the composition of tick-borne pathogen (TBP) guilds is well-documented, the interactions among pathogens within these guilds remain poorly understood. We hypothesized that abiotic and biotic factors significantly influence the patterns of occurrence and interactions among pathogens within these guilds. To investigate this, we analyzed microfluidic-based high-throughput data on microorganisms from 166 Hyalomma excavatum ticks (94 male and 72 female) collected across different seasons from cattle in the central Algerian steppe using network analysis to uncover complex pathogen–pathogen interaction patterns. We found that female ticks had a higher infection rate (63.9%) with common pathogens such as Rickettsia slovaca (26.4%), unclassified Apicomplexa (22.2%), and Borrelia afzelii (19.4%). Male ticks showed a 56.4% infection rate, with Rickettsia (31.1%) and R. slovaca (16%) being the most prevalent. Notable pathogen–pathogen interactions within guilds were identified, with positive associations such as between R. slovaca and Rickettsia conorii in males, and B. afzelii and Borrelia spielmanii in females, indicating cooperative interactions. Conversely, negative associations, such as between Anaplasma phagocytophilum and Francisella tularensis, suggested competitive exclusion. The observed variation in interaction patterns under different conditions indicates that ecological determinants, both biotic and abiotic, influence pathogen association dynamics within guilds. These findings have significant implications for understanding disease transmission and developing control strategies.
1. Introduction
The rise in emerging zoonotic diseases, particularly tick-borne diseases, not only threatens public health but also has significant economic implications for the agricultural sector [1, 2]. As nearly 80% of the world’s livestock is affected by ticks and the pathogens they carry, these diseases contribute to increased costs and production losses, especially in regions heavily reliant on cattle farming [3–7].
In Algeria, where cattle farming is a key industry, the prevalence of ticks, particularly those from the Hyalomma genus, including species like Hyalomma anatolicum, Hyalomma excavatum, and Hyalomma marginatum, poses a considerable challenge [8–11]. The documented presence of 24 tick species [8, 12, 13] underscores the ongoing risk to both animal and human health, reinforcing the need for integrated disease management effort. Previous studies have primarily focused on identifying these species, but fewer have explored the interactions among pathogens they transmit, which is essential for predicting outbreaks and managing disease risks.
Pathogen–pathogen interactions during coinfections can have ecological and epidemiological consequences [14], including increased virulence [15], gene transfer [16], and altered immune responses in hosts that exacerbate disease progression [17, 18]. Building on previous work [19, 20], this study uses advanced methods to explore these interactions in more detail, expanding on traditional pathogen identification by utilizing high-throughput microfluidic PCR and network analysis.
High-throughput PCR allows for simultaneous detection of multiple pathogens, offering deeper insights into pathogen diversity within individual ticks or populations than older methods like serology or standard PCR [21, 22]. Meanwhile, network analysis enables the mapping of pathogen co-occurrence and interaction patterns, which are crucial for understanding the ecological networks that shape disease transmission [23]. These tools have been successfully employed in recent studies to map tick-borne pathogen (TBP) communities across various ecosystems, revealing complex interspecies interactions [24, 25].
The ecological relevance of the ticks and pathogens is significant [21, 26]. Hyalomma ticks are known vectors for multiple zoonotic pathogens, including Rickettsia spp. and Theileria spp., which impact both human and animal health [5, 7]. Their feeding behavior, extended in female ticks, increases the efficiency of pathogen transmission [22]. Additionally, the microbiota of ticks influences pathogen survival and interaction, adding another layer of complexity to TBP dynamics [27]. Abiotic factors such as temperature and humidity also play a crucial role; higher temperatures have been shown to accelerate pathogen replication [28], while seasonal variations affect both tick activity and pathogen prevalence [2, 29].
This study aims to deepen the understanding of pathogen dynamics in ticks by exploring TBP guilds (TBPGs). In ecological terms, a guild refers to species that utilize the same types of resources in similar ways [30], and in TBPs, these guilds often involve pathogens sharing a host [31], such as Hyalomma ticks. These interactions, whether competitive or cooperative, shape community structure and influence disease transmission dynamics [32, 33]. For example, pathogens may compete for limited resources, such as access to the tick’s immune system, resulting in competitive exclusion [34], or they may cooperate and enhancing each other’s survival and transmission through coinfection [35].
We hypothesize that TBP interactions are influenced by tick sex, with male and female Hyalomma ticks showing different pathogen assemblages and interaction patterns. Additionally, seasonal changes are expected to affect TBP composition and interactions. Conducted in the Djelfa region of Algeria, this research utilizes advanced molecular techniques, including high-throughput PCR and network analysis, to provide the first comprehensive examination of TBP communities in Hyalomma ticks in the country. By investigating the combined effects of biotic (tick sex) and abiotic factors (seasonal changes), this study not only identifies the presence of multiple pathogens, but also reveals how their interactions within shared ecological niches (guilds) influence disease dynamics. These findings offer critical insights into the ecological and epidemiological drivers of disease transmission and the evolutionary strategies pathogens employ within the tick–host system, with significant implications for controlling tick-borne diseases in Algeria and similar regions.
2. Materials and Methods
2.1. Tick Collection
A total of 166 ticks (94 males and 72 females) were collected throughout the year 2021–2022 from 60 local breed cattle across different seasons in the province of Djelfa, Algeria (winter: 14 females and 24 males; spring: 15 females and 23 males; summer: 25 females and 23 males; autumn: 18 females and 24 males). Djelfa, positioned at 34°40′00"N and 3°15′00"E and known as the steppe capital of Algeria, provided a unique setting for this study due to its distinct environmental conditions. The semiarid climate, marked by hot summers, cold winters, sparse vegetation, and varying altitude, influences the behavior and survival of tick populations, making it an ideal location for observing how these factors affect tick–host interactions. Each cattle underwent meticulous manual inspections to ensure all ticks adhering to the skin were thoroughly removed and preserved in 70% ethanol for further analysis.
The ticks were accurately identified using a binocular magnifier (Optika, Ponteranica, Italy), with identification aided by the detailed keys from Walker et al. [36], and confirmed through sequencing of the 16S rRNA gene by molecular PCR tools. This comprehensive approach allowed for detailed study of the ticks in an environment where their natural behaviors are notably influenced by the climatic and ecological conditions of the region and confirmed through sequencing of the 16S rRNA gene by molecular PCR tools.
2.2. Nucleic Acid Extraction
Before extracting nucleic acids, each tick was meticulously washed with sterile milli-Q water to ensure cleanliness. DNA extraction followed, using the NucleoSpin tissue kit for Genomic DNA from tissue (Macherey-Nagel, Düren, Germany). The manufacturer’s “Standard protocol for human or animal tissue and cultured cells” was employed with minor modifications tailored to our specific requirements. After disinfecting the ticks, they were carefully sectioned into quarters on a sterile petri dish using a sterile scalpel blade and then, transferred to the extraction tube that contained the provided lysis buffer. The lysis process was completed in these prefilled tubes, followed by centrifugation to separate the DNA-containing supernatant. This supernatant was then used for DNA quantification, performed with a NanoDrop spectrophotometer (Thermo Fisher Scientific, USA) at an absorbance ratio of A260/A280 to ensure purity. Finally, the extracted DNA was stored at −20°C for subsequent analyses, maintaining its integrity for future genetic examinations.
2.3. DNA Preamplifcation for Microfluidic Real-Time PCR
To enhance the detection of the pathogen’s genetic material relative to the host’s, the DNA was preamplified using the Standard BioTools preamplification kit (Standard BioTools, CA, USA). Following the manufacturer’s guidelines, the process began by preparing a 0.2x pool, and then conducting PCR preamplification. Primers were combined in equal volumes to create a pooled primer mix with a final concentration of 200 nM. The preamplification reaction was performed in a 5 μl volume, comprising 1 μl of PreAmp Master Mix, 1.25 μl of the pooled primer mix, 1.5 μl of distilled water, and 1.25 μl of DNA. The thermocycling program initiated with an initial cycle at 95°C for 2 min, followed by 14 cycles of 95°C for 15 s and 60°C for 4 min. After completion, the amplification products were diluted to a 1/10th concentration and stored at −20°C to minimize contamination risks, ensuring the integrity of the samples for subsequent analysis.
2.4. Microfluidic Real-Time PCR Assay
Michelet et al. [37] extensively detailed the techniques utilized in their study, which focused on detecting tick-borne microorganisms. The primary method employed 48.48 Dynamic Array IFC chips (Standard BioTools, CA, USA) used within the BioMark real-time PCR system. These chips allow for the separation of 48 PCR assays and 48 samples into individual wells where real-time PCR reactions occur in separate chambers thanks to an on-chip microfluidics assembly. Each chip also includes a negative water control (Milli-Q water) to ascertain the absence of contaminants, and DNA from the Escherichia coli strain EDL933 (Milli-Q water and DNA diluted to 1/10) serves as an internal inhibition control in the assay plate to validate the absence of PCR inhibitors, using specific primers and a probe targeting the E. coli gene.
Once loaded, the BioMark real-time PCR system was programmed with parameters as reported in earlier studies [38]. Throughout this process, stringent sterility measures are maintained to ensure accurate results. Postrun analysis was conducted using the “Fluidigm Real-Time PCR Analysis” software, and results were annotated in Excel. The genes targeted and the primer sequences employed for amplification are detailed in Supporting Information 1: Table S1. This investigation cataloged a comprehensive range of tick-borne microorganisms, including 27 bacterial species such as Borrelia burgdorferi, B. garinii, B. afzelii, B. valaisiana, B. lusitaniae, B. spielmanii, B. bissettii, B. miyamotoi, Anaplasma marginale, A. platys, A. phagocytophilum, A. bovis, A. centrale, A. ovis, Ehrlichia canis, N. mikurensis, R. conorii, R. slovaca, R. massiliae, R. helvetica, R. aeschlimannii, R. felis, Bartonella henselae, Francisella tularensis, Francisella-like endosymbionts (FLEs), Coxiella-like endosymbionts (CLEs), and Coxiella burnetii. Additionally, seven parasite species were identified, including Babesia microti, B. canis, B. ovis, B. divergens, B. bovis, B. caballi, and Babesia sp. EU1. The bacterial genera included were Bartonella, Borrelia, Anaplasma, Ehrlichia, Rickettsia, and Mycoplasma, and parasite taxa encompassed Apicomplexa, Theileria, and Hepatozoon, providing a thorough overview of the pathogens present in tick populations.
2.5. Confirmation of Pathogen Presence Using Conventional PCR
TBPs were detected through conventional and nested PCR assays, with the cycling conditions and primers detailed in Supporting Information 2: Table S2. Additional PCR assays, utilizing species-specific primers, further confirmed the presence of certain target TBPs identified in the initial analysis. This crucial confirmation step strengthens the accuracy and reliability of the findings by providing an additional layer of validation [23].
2.6. DNA Sequencing Analysis
The PCR products were sequenced by Eurofins Genomics (Ebersberg, Germany), and the sequences were assembled using BioEdit software from Ibis Biosciences in Carlsbad, CA, USA. Our findings were then compared against publicly available sequences in GenBank using the online BLAST tool provided by the National Center for Biotechnology Information (NCBI, Bethesda, MD, USA), available at http://www.ncbi.nlm.nih.gov/blast.
2.7. Phylogenetic Analysis
A phylogenetic analysis of TBPs associated with Hyalomma species was performed, grouping them into 10 guilds based on collection seasons and sexs (M: males, MW: males collected in winter, MSP: males collected in spring, MSU: males collected in summer, MA: males collected in autumn, F: females, FW: females collected in winter, FSP: females collected in spring, FSU: females collected in summer, and FA: females collected in autumn). The details about pathogens identified in these TBPGs are provided in Supporting Information 3: Table S3. For this purpose, reference sequences of the 16S rRNA (bacterial pathogens) and 18S rRNA (eukaryotes) genes fragments were searched in the National Library of Medicine database; NCBI (accessed 13 June 2024). Then all sequences of particular species showing similarity to the reference ones were downloaded from the Blast database. Finally, sequences of up to 1800 nucleotides in length, excluding redundant ones underwent initial alignment using the online MAFFT tool [39]. Next, obtained set of sequences was analyzed using the MUSCLE algorithm in MEGA 11 [40]. Phylogenetic trees were then constructed using the Tamura-Nei model with Gamma distribution (TN93+G) and the Tamura 3-parameter model (T92) for the 16S rRNA and 18S rRNA gene, respectively.
Moreover, our aim was to investigate whether there is a consistent pattern of genetic distances between TBPs within each guild and whether this pattern holds across guilds. To this end, the pairwise distance between sequences within each guild was calculated (as p-distance) in MEGA 11. Furthermore, the statistical significance of differences in p-distance between the studied groups (guilds) was calculated using the Mann–Whitney U test, while the significance of differences in p-distance within particular guilds was calculated using the Wilcoxon test. Statistical calculations were performed using GraphPad 8.0 (Prism, Massachusetts, USA).
2.8. Statistical Analysis
The gathered data were assembled using Microsoft Excel 2016. Prevalence rates and 95% binomial confidence intervals (CIs) for each TBP infection and coinfection were calculated based on microfluidic real-time PCR amplification results. Chi-square tests (χ2) were conducted to compare TBP prevalence between males and females, a p value <0.05 was considered significant, the calculations were performed using SPSS software version 22.
2.9. Coinfections and Network Interactions Between Microorganisms
Interaction networks were constructed using results from high-throughput microfluidic analyses, allowing simultaneous detection of multiple pathogens in ticks. The presence of some of these pathogens was confirmed by nested PCR. Only edges with weights of 1 and −1 were included. The resulting association networks, visualized as R plots, were constructed and refined using Gephi [44]. In each network, node color and size were indicative of modularity class and eigenvector centrality. The network’s spatial layout was optimized using Yifan Hu and Fruchterman Reingold parameters within Gephi. Positive and negative interactions were determined from the correlation coefficients of abundance data. Network complexity was evaluated by examining the number of nodes, edges, and overall interaction patterns. Nodes within the network represent microorganisms, while blue and red edges denote positive and negative associations, respectively. An R script detailing the calculation of Yule’s Q and the construction of the co-occurrence network is provided as additional material (Supporting Information 4: File S1).
3. Results
3.1. Tick Morphological and Genetic Classification
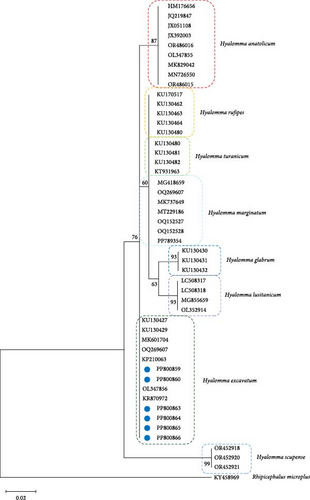
The ticks were morphologically identified as H. excavatum. To confirm this identification with higher precision, advanced PCR techniques were applied. Subsequent sequencing of the 16S rRNA gene definitively confirmed the presence of H. excavatum. The phylogenetic relationships of the sequences obtained further supported this identification (Figure 1). The sequences were submitted to GenBank and assigned the following accession numbers: PP800859, PP800860, PP800863, PP800864, PP800865, and PP800866. This multitiered approach of morphological examination followed by genetic verification ensured a robust classification of the tick specimens.
3.2. Diversity of TBPs in Ticks
The diversity of TBPs was analyzed in 166 Hyalomma ticks, consisting of 72 females and 94 males. Overall, 63.9% of female ticks (46/72; Table 1) and 56.4% of male ticks (53/94; Table 2) tested positive for at least one pathogen. Single infections were more common in males (45.8%, 43/94) than females (19.4%, 14/72), while coinfections were more frequent in females (44.4%, 32/72; Table 1) compared to males (10.6%, 10/94; Table 2).
| Vector-borne pathogen(s) | Total | Prevalence rate (%) | 95% CI |
|---|---|---|---|
| Total infected ticks (≥1 pathogen) | 46 | 63.89 | 51.65–74.63 |
| R. slovaca | 19 | 26.39 | 17.01–38.31 |
| Apicomplexa | 16 | 22.22 | 13.61–33.85 |
| B. afzelii | 14 | 19.44 | 11.41–30.80 |
| Rickettsia sp. | 13 | 18.06 | 10.33–29.26 |
| R. conorii | 12 | 16.67 | 9.27–27.70 |
| N. mikurensis | 11 | 15.28 | 8.23–26.12 |
| B. spielmanii | 10 | 13.89 | 7.22–24.52 |
| Anaplasma sp. | 8 | 11.11 | 5.26–21.26 |
| Hepatozoon sp. | 6 | 8.33 | 3.43–17.88 |
| R. aeschlimannii | 5 | 6.94 | 2.58–16.14 |
| Mycoplasma sp. | 2 | 2.78 | 0.48–10.58 |
| Theileria sp. | 2 | 2.78 | 0.48–10.58 |
| A. phagocytophilum | 1 | 1.39 | 0.07–8.54 |
| Bartonella sp. | 1 | 1.39 | 0.07–8.54 |
| F. tularensis | 1 | 1.39 | 0.07–8.54 |
| Single infections | 14 | 19.44 | 11.41–30.80 |
| Rickettsia sp. | 5 | 6.94 | 2.58–16.14 |
| Apicomplexa | 2 | 2.78 | 0.48–10.58 |
| N. mikurensis | 2 | 2.78 | 0.48–10.58 |
| R. slovaca | 2 | 2.78 | 0.48–10.58 |
| B. spielmanii | 1 | 1.39 | 0.07–8.54 |
| Mycoplasma sp. | 1 | 1.39 | 0.07–8.54 |
| Anaplasma sp. | 1 | 1.39 | 0.07–8.54 |
| Mixed infections | 32 | 44.44 | 32.90–56.59 |
| Mixed infection with two pathogens | 11 | 15.28 | 6.22–22.90 |
| R. slovaca + R. aeschlimannii | 2 | 2.78 | 0.48–10.58 |
| R. slovaca + R. conorii | 1 | 1.39 | 0.07–8.54 |
| R. slovaca + Apicomplexa | 1 | 1.39 | 0.07–8.55 |
| Rickettsia sp. + B. spielmanii | 1 | 1.39 | 0.07–8.54 |
| B. afzelii + B. spielmanii | 1 | 1.39 | 0.07–8.55 |
| A. phagocytophilum + Rickettsia sp. | 1 | 1.39 | 0.07–8.56 |
| B. afzelii + Rickettsia sp. | 1 | 1.39 | 0.07–8.57 |
| N. mikurensis + Apicomplexa | 1 | 1.39 | 0.07–8.58 |
| R. slovaca + F. tularensis | 1 | 1.39 | 0.07–8.59 |
| B. afzelii + Anaplasma sp. | 1 | 1.39 | 0.07–8.60 |
| Mixed infection with three pathogens | 9 | 12.50 | 6.22–22.90 |
| R. slovaca + R. conorii + Apicomplexa | 3 | 4.17 | 1.08–12.50 |
| R. slovaca + R. conorii + N. mikurensis | 1 | 1.39 | 0.07–8.54 |
| N. mikurensis + Apicomplexa + R. conorii | 1 | 1.39 | 0.07–8.55 |
| R. slovaca + R. conorii + Anaplasma sp. | 1 | 1.39 | 0.07–8.56 |
| B. afzelii + B. spielmanii + R. slovaca | 1 | 1.39 | 0.07–8.57 |
| N. mikurensis + Apicomplexa + Rickettsia sp. | 1 | 1.39 | 0.07–8.58 |
| R. slovaca + R. conorii + B. afzelii | 1 | 1.39 | 0.07–8.54 |
| Mixed infection with four pathogens | 6 | 8.33 | 3.43–17.88 |
| Rickettsia sp. + Bartonella sp. + B. afzelii + Apicomplexa | 1 | 1.39 | 0.07–8.54 |
| R. slovaca + R. conorii + R. aeschlimannii + Hepatozoon sp. | 1 | 1.39 | 0.07–8.55 |
| B. afzelii + B. spielmanii + Rickettsia sp. + Anaplasma sp. | 1 | 1.39 | 0.07–8.56 |
| B. afzelii + B. spielmanii + Anaplasma sp. + Apicomplexa | 1 | 1.39 | 0.07–8.57 |
| Apicomplexa + Mycoplasma sp. + Theileria sp. + Hepatozoon sp. | 1 | 1.39 | 0.07–8.58 |
| B. afzelii + N. mikurensis + Rickettsia sp. + Hepatozoon sp. | 1 | 1.39 | 0.07–8.59 |
| Mixed infection with five pathogens | 4 | 5.56 | 1.79–14.35 |
| B. afzelii + Anaplasma sp. + N. mikurensis + Rickettsia sp. + Apicomplexa | 1 | 1.39 | 0.07–8.54 |
| R. slovaca + B. spielmanii + R. conorii + Apicomplexa + Hepatozoon sp. | 1 | 1.39 | 0.07–8.55 |
| B. afzelii + Anaplasma sp. + N. mikurensis + R. aeschlimannii + Hepatozoon sp. | 1 | 1.39 | 0.07–8.56 |
| R. slovaca + R. conorii + B. afzelii + B. spielmanii + N. mikurensis | 1 | 1.39 | 0.07–8.57 |
| Mixed infection with six pathogens | 1 | 1.39 | 0.07–8.58 |
| R. slovaca + R. conorii + B. afzelii + B. spielmanii + Theileria sp. + Apicomplexa | 1 | 1.39 | 0.07–8.59 |
| Mixed infection with eight pathogens | 1 | 1.39 | 0.07–8.60 |
| Hepatozoon sp. + Apicomplexa + R. slovaca + R. aeschlimannii + B. afzelii + B. spielmanii + Anaplasma sp. | 1 | 1.39 | 0.07–8.61 |
| Not detected | 26 | 36.11 | 25.37–48.35 |
- Abbreviations: CI, confidence interval; TBPs, tick-borne pathogens.
Across both sexes, Rickettsia spp. dominated the pathogen landscape, with R. slovaca most prevalent in females (26.4%) and Rickettsia spp. highest in males (31.1%). Other notable pathogens in females included Apicomplexa (22.2%) and Borrelia afzelii (19.4%; Table 1), while males showed lower prevalence for Apicomplexa (5.3%) and R. slovaca (15.1%; Table 2).
A χ2 test (χ2 = 62.94, p < 0.001) confirmed significant differences in TBP diversity between sexes, suggesting distinct transmission dynamics and ecological exposures for males and females. Pathogens such as A. phagocytophilum, B. afzelii, and B. spielmanii were detected only in females, while Ehrlichia was found exclusively in males, further highlighting sex-specific pathogen associations.
3.3. Coinfections Between Tick-Borne Microorganisms
Coinfections were more frequent in females (44.4%, 32/72; Table 1) compared to males (10.6%, 10/94; Table 2). In females, coinfections involving two pathogens occurred in 15.3%, while coinfections of three to eight pathogens were also observed, with R. slovaca, R. conorii, and Apicomplexa being the most frequent combination (4.2%, 3/72; Table 1). In males, coinfections typically involved two pathogens (9.6%), with the most common pairing being Apicomplexa and Rickettsia (3.2%, 3/94; Table 2).
| Vector-borne pathogen(s) | Total | Prevalence rate (%) | 95% CI |
|---|---|---|---|
| Total infected ticks (≥1 pathogen) | 53 | 56.38 | 45.78–66.46 |
| Rickettsia sp. | 30 | 31.91 | 22.89–42.44 |
| R. slovaca | 15 | 15.96 | 9.5–25.27 |
| R. conorii | 6 | 6.38 | 2.62–13.91 |
| Apicomplexa | 5 | 5.32 | 1.97–12.55 |
| Anaplasma sp. | 1 | 1.06 | 0.06–6.62 |
| Bartonella sp. | 1 | 1.06 | 0.06–6.62 |
| Ehrilichia sp. | 1 | 1.06 | 0.06–6.62 |
| F. tularensis | 1 | 1.06 | 0.06–6.62 |
| N. mikurensis | 1 | 1.06 | 0.06–6.62 |
| R. Aeschlimannii | 1 | 1.06 | 0.06–6.62 |
| Theileria sp. | 1 | 1.06 | 0.06–6.62 |
| Single infections | 43 | 45.74 | 35.54–56.3 |
| Rickettsia sp. | 27 | 28.72 | 20.09–39.12 |
| R. slovaca | 11 | 11.70 | 6.27–20.38 |
| R. conorii | 2 | 2.13 | 0.37–8.21 |
| Ehrilichia sp. | 1 | 1.06 | 0.06–6.62 |
| N. mikurensis | 1 | 1.06 | 0.06–6.62 |
| R. aeschlimannii | 1 | 1.06 | 0.06–6.62 |
| Mixed infections | 10 | 10.64 | 5.5–19.12 |
| Mixed infection with two pathogens | 9 | 9.57 | 4.74–17.85 |
| Apicomplexa + Rickettsia sp. | 3 | 3.19 | 0.83–9.71 |
| R. slovaca + R. conorii | 3 | 3.19 | 0.83–9.71 |
| Apicomplexa + Theleiria | 1 | 1.06 | 0.06–6.62 |
| Anaplasma sp. + F. tularensis | 1 | 1.06 | 0.06–6.62 |
| Bartonella sp. + Rickettsia sp. | 1 | 1.06 | 0.06–6.62 |
| Mixed infection with three pathogens | 1 | 1.06 | 0.06–6.62 |
| Apicomplexa + R. slovaca + R. conorii | 1 | 1.06 | 0,06–6.62 |
| Not detected | 41 | 43.62 | 33.54–54.22 |
- Abbreviations: CI, confidence interval; TBPs, tick-borne pathogens.
3.4. Influence of Biotic and Abiotic Ecological Determinants on Microbe–Microbe Interactions
3.4.1. Tick Sex as a Biotic Ecological Determinant of Microbe–Microbe Interactions
Network analysis of Hyalomma ticks revealed sex-specific pathogen interactions (Figure 2a,b). In females, negative associations between A. phagocytophilum, B. afzelii, and F. tularensis (Figure 2a) indicated competitive exclusion, where one pathogen’s presence inhibits others. In males, strong negative interactions were found between Anaplasma, Ehrlichia, N. mikurensis, and Rickettsia species (Figure 2b), suggesting competition for resources or immune evasion strategies.
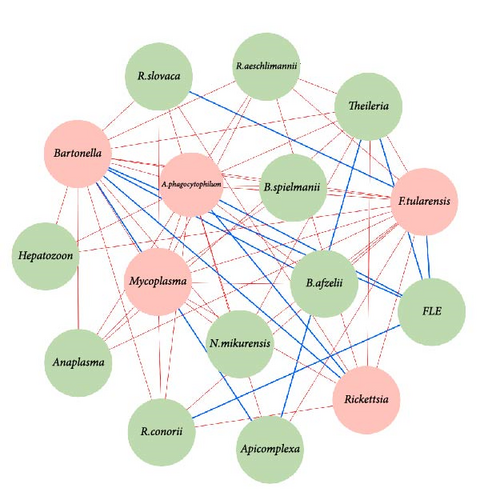
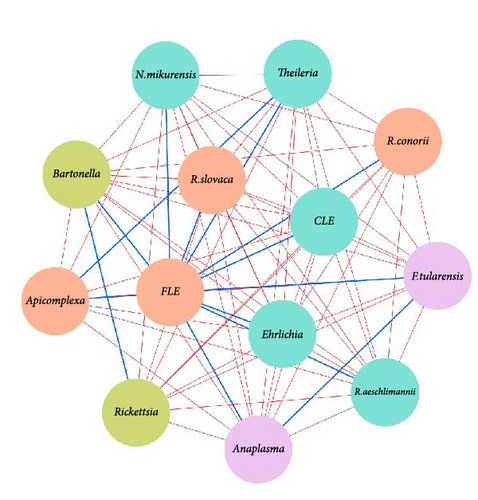
FLEs and CLEs played a central role in both sexes, showing positive associations with multiple pathogens, possibly facilitating their coexistence. Moderate positive associations, such as between R. conorii and R. slovaca in males and between B. afzelii and B. spielmanii in females, further suggest reduced competition in some coinfections.
3.4.2. Seasonal Changes as an Abiotic Ecological Determinants of the Pathogen–Pathogen Interaction
The co-occurrence networks reveal clear seasonal differences in pathogen interactions between female and male Hyalomma ticks (Figure 3a–h). In winter, female networks show balanced interactions between Rickettsia species and FLE (Figure 3a), while male networks exhibit more competitive dynamics, such as negative interactions between R. slovaca and Apicomplexa (Figure 3b).
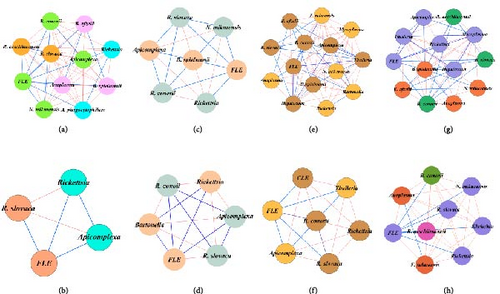
In spring, female networks are more complex, dominated by positive interactions suggesting cooperation (Figure 3c), while male networks are simpler and more competitive, with taxa like Bartonella absent from females but present in males (Figure 3d).
In summer, females show a more diverse and complex network, with largely positive interactions and the presence of F. tularensis (Figure 3e), while males display stronger negative interactions, particularly between Rickettsia and Theileria (Figure 3f).
Autumn networks reflect similar patterns, with females showing more balanced interactions (Figure 3g), while males demonstrate stronger competitive pressures, particularly between species like Anaplasma and R. conorii (Figure 3h).
In pathogen–pathogen co-occurrence network of the same guild, the nodes all maintained the same value of degree centrality, suggesting the same numbers of connections for each node within the network regardless of the differences in the nature and preference of interaction (Supporting Information 5: Table S4). On the other hand, the degree centrality values of the shared nodes varied between the TBPGs networks for the same node, demonstrating that tick sex and seasonal changes influence not only the nature of interaction but also the number of associations that a taxon can establish within one condition (Supporting Information 6: Table S5).
Overall, while both female and male networks display seasonal variations in species composition and interaction patterns, males tend to exhibit more pronounced competitive interactions, particularly in summer and autumn. Females show a similarly dynamic but slightly less competitive network structure, indicating subtle differences in ecological strategies and adaptations between the sexes throughout the year.
3.5. Genetic Diversity and Variation in Pathogen Guilds
Significant genetic diversity was observed among sequences within guilds composed of bacterial pathogens (16S rRNA), surpassing that found within guilds grouping eukaryotic microorganisms (18S rRNA; Figures 4 and 5). Rickettsia slovaca was the only pathogen identified in all TBPGs, while Ehrlichia sp. was only identified in M and MA guilds (Figure 4a). The rest of the bacterial pathogens were identified in both F and M guilds and in at least one corresponding to a seasonal change guild (Figure 4a). Protozoan pathogens presented lower genetic diversity, Apicomplexa (other) was identified in a greater number and variety of guilds followed by Hepatozoon sp., while Theileria sp. was only identified in F, FSU, and FA guilds (Figure 4b).
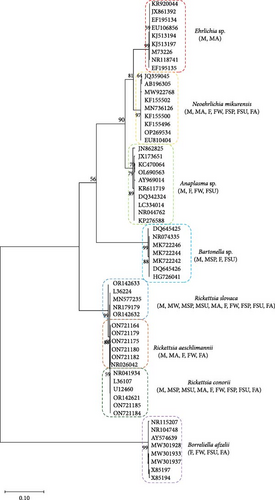
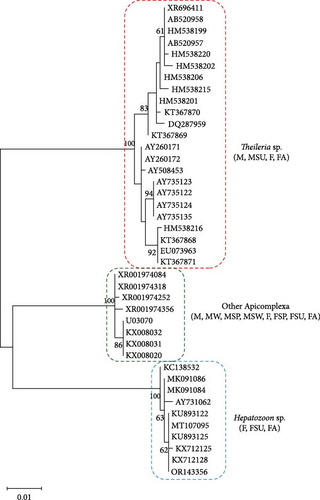
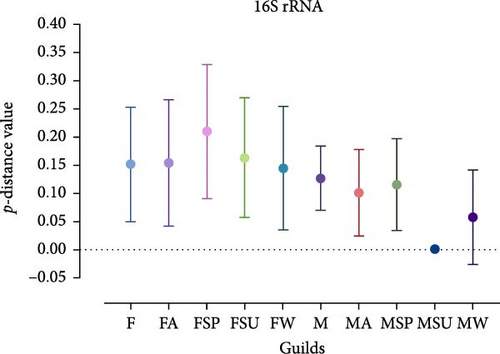
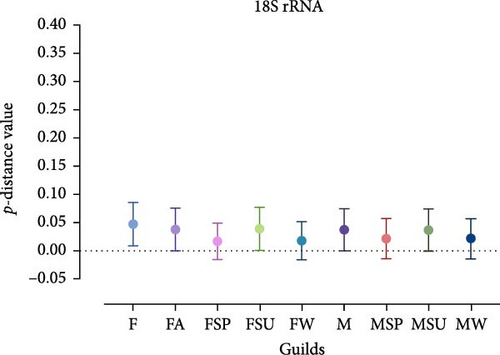
Analysis revealed that the majority of studied guilds, with the exception of MSP 16S rRNA, displayed statistically significant variations (p < 0.05) in genetic distances among their constituent sequences (Figure 5, Tables 3 and 4). This trend was consistently observed across comparisons between different guilds (Figures 4 and 5 and Tables 3 and 4).
| Guilds | Guilds and p values | ||||||||
|---|---|---|---|---|---|---|---|---|---|
| F | FA | FSP | FSU | FW | M | MA | MSP | MSU | |
| FA | 0.862 | — | — | — | — | — | — | — | — |
| FSP | <0.001 ∗ | <0.001 ∗ | — | — | — | — | — | — | — |
| FSU | 0.154 | 0.185 | <0.001 ∗ | — | — | — | — | — | — |
| FW | 0.131 | 0.124 | <0.001 ∗ | 0.004 ∗ | — | — | — | — | — |
| M | 0.009 ∗ | 0.007 ∗ | <0.001 ∗ | <0.001 ∗ | 0.525 | — | — | — | — |
| MA | 0.003 ∗ | <0.001 ∗ | <0.001 ∗ | <0.001 ∗ | 0.036 ∗ | 0.211 | — | — | — |
| MSP | 0.049 ∗ | 0.041 ∗ | <0.001 ∗ | 0.814 | 0.099 | <0.001 ∗ | 0.3811 | — | — |
| MSU | <0.001 ∗ | <0.001 ∗ | <0.001 ∗ | <0.001 ∗ | <0.001 ∗ | <0.001 ∗ | <0.001 ∗ | <0.001 ∗ | — |
| MW | 0.008 ∗ | 0.005 ∗ | <0.001 ∗ | 0.002 ∗ | 0.009 ∗ | 0.012 ∗ | 0.001 ∗ | 0.002 ∗ | 0.189 |
- Note: p-level of statistical significance.
- Abbreviations: F, females; FA, females collected in autumn; FSP, females collected in spring; FSU, females collected in summer; FW, females collected in winter; M, males; MA, males collected in autumn; MSP, males collected in spring; MSU, males collected in summer; MW, males collected in winter.
- ∗Statistically significant.
| Guilds | Guilds and p-Values | |||||||
|---|---|---|---|---|---|---|---|---|
| F | FA | FSP | FSU | FW | M | MSP | MSU | |
| FA | 0.006 ∗ | — | — | — | — | — | — | — |
| FSP | <0.001 ∗ | <0.001 ∗ | — | — | — | — | — | — |
| FSU | 0.010 ∗ | 0.753 | <0.001 ∗ | — | — | — | — | — |
| FW | <0.001 ∗ | <0.001 ∗ | 0.887 | <0.001 ∗ | — | — | — | — |
| M | 0.005 ∗ | 0.904 | <0.001 ∗ | 0.665 | <0.001 ∗ | — | — | — |
| MSP | <0.001 ∗ | <0.001 ∗ | 0.534 | <0.001 ∗ | 0.627 | <0.001 ∗ | — | — |
| MSU | 0.003 ∗ | 0.816 | <0.001 ∗ | 0.591 | <0.001 ∗ | 0.913 | <0.001 ∗ | — |
| MW | <0.001 ∗ | <0.001 ∗ | 0.5344 | <0.001 ∗ | 0.6275 | <0.001 ∗ | 0.999 | <0.001 ∗ |
- Note: p-level of statistical significance.
- Abbreviations: F, females; FA, females collected in autumn; FSP, females collected in spring; FSU, females collected in summer; FW, females collected in winter; M, males; MA, males collected in autumn; MSP, males collected in spring; MSU, males collected in summer; MW, males collected in winter.
- ∗Statistically significant.
3.6. Confirmation of Pathogen Presence Using Conventional PCR
Utilizing conventional PCR techniques, specific genetic targets were amplified to confirm the presence of selected pathogenic species. Amplification of the 18S rRNA gene generated fragments of 1258 and 1373 bp, indicating the presence of Babesia occultans (accession numbers: P809771 and PP809772) in two out of nine samples tested. For Rickettsia species, PCR assays targeting the gltA and ompB genes produced amplicons of 282, 380, 173, and 169 bp, respectively. These results confirmed two distinct Rickettsia sequences in 2 out of 15 samples tested (PP828624 (282 bp) and PP828625 (380 bp)). Further analysis specifically identified Rickettsia sibirica (PP828626 (173 bp)) and Rickettsia africae (PP828627 (169 bp)) in 2 out of 18 samples tested. Additionally, two samples tested positive for F. tularensis subsp. holarctica via PCR in two out of two samples tested. However, sequencing of these PCR products was not attempted. The utilization of species-specific primers in these PCR assays ensured accurate identification of the target pathogens, thereby, enhancing the reliability and robustness of the study’s findings.
4. Discussion
Traditional TBP detection methods in North Africa, like PCR and real-time PCR, are limited to identifying single pathogens [43]. Recent studies emphasize the importance of coinfections in pathogen transmission and disease severity [45–47]. This study utilizes microfluidic PCR and network analysis to examine interactions among 43 microorganisms in Hyalomma ticks infesting cattle in Algeria’s steppe region. This innovative approach reveals the prevalence and diversity of pathogens while highlighting the complex dynamics of coinfections, providing crucial insights into pathogen community structures and their influence on disease transmission in North Africa.
One of the key findings of this study is the significant difference in pathogen prevalence and coinfection patterns between male and female ticks. These variations are likely influenced by several factors. Female ticks, which typically have longer feeding periods and consume larger blood meals compared to males, face increased exposure to pathogens [48]. Krawczyk et al. [22] suggest that this extended feeding duration, coupled with physiological differences like hormonal variations, enhances females’ susceptibility to infections, such as B. burgdorferi and increases their likelihood of harboring multiple pathogens. Hormones like ecdysteroids and juvenile hormones, which vary between sexes, are believed to modulate immune responses and pathogen susceptibility in arthropods [48, 49]. Additionally, these physiological differences may alter the tick microbiome, potentially impacting pathogen colonization and persistence [50].
The presence of unique pathogens in female (e.g., B. afzelii, B. spielmanii, Hepatozoon, and Mycoplasma) and male (e.g., Ehrlichia) ticks suggests sex-specific ecological niches and behaviors that influence pathogen acquisition and transmission. These observations are consistent with findings from studies by Treuren et al. [51] and Benyedem et al. [52], which highlighted sex-specific differences in bacterial communities within ticks.
Ecological factors are crucial in the epidemiology of zoonotic diseases [53]. Climate change, marked by increased heat waves, heavy rains, and droughts, alters environmental conditions [54], affecting animal distribution and, in turn, the biology and redistribution of ticks [29]. As ticks expand, the pathogens they carry follow [2]. Tick life cycles, primarily driven by heat, rely on favorable conditions like humidity and host availability to support egg development and larval metamorphosis [55]. High temperatures can also accelerate pathogen replication, as seen with Theileria parva, which causes East Coast fever in cattle, while reducing transmission time in infected ticks [28]. In North Africa, Hyalomma excavatum is active year-round, with developmental rates peaking during warmer months [56]. This tick follows either a two- or three-host life cycle depending on host availability, adding complexity to its seasonal development [13]. Larvae and nymphs may feed on different hosts or the same one before molting into adults, creating a fluctuating landscape for pathogen transmission [36]. Seasonal peaks in tick activity often coincide with higher pathogen presence in large mammals, particularly in summer when adult ticks are most active [57].
Moreover, this study underscores the crucial role of FLEs in supporting pathogen coexistence in Hyalomma ticks, particularly with Rickettsia. FLE enhance the stability of tick microbial communities, promoting coinfections and pathogen persistence. This aligns with findings from Kumar et al. [58], who highlighted the competitive advantage of FLE over ancient endosymbionts in Amblyomma americanum, suggesting their ecological dominance. Azagi et al. [59] also found that imported Hyalomma ticks may exhibit different endosymbiont–pathogen relationships, indicating that geographical factors influence disease transmission dynamics. The evolutionary link between FLE and pathogens is further supported by Gerhart, Moses, and Raghavan [60], who showed that a FLE evolved from a mammalian pathogen, emphasizing its role in pathogen interactions. Additionally, Sesmero-García, Cabanero-Navalon, and Garcia-Bustos [61] discuss how climate change could enhance FLE’s role in disease transmission, as they may help Hyalomma ticks adapt to changing environments.
Hussain et al. [62] propose that targeting FLE could serve as an effective tick management strategy by disrupting their symbiotic relationships, thereby, reducing tick fitness and pathogen transmission. Developing anti-microbiota vaccines to target FLE presents a promising strategy to influence tick microbiota and reduce pathogen transmission. For example, vaccination of mice against a commensal Escherichia in Ixodes ricinus altered the tick microbiota [63], leading to decreased levels of B. afzelii [64]. Similarly, vaccination of alpha-gal knockout mice with the same commensal decreased tick survival [65]. Additionally, microbiota-driven vaccination in soft ticks, such as Ornithodoros moubata, has demonstrated implications for survival, fitness, and reproductive capabilities [66]. In another study, vaccination of birds against a commensal in Culex quinquefasciatus effectively reduced Plasmodium colonization in the mosquito [67]. These results support the concept that vector microbiota manipulation by host antibodies can be utilized as a strategy to develop transmission-blocking vaccines [68].
The observed coinfections reveal important insights into disease dynamics, particularly the positive associations between pathogens like Rickettsia conorii and R. slovaca in male ticks and B. afzelii and Borrelia spielmanii in female ticks, indicating a lack of competition. Moutailler et al. [47] found a strong association between Borrelia garinii and B. afzelii, suggesting that biological interactions may promote their coinfection. Similarly, R. conorii and R. slovaca have been found to coexist without competition, as noted by Torina et al. [69]. These interactions may contribute to more complex infection patterns, influencing the epidemiology of tick-borne diseases.
Pathogens can cooperate by producing shared resources, or “common goods,” essential for their collective growth and survival. In bacterial communities, for instance, siderophores are produced to capture iron from the environment, a critical element for bacterial growth. These siderophores benefit multiple strains within the population, enhancing the overall fitness and survival of the community [70, 71]. Additionally, such cooperative behaviors are often regulated by quorum sensing, where bacteria use chemical signals to coordinate the production of these shared resources, further demonstrating the intricate cooperation among pathogens [72].
In contrast, strong negative associations between pathogens like Anaplasma phagocytophilum and F. tularensis suggest mutual exclusion. Competition among parasites within a host can lead to varied evolutionary outcomes, driven by different mechanisms [34]. Exploitation competition occurs when parasites compete for the host’s limited resources by occupying overlapping ecological niches, intensifying during coinfections [73, 74]. Apparent competition, on the other hand, arises from cross-reactive immune responses, where the host’s nonspecific defenses affect the abundance and success of different parasites [75, 76]. Last, interference competition involves direct suppression, where parasites actively inhibit their rivals through chemical or mechanical means [16, 77]. These competitive interactions may limit the co-occurrence of certain pathogens, impacting disease prevalence and influencing control strategies.
Interactions between pathogens in multi-infections significantly influence the evolution of virulence. Pathogens may compete for resources or cooperate to enhance survival and share resources. The observed sex-specific and seasonal variations in these interactions provide important insights into tick-borne disease dynamics. These findings highlight the need to consider both biotic and abiotic factors when developing control strategies. By combining molecular techniques with ecological and epidemiological approaches, this study enhances the understanding of TBPs and improves predictions and management strategies for their spread, leading to more effective public health interventions. While the study provides valuable insights, its findings may be constrained by the limited sample size, focus on specific tick species, and potential geographical biases. These limitations should be considered when interpreting the results and applying them to broader ecological or epidemiological contexts.
5. Conclusion
This study provides valuable insights into the complex interactions between TBPs within Hyalomma excavatum tick populations. The significant differences in pathogen prevalence and interactions between male and female ticks, along with seasonal variations, underscore the multifaceted nature of tick-borne disease ecology. These findings emphasize the need for sex-specific and seasonally tailored approaches in disease surveillance and control.
Future research should prioritize the development of targeted disease control strategies that consider seasonal and sex-based differences in tick behavior and pathogen interactions, allowing for more tailored and effective management practices. Integrating molecular diagnostics with ecological and network analyses will further advance our understanding of pathogen dynamics and support the design of innovative control strategies. One promising approach is the development of anti-microbiota vaccines, which aim to disrupt key microbial communities within ticks. By destabilizing tick microbiomes, these vaccines could reduce pathogen transmission and serve as a valuable complement to existing control measures. Emphasizing these research directions will strengthen our capacity to address the complexities of tick-borne diseases across varied ecological settings.
Ethics Statement
All procedures performed in this study are in accordance with the ethical standards of the institutional and/or national research committee. We further declare that no animal was harmed during this study.
Consent
The authors have nothing to report.
Conflicts of Interest
The authors declare no conflicts of interest.
Author Contributions
Alejandro Cabezas-Cruz, Salma Kaoutar Abdelali, and Lynda Aissaoui: conceptualization. Salma Kaoutar Abdelali, Lourdes Mateos-Hernández, Angélique Foucault-Simonin, and Clemence Galon: investigation. Salma Kaoutar Abdelali, Apolline Maitre, Elianne Piloto-Sardiñas, and Zbigniew Zając: formal analysis. Lourdes Mateos-Hernández and Angélique Foucault-Simonin: data Curation. Apolline Maitre, Constance Julie, Sara Moutailler, and Dasiel Obregon: methodology. Salma Kaoutar Abdelali and Zbigniew Zając: visualization. Alejandro Cabezas-Cruz: supervision. Sara Moutailler and Alejandro Cabezas-Cruz: resources. Salma Kaoutar Abdelali, Elianne Piloto-Sardiñas, and Alejandro Cabezas-Cruz: writing–original draft. All authors contributed to writing–review and editing.
Funding
No specific funding was acquired for this research.
Acknowledgments
The authors have nothing to report.
Supporting Information
Additional supporting information can be found online in the Supporting Information section.
Open Research
Data Availability Statement
The data that supports the findings of this study are available in the Supporting Information of this article.


