Rapid Risk Assessment Framework to Estimate Potential for Spillback at Human–Wildlife Interfaces
Abstract
More than 60% of emerging infectious diseases of humans have a wildlife origin, and when these diseases spread through human populations to new geographical areas, there is a considerable risk of spillback from humans to wildlife species. Spillback events can have severe consequences for wildlife populations, where the disease may cause morbidity and mortality, and human populations, where the establishment in wildlife may lead to prolonged transmission or new exposures in humans. Mitigating these consequences requires identifying the key risk factors that lead to human–wildlife transmission events and implementing risk-reducing actions, a challenge given that cross-species transmission events are rare and often data deficient. To identify potential species and locations that are most likely to lead to these rare events, we developed a spatially explicit, rapid risk assessment framework that incorporates three components of the spillback process: wildlife susceptibility, wildlife exposure, and pathogen introduction pressure. To demonstrate the broad applicability of our framework, we conducted a rapid risk assessment on two recent emerging zoonotic pathogens in humans, severe acute respiratory syndrome coronavirus 2 (SARS-CoV-2) and mpox, to determine the relative spillback risk to wild mammalian species in the continental United States. The rapid risk assessment identified both species and locations with higher than expected spillback risk, providing managers and researchers with valuable information to prioritize surveillance and risk-mitigation actions. Our framework represents a rapid and flexible approach to assess the risks of spillback to wildlife populations during rapidly evolving zoonotic disease outbreaks.
1. Introduction
The global transmission of emerging zoonotic diseases in humans has led to concerns regarding the spread of these diseases from humans into novel wildlife populations, a disease transmission process known as spillback [1–3]. Spillback events that lead to disease establishment in novel reservoir hosts add complexity for control efforts and increases the likelihood of pathogens infecting susceptible human populations (a process called spillover; [4, 5]). Furthermore, infections in wildlife can lead to possible viral recombination events [6, 7] and pathological outcomes for wildlife, resulting in conservation concerns. For example, spillback dynamics have been identified as playing a major epidemiological role in the spread and maintenance of bovine tuberculosis around the world [8]. With spillback events from the native cervid population back to cattle being the main pathway of bovine tuberculosis infection in North America [9, 10]. A major barrier to our understanding of these processes is capturing data on spillback transmission events, which may be rare in nature and occur in wildlife populations with little or no systematic monitoring [11]. This paucity of information restricts our ability to make empirically based inferences regarding the drivers of human–wildlife disease transmission and implement mitigations to reduce the spillback risk [12].
A major obstacle in obtaining the necessary data to improve our understanding of the dynamics of spillback events is that these events are rare and short-lived [13–15]. Resulting in a limited window to collect and analyze data and respond at the wildlife–human interface. In addition, the timing of these transmission windows often overlaps with major public health emergencies that demand substantial economic and public-health resources [16, 17]. During these windows, developing and implementing targeted wildlife sampling efforts to capture potential spillback events are often deprioritized [18], thereby missing the opportunity to acquire data needed to gain insight into the spillback process. As such, prioritizing sampling efforts by restricting either the targeted species or geographic range based on knowledge of one or more components of the spillback process could greatly improve the chances of detecting these adverse events [19, 20]. To effectively sample wildlife populations and improve our understanding of the spillback process during these brief transmission windows, it is critical to have a flexible and simple framework that can rapidly produce guidelines to help focus sampling efforts on species and geographic locations that have a relatively higher risk of spillback events occurring.
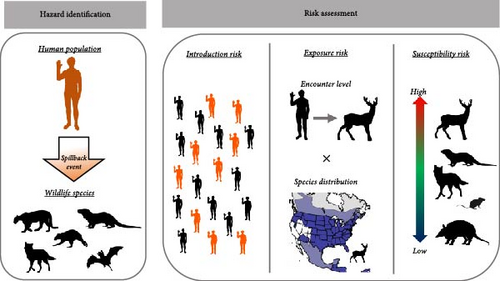
To rapidly assess the risks of spillback, we used a simplified conceptual risk model that can be applied broadly to outbreaks that are data sparse and/or have high uncertainty. While our understanding of the specific mechanistic processes and core variables driving these dynamics is limited, previous research on spillover events has identified three core phases that determine the likelihood of cross-species transmission [14]. The first phase is the introduction risk, the amount of a pathogen in the environment [21]. The second phase, exposure risk, is driven by wildlife distributions and behavior traits shaping wildlife exposure to the pathogen [22, 23]. The final phase, host susceptibility, is the likelihood that a given wildlife species becomes infected given exposure, which is primarily driven by genetic and immunological factors [24]. By breaking the spillback processes into three discrete phases, we can begin to identify and group established risk factors to develop a broad and informative framework for evaluating initial spillback risk (Figure 1). By combining these three components we developed a rapid risk assessment framework that can identify species and locations with an elevated relative risk of the occurrence of spillback events. We performed a rapid risk assessment of spillback risk across wildlife species and geographic locations for two global pandemic-causing viruses, the severe acute respiratory syndrome coronavirus 2 (SARS-CoV-2) and mpox (Orothopox genus), to demonstrate the usefulness and flexibility of this framework.
SARS-CoV-2 is a zoonotic pathogen that causes COVID-19 in people. Since late 2019, this virus has infected more than 660 million people and caused more than 6.5 million deaths worldwide [25, 26]. SARS-CoV-2 is primarily transmitted from human to human through contact and inhalation of infectious aerosolized particles emitted from infected individuals or through contact with infected environmental particles [27]. While specific transmission routes associated with human-to-wildlife transmission have not been fully elucidated, there have been several confirmed spillback events associated with animal species with close contact with humans. This includes wild cervid populations [23], big cat species in zoos [28], domestic and free-ranging mink [29, 30], and companion animals [31].
The Mpox virus is considered the most concerning orthopoxvirus for humans since the eradication of smallpox [32]. Mpox was initially described in 1958, and since then, there have been numerous pandemics of various magnitudes [33]. The most recent global pandemic of mpox started in early 2022, with the first confirmed case in the United States in May of that year [34]. Between May and October 2022, all states within the United States reported mpox infections, with peak infections in the United States occurring in early August. During this period there were over 30,000 confirmed cases in the United States [35]. While the location and source of initial spillover events to humans have not been identified, there is a large diversity of rodent species that serve as potential reservoir hosts for mpox [36, 37].
Both of these viruses are zoonotic, with a broad pool of suspected and potential wildlife reservoirs [38–40], increasing the potential for spillback events. Our rapid risk assessment, which incorporates currently available knowledge about introduction risk, exposure risk, and host susceptibility, provides an initial assessment of high-risk species and locations for these two pathogens to help develop targeted sampling efforts. Our model framework results in actionable information for designing surveillance systems and targeted wildlife sampling; furthermore, it is highly flexible, allowing for the inclusion of updated information to improve future risk assessment results.
2. Methods
2.1. Risk Assessment Framework
2.2. Introduction Risk
Introduction risk is a proxy of infectious agent pressure at a geographic location. How introduction risk is defined should be pathogen-specific and may be limited based on data availability or quality but should represent the infection agent pressure originating from the source species (humans for a spillback hazard or wildlife for a spillover hazard). In our SARS-CoV-2 model, this is the product of the county’s human population and SARS-CoV-2 infection rate. SARS-CoV-2 infection rates were monitored at many levels, but we used county-level estimates as they were the smallest spatial scale that was widespread and readily accessible. County-level populations were obtained using the 2020 census data [42]. For SARS-CoV-2 infection levels, we fit a Bayesian generalized additive model (GAM) using the Rstanarm package [43] to weekly infection rate data (per 100 k) spanning from March 3, 2022 to August 4, 2022 [26]. We then quantified the area under the curve of the best-fitted trend line to represent the cumulative infection levels across time for a given county; we then multiplied this value by the county’s population size to get the spatially explicit risk of introduction over this same period.
For mpox, we estimated introduction risk as the product of the per-person infection level at the state level and the county’s total population. Currently, we only have access to cumulative state case counts of the mpox clade II subtype up until January 10, 2024, which prevents us from using a similar approach used to quantify introduction risk for SARS-CoV-2.
2.3. Exposure Risk
Species occurrence was defined at the county level and was treated as a binary variable with a value of 1 indicating species presence in a county and 0 if absent. We obtained county-level mammal species occurrence data using published range maps obtained from the International Union for Conservation of Nature (IUCN) database [45]. We overlayed the species range maps with county-delimited maps and determined occurrence based on if the county area intersected with the species range using the SF package [46]. As we currently lack knowledge of the infection pathways for SARS-CoV-2 and mpox, we treated exposure to risk as the same for both pathogens.
2.4. Host Susceptibility
Host susceptibility captures the likelihood of a wildlife species becoming infected given an exposure to the pathogen. To quantify species-specific host susceptibility to SARS-CoV-2, we compiled 11 studies that either estimated theoretical susceptibility based on species variation across the structure of their angiotensin-converting enzyme 2 (ACE2) or used machine learning approaches to estimate species level susceptibility. By including papers that use machine learning techniques, we are able to expand the coverage of estimated mammal susceptibility to over 5000 species [24]. The ACE2 enzyme is the primary binding agent for the SARS-CoV-2 spike protein [47, 48], and variation in the structure is thought to convey variation in susceptibility to infection [3]. We compiled the studies by searching Google Scholar and Web of Science using the following keywords: “SARS-CoV-2,” “wildlife,” “susceptibility,” and “ACE2.” We restricted our search to papers that were made available (either published or as a preprint) by December 2021. For each of the 11 studies, we grouped each species into one of three susceptibility groups (high, medium, or low susceptibility) based on the authors’ interpretation and classification of susceptibility. We then aggregated across all studies to estimate a species-specific susceptibility grouping (high, medium, or low) based on how the majority of studies identified susceptibility risk. If, for a given species, there was a lack of a majority agreement across studies, we assigned it to the “medium” group. Any wildlife taxa that did not have an associated susceptibility score were removed from the SARS-CoV-2 risk assessment model.
The current knowledge of wildlife susceptibility to mpox infection is largely unknown, especially for native species in the United States [49–51]. Furthermore, there exist very few experimental infection studies, and no study that we are aware of that uses species variation in cellular structure (e.g., ACE2 studies for SARS-CoV-2) to estimate species susceptibility. To work with this large uncertainty, we assigned only two values for our species’ susceptibility to mpox ranking, high susceptibility, which was assigned to any taxa that are considered to be susceptible to mpox based on published work, and low susceptibility was assigned to all other taxa. Using only two rankings allowed us to elevate taxa with known susceptibility while not having to distinguish taxa with little to no data between medium and low susceptibility levels.
To quantify the categorization of host susceptibility in our risk assessment, we assigned a value of 1.00 to species in the “high” category, 0.50 for the “medium” and 0.25 for species in the “low” category. We used this range value to conservatively capture the differences in theoretical susceptibility while not treating the categorization as established knowledge (i.e., assuming that low susceptible species are incapable of becoming infected).
2.5. Sensitivity Analysis
To determine how each of the core variables (species susceptibility, exposure, and introduction) impacted the species and county-level spillback risk rank, we re-calculated the risk assessment scores for both SARS-CoV-2 and mpox while varying the weight of these distinct variables and ranked species and counties. We used a Latin hypercube sampling (LHS) approach to explore how varying the weight of each of the different components over a uniform distribution between 0 and 2 shifted the relative species and county ranks. We used the LHS package [52] in the R statistical language [53] to divide the parameter spaces into 1000 equal-probability intervals, randomly select a weight value in each interval, and created 1000 parameter sets by combining the weight values of each parameter. We assessed sensitivity by comparing the rank-order of risk scores between counties and species to the rank-order with all weights equal to 1 by calculating a Pearson’s correlation coefficient. We analyzed the relative contribution of the different spillback components to variance in species and county rankings by estimating the partial rank correlation coefficients for each spillback component.
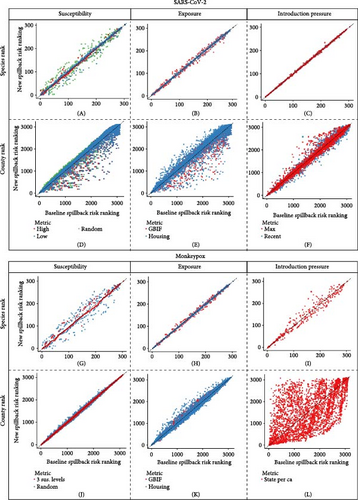
To assess how sensitive our results are to how we define our variables for the SARS-CoV-2 and mpox risk assessment, we reran our assessments using variations in how we define the metrics for each core component. For each alternative metric, we kept the other two components consistent with how we initially defined them (Table 1). After running the risk assessment with the alternative metric, we compared the new ordinal rankings of species and county spillback risk with the newly estimated rankings. By focusing on rank instead of risk value, we compared output across the different risk assessments. We assessed the sensitivity of our parameter definitions by visually comparing the deviations in rank from our baseline component definitions. In our qualitative assessment, large deviations in rank from the alternative models compared to the baseline would be indicative that the component is highly sensitive to how we defined it; small deviations in rank from the alternative models compared to the baseline suggest that the component is less sensitive to our definition.
| Pathogen | Component | Base metric | Base metric description | Alternative metric | Metric description |
|---|---|---|---|---|---|
| SARS-CoV-2 | Susceptibility | Majority ranking | Each host susceptibility ranking was assigned based on its majority susceptibility ranking across all reviewed studies | High ranking | Each host susceptibility ranking was based on the highest qualitative susceptibility ranking in the studies we reviewed |
| Low ranking | Each host susceptibility ranking was based on the lowest qualitative susceptibility ranking in the studies we reviewed | ||||
| Random | Each host susceptibility ranking was assigned randomly | ||||
| Exposure | IUCN records | Species distribution was weighed based on estimated range from IUCN | GBIF | Species distribution was weighted based on county-level Global Biodiversity Information Facility (GBIF) records | |
| WUI-population | Spatial value of intermingling of human population and undeveloped wildland vegetation | Housing | The wildlife urban interface was quantified based on housing instead of the human population | ||
| Introduction | AUC | Introduction pressure quantified as the area under the curve of the temporal trend of infection rate between March 3, 2022 and August 4, 2022 | Max | The introduction pressure was quantified using the maximum infection rate between March 3, 2022 and August 4, 2022 | |
| Recent | The introduction pressure was quantified using solely the most recent infection rate data, August 4, 2022 | ||||
| MPOX | Susceptibility | Binomial susceptibility levels | Host susceptibility was assigned based on whether the taxa was known to be susceptible | Three susceptibility levels | Host susceptibility was assigned based on three criteria. High susceptibility was assigned if a taxon was confirmed to be susceptible based on experimental or field-based studies. Medium susceptibility was assigned if a taxon was theoretically susceptible but never confirmed, and low was assigned if taxa were considered not susceptible or not considered at all |
| Random | Each host susceptibility ranking was assigned randomly | ||||
| Exposure | IUCN records | Species distribution was weighed based on estimated range from IUCN | GBIF | Species distribution was weighted based on county-level Global Biodiversity Information Facility (GBIF) records | |
| WUI-population | Spatial value of intermingling of human population and undeveloped wildland vegetation | Housing | The wildlife urban interface was quantified based on housing instead of the human population | ||
| Introduction | County population weighed state infection rate | Introduction pressure quantified as the product of the per-person infection level at the state level and the county’s total population | State per capita | Introduction pressure was quantified based on state per capita infection level, all counties in a given state have the same values | |
- Note: In this table, we define the alternative metrics for each pathogen and spillback process component (susceptibility, exposure, and introduction) combination. Spillback is the spread of infectious diseases from humans into wildlife populations.
- Abbreviation: IUCN, International Union for Conservation of Nature database.
3. Results
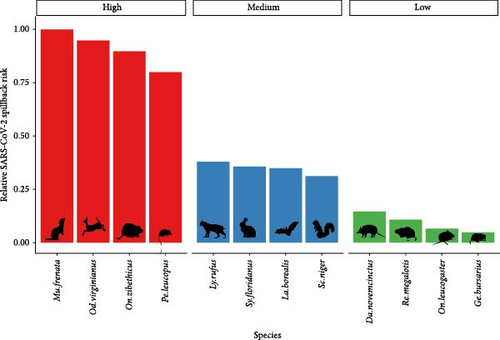
We quantified the relative spillback risk of 291 mammal species across the contiguous 48 states for two pandemic-causing viruses, SARS-CoV-2 and mpox. By aggregating risk to the species and county level we can identify both locations (Figure 2) and species (Figure 3) of high risk of spillback events. For spatial variation in SARS-CoV-2 spillback risk, we observed that counties located in the southwestern United States had the highest total risk score, with nine out of the top 10 counties being in either California (6/10), Arizona (2/10), or Nevada (1/10) (Figure 2A). Across the Continental United States, we observed several highly ranked relative risk areas situated in areas surrounding high-population urban cities, such as Miami-Dade, FL; Houston, TX; Boston, MA; and Chicago, IL. Across species, we identified the long-tailed weasels (Mustela frenata) as having the highest aggregated risk, followed by white-tailed deer (Odocoileus virginianus), muskrats (Ondatra zibethicus), and white-footed mice (Peromyscus leucopus) and woodland vole (Microtus pinetorum). Species within the 75th SARS-CoV-2 spillback risk quantile are largely dominated by the orders Carnivora and Rodentia, which make up 50% (8/16) and 44% (7/16) of the species, respectively.
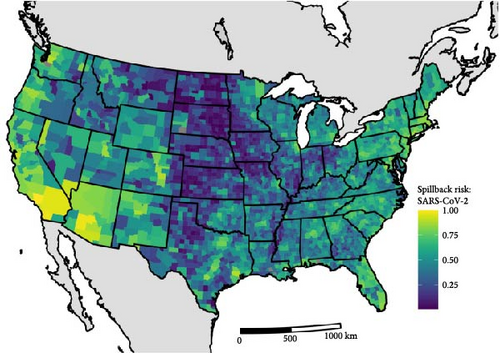
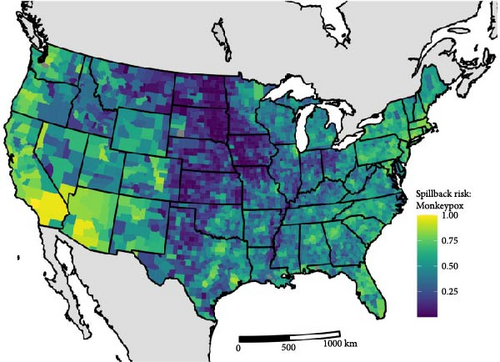
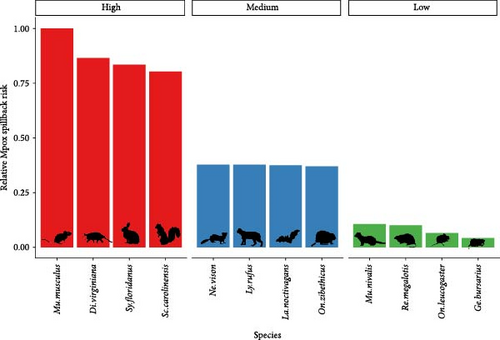
For mpox, we estimated similar patterns to SARS-CoV-2 in the spatial variation of spillback risk, with the highest total risk scores occurring in the southwestern United States and areas with high human density in the northeast and south Florida (Figure 2B). For species, we identified the common house mouse (Mus musculus), the Virginia opossum (Didelphis virginiana), the eastern cottontail (Sylvilagus floridanus), and the eastern gray squirrel (Sciurus carolinensis) as species most likely to facilitates spillback events. Species within the 75th mpox spillback risk are largely dominated by the orders Rodentia and Carnivora, making up 66% and 17% of the species, respectively.
3.1. Sensitivity Analysis
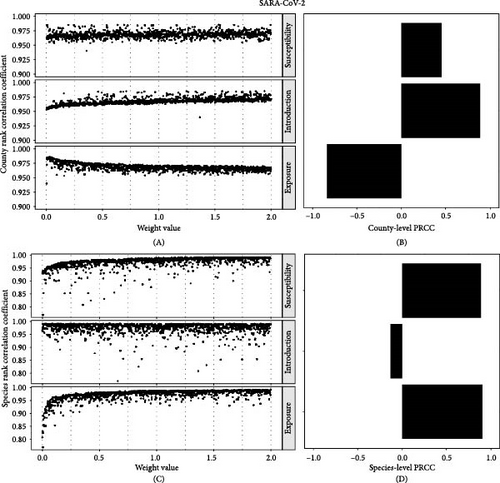
We explored two distinct aspects of sensitivity in our risk assessment, across and within the component. For the across-component analysis of SARS-CoV-2, the ranking of county risk scores was overall insensitive to weight parameters with mean Pearson’s rank correlation coefficient 0.968 (range: 0.954–0.985) compared to all parameter weights equal to 1 (Figure 4A). The weight on susceptibility and introduction resulted in positive sensitivity to overall risk; that is, lower weights resulted in more variation in the rank order of county risk, and higher weights resulted in a very similar rank order compared to assigning weights of 1 to all risk components (Figure 4B). Varying weights on exposure risk resulted in negative sensitivity, indicating that lower weights on exposure risk generated more similar county rank-order. There was also a high mean of Pearson’s rank correlation coefficient for species SARS-CoV-2 risk (mean = 0.97; range: 0.81–0.99) (Figure 4C). The weight assigned to susceptibility and exposure risk generated positive sensitivity to overall risk, and the introduction risk weight generated a small negative sensitivity for the overall species risk rank-order (Figure 4 D).
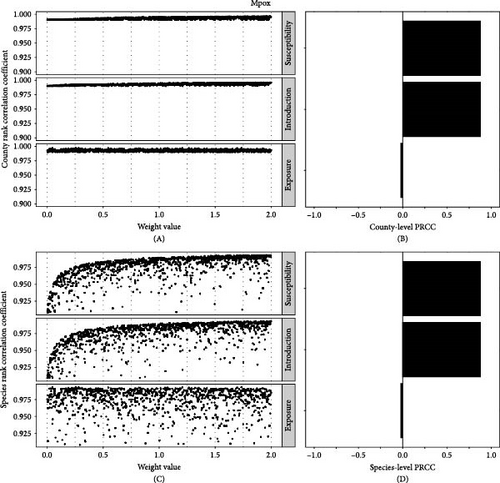
The ranking of county risk scores for mpox was relatively insensitive to weight parameters with mean Pearson’s rank correlation coefficient 0.99 (range: 0.991–0.997) compared to all parameter weights equal to 1 (Figure 5A,B). There was also a high mean of Pearson’s rank correlation coefficient for species (mean = 0.97; range: 0.90–0.99) (Figure 5C). The weight on susceptibility and introduction risk generated positive sensitivity to the rank-order of county and species overall risk, while the exposure weight had no impact (Figure 5D).
For SARS-CoV-2 at the species rank level, we saw the most variation in rank and, thus, sensitivity in the species susceptibility component relative to the other two components (Figure 6A–C). At the county level, we observed large sensitivity across all three components, with the highest level of sensitivity occurring in the exposure and susceptibility components (Figure 6D–F). For mpox at the species rank level, we observed a large variation in relative rank at both the species susceptibility and introduction risk components with minimal variation at the exposure component (Figure 6G–I). At the county level, we observed a large variation at the introduction component level with a moderate level of variation at the exposure level (Figure 6J–L).
4. Discussion
By developing a simple, informative risk assessment framework for estimating spillback potential, we provide a valuable tool for improving our ability to detect, understand, and respond to pathogen spillback. The current framework of our risk assessment uses readily available information related to introduction risk, exposure risk, and host susceptibility to derive estimates of relative spillback risk. This results in a rapid and highly flexible risk assessment model. As demonstrated, this model can be used to develop prioritization-based surveillance strategies and reduce the current data limitation gaps, both of which improve our understanding into the processes shaping spillback events.
In our SARS-CoV-2 risk assessment, we identified relative spillback risks across various species and spatial locations, which land use managers can use to inform actions aimed at mitigating these risks. The wildlife species with the highest risk scores exhibited a combination of medium-to-high susceptibility and extensive geographical ranges overlapping with human-populated areas. Notably, some of our top species, such as white-tailed deer, raccoons, American opossums, and white-footed mice, have strong associations with human-modified landscapes [54]. However, the current risk assessment framework does not incorporate species-level data on potential human interactions. Future iterations of this framework could benefit from including this data, which would likely elevate the risk scores for these taxa and others closely associated with humans. Additionally, several high-risk taxa, including white-tailed deer and white-footed mice [55], have already been suspected or confirmed to be infected with SARS-CoV-2 due to spillback events. While the specific exposure pathway for these specific spillback events remains unknown, the most likely pathway is thought to be through direct contact with infected humans from cohousing (white-footed mice) or from farming/hunting (white-tailed deer). Spatially, we observed higher spillback risks in areas characterized by larger population sizes—often correlated with elevated infection levels—and significant wildlife–urban interfaces, particularly in the Southwestern and Northeastern regions of the United States. These findings align with our conservative approach to estimating spillover pathways, as we would expect heightened spillback risks in areas with large populations and moderate-to-high interaction potential. A better understanding of the likely spillback transmission pathways for SARS-CoV-2 (e.g., rehabilitation centers, feeders, outdoor recreation) could yield a more nuanced spatial distribution of spillback risk. Achieving this would require increasing complexity in both the introduction pressure and encounter risk components of our risk assessment model.
Our mpox spillback risk assessment has produced an initial quantification of species-specific and location-specific risks that can help guide surveillance efforts to improve our understanding of potential mpox reservoir hosts within the United States. Currently, our knowledge of likely spillback hosts for mpox in the United States is limited, representing a significant gap in our ability to monitor and predict potential outbreaks [56]. The species identified by our model as having the highest spillback risk include taxa previously recognized as susceptible to mpox and strongly associated with urban environments, such as house mice, gray squirrels, and American opossums. Although there have been no confirmed detections of mpox infecting these taxa, their combination of susceptibility and potential exposure through interactions with infected humans in urban areas makes them high priorities for mpox monitoring in wildlife populations. Similar to our SARS-CoV-2 risk assessment, we observe the highest spillback risks in areas with large populations and elevated infection levels, particularly in the Southwestern and Northeastern regions. The consistent spatial patterns observed between the two pathogens are likely driven by our conservative approach in defining introduction pressure and exposure risk in our model. Incorporating additional pathogen-specific exposure routes could lead to more varied spatial patterns of spillback risk between the two pathogens.
A core strength in our risk assessment framework is its reliance on clear and simple components, efficiently obtained from open-source public health and land use databases. Defining model components is integral to the usefulness of the model; thus, it is critical to assess how we defined the different components that contribute to the overall base risk. For both SARS-CoV-2 and mpox, species-level spillback risk scores are highly sensitive to our definitions of the susceptibility component. Currently, our susceptibility estimates are defined using either theoretical susceptibility based on the ACE2 enzyme [24] or a combination of limited experimental and field-based work [50, 57], resulting in large uncertainty in these susceptibility scores [50, 58]. This, coupled with the large influence susceptibility has in determining species risk levels, highlights the need to develop broader experimental and validated metrics for species susceptibility. These “real time,” data driven, descriptions of species susceptibility, especially in the case of SARS-CoV-2, provide a foundation for the model and can be updated as additional information is obtained. Improved susceptibility data, as available, would allow us to estimate “actualized” susceptibility in our models, improving our estimates of wildlife susceptibility and reducing uncertainty.
Similarly, there are limitations in the data related to obtaining and extrapolating the spatial extent of the pathogen of interest. For SARS-CoV-2, we selected county-level risk and saw high sensitivity based on how we defined the components of exposure and introduction pressure. Developing more process-based metrics for these two components will enable researchers and managers to test the drivers of spatial variation in spillback risk. The exposure component of the model can also be expanded to include details about specific human–wildlife interfaces with high transmission potential. Such a model could include parameters such as species and county-level hunting pressure [59], location and number of wildlife species in wildlife rehabilitation centers [60], or current monitoring efforts (i.e., for conservation or management goals; [61]). Integrating user-based reporting of animal encounters or sightings, such as iNaturalist, may improve estimates of human–wildlife encounter intensity [62, 63]. Including additional information on the pathogen, such as strain type or alternative transmission pathways, and incorporating that into the introduction component (i.e., transmission through wastewater [64]) could improve estimates of introduction risk. A core challenge in implementing these additional parameters is identifying and integrating data into a national data model while maintaining appropriate spatial resolution [65, 66]. Understanding how to best integrate the risk assessment framework with new data types will be crucial as we build in complexity during future iterations.
Currently, our framework estimates the relative risk of a spillback event occurring and does not account for the likelihood that the spillback event will lead to an established infection in the population; however, our framework allows for the modification and or inclusion of other hazards or processes that might be of interest or concern to researchers and managers. One of the core concerns in the spillback process is the potential development of a novel reservoir host [67, 11]. For a spillback event to result in the establishment of a reservoir host, there needs to be persistent transmission and infection within the wild species population, as recently observed with SARS-CoV-2 and white-tailed deer [68, 69]. To better evaluate reservoir host risk in our framework, we can include additional components that capture reservoir host establishment risk, such as relevant species-level traits, including the number of virus species known to infect a species [21] and the phylogenetic distance from an established reservoir taxon of the given pathogen [58]. Including this information into the existing framework may produce risk scores that can identify reservoir host establishment risk and enable managers to take additional precautionary measures when handling or interacting with these sensitive taxa. However, integrating these additional data streams carries its own obstacles, such as variation in data coverage and uncertainty in how to best define reservoir host risk [58]. Further hazards that could be incorporated in different risk assessment iterations include but are not limited to, virus recombination risk [62], wildlife health or conservation consequences [70], and spillback into susceptible human populations [11].
Our risk assessment is an example of an initial assessment of spillback risk for two pathogens, from which surveillance and management efforts, as well as data deficiencies, can be prioritized. Data on spillback events, by their very nature of being rare and potentially impactful, are the primary limiting factor in the mechanistic understanding of zoonotic pathogen spread, and having an evidence-based sampling guide can be used to guide the sampling needed to reduce the data deficiency gap. With improved data and records of spillback events, we can continue to assess factors that contribute to these events, including transmission pathways, host, and pathogen ecology. For example, are spillback events largely constrained to animals that are considered peridomestic? Or does exposure occur more indirectly with interactions between viral fomites and wildlife? Addressing these questions requires targeted effort and resources including needing to sample high-risk taxa at the appropriate spatial area and the ability to adjust model inputs and evaluate outputs in real-time. Responding to zoonotic pathogens with epidemic potential is challenging; however, this rapid risk assessment model provides a framework from which researchers and managers can efficiently adapt surveillance efforts, mitigation priorities, and management actions.
Disclosure
Any use of trade, firm, or product names is for descriptive purposes only and does not imply endorsement by the U.S. Government.
Conflicts of Interest
The authors declare no conflicts of interest.
Author Contributions
Conceptualization: Travis McDevitt-Galles, Tricia L. Fry, Katherine L. D. Richgels, and Daniel A. Grear. Formal analysis: Travis McDevitt-Galles and Daniel A. Grear. Data curation: Travis McDevitt-Galles. Writing – original draft: Travis McDevitt-Galles and Daniel A. Grear. Writing – review and editing: Travis McDevitt-Galles, Tricia L. Fry, Katherine L. D. Richgels, and Daniel A. Grear. Project administration: Tricia L. Fry and Katherine L. D. Richgels.
Funding
This research was funded by the U.S. Geological Survey (USGS) Ecosystems Mission Area and the Center for Disease Control (CDC) National Center for Emerging and Zoonotic Infectious Diseases.
Acknowledgments
We thank Maggie Twarowski for her efforts in curating the wildlife susceptibility data. We thank Jon Cook for his insight and feedback during the early stages of our risk assessment model, as well as for providing a review of our manuscript. We also thank David Blehert, Hon Ip, Jonathan Sleeman, Ria Ghai, Nadia Oussayef, Casey Barton Behravesh, and Kate Varela for their feedback on the risk assessment model.
Open Research
Data Availability Statement
The data generated in this study are available in a U.S. Geological Survey data release [71].


