Formulation of Nutrient-Enriched Wheat-Based Cookies Using Defatted Soybean Flour and Moringa stenopetala Leaf Powder
Abstract
Cookies, despite their popularity among both children and adults and being regarded as one of the most functional baked products, often have lower nutritional value due to their primary ingredient, wheat. Therefore, this research aimed to improve the nutritional value of wheat-based cookies using Moringa (Moringa stenopetala) leaf powder (MLP) and defatted soybean flour (DSF) and optimize the blending ratio, baking time, and temperature. From preliminary tests, the blending ratios were ranged from 65% to 85%, 1% to 20%, and 5% to 15% for wheat, DSF, and MLP, respectively, whereas the baking temperature and time were ranged from 180°C to 200°C and 7–11 min, respectively. The result showed that there were significant differences (p < 0.05) among the formulated samples in nutritional and functional characteristics at different blending ratios, baking temperatures, and baking times. It was also found that the optimum parameters to develop functional cookies in terms of the optimum overall acceptability, protein content, and TPC were when the blending ratio of 75% wheat, 15% DSF, and 10% MLP, with baking temperature at 180°C for 8.75 min. The cookies developed using these optimum parameters had a protein content and TPC of 15.54% and 2.64 mg GAE/g, respectively, with the overall acceptability score of 6.49 (on a seven-point hedonic scale). In addition, the optimized cookies had 16.76%, 3.82%, 9.10%, 1.96%, 57.12%, and 424.23 kcal/100 g of crude fat, fiber, moisture, ash, carbohydrate, and calories, respectively. In addition, the antioxidant activities of the optimized cookies with the percentage of inhibition were 39.81% for DPPH and 35% for FRAP. These cookie samples also had the values of 6.40 N for hardness, 0.29 for water activity, and 5.14% for spread ratio. The findings of this study showed that the blending ratio of the three ingredients had a significant impact on the sensorial acceptability of the developed cookies, as well as protein content and TPC were highly influenced by DSF and MLP ratios. Therefore, developing nutrition-enriched wheat-based cookies by blending with defatted soybean and M. stenopetala leaf powder using the aforementioned optimum parameters will improve the nutritional content of the cookies product with the preferred overall sensorial acceptability.
1. Introduction
Cookies are popular among both children and adults. Since cookies do not contain as much moisture as other baked goods such as breads or cakes, they last longer and are less susceptible to microbial deterioration [1].
Malnutrition is the primary cause of death in approximately 45% of children under the age of five [2]. Most complementary foods in developing countries are starchy root crops or cereals, such as whole wheat which cannot provide the wider nutritional compositions [3]. In Ethiopia, protein deficiency is the most common cause of malnutrition among all potential causes. One strategy to solving this protein malnutrition problem is the effective utilization and consumption of plant proteins. The plant proteins are affordable and versatile in nature.
The defatted soybean seed cake is a nutritionally (higher protein and fiber) rich byproduct of the edible oil extraction industries. According to FAO [4], India is the world’s greatest producer of oilseeds, producing about 25 million tons of oilseed cakes annually. In terms of quantity, soya deoiled cake is the most common byproduct worldwide, followed by canola seed cake. Various studies have reported the use of these protein-rich resources for human consumption. It is therefore possible to use soya deoiled cake flour (defatted soybean flour [DSF]) for human consumption as well as animal feed [5]. The effective consumption of the deoiled cake can alleviate malnutrition and solve the problem of oilseed cake disposal. Effective utilization also facilitates better additional income sources for the oilseed producing farmers and processors.
Moringa stenopetala is commonly known as the African Moringa tree. In Ethiopia, it is underutilized and referred by several names in different languages, Halako (Gamo/Wolayita), Shiferaw (Amharic), Shalchade (Konso), and cabbage tree [6]. The leaves are rich in nutrients and bioactive compounds with higher antioxidant activities, which have the potential to prevent various chronic illnesses such as diabetes and hypertension [7, 8], and the leaf extract has a high degree of antioxidant activity [9]. This shows that using Moring leaf powder (MLP) in food formulations improves the nutritional and bioactive content of the product. Therefore, DSF and MLP were chosen as the sources of protein and antioxidants in this study. By considering the aforementioned benefits and gaps, the purpose of this study was to develop nutrition- enriched wheat-based cookies from wheat flour, DSF and MLP formulations, as well as to optimize the blending ratios, baking temperature, and baking time to improve the overall acceptability and protein content with total phenolic content (TPC).
2. Materials and Methods
2.1. Raw Material Collection
Five kilograms of DSF (Gonder variety) were obtained from Kunifera Agro-Processing PLC., Addis Ababa, Ethiopia. MLP (1 kg) was obtained from Zeise Talaye Moringa Processer Cooperative, Arba Minch, Ethiopia. Whole wheat grain (Boru variety, 15 kg) was purchased from Kulumsa Agricultural Research Center, Asella, Ethiopia. Other ingredients, such as sugar (10 kg), baking powder (1 kg), shortening oil (3 L), and salt (0.5 kg) were purchased from the Addis Ababa local market.
2.2. Raw Material Processing
The DSF and whole wheat samples were cleaned to remove foreign materials before being processed. They were dried to a moisture content of less than 12% and milled using a laboratory miller (MF 3170, Hagersten, Sweden). The MLP was dried at room temperature (about 25°C) for 7 days under shade. Then, the prepared flours were sieved through a 0.5 mm sieve, packed in polyethylene bags, and stored at refrigeration temperature (4°C) until further use and analysis.
2.3. Experimental Design
A total of 18 combinations were generated using D-optimal custom design with three ingredients (whole wheat flour/DSF/MLP), baking time, and temperature using Design-Expert software (Version 12) to examine the response pattern for protein, TPC, and overall acceptance of cookies. The lower and upper ranges of the three factors are presented in Table 1. These ranges were determined using previously published research [10–12] and preliminary experiments. The validity of the optimum condition was confirmed with triplicate experimental data, which were compared with the data from the optimization analysis.
| Factors | Units | Levels | ||
|---|---|---|---|---|
| Baking temperature | °C | 180 | 190 | 200 |
| Baking time | min | 7 | 9 | 11 |
| Blending ratio | % | 85/10/5 | 75/15/10 | 65/20/15 |
- Note: Blending ratio was in the sequence of whole wheat flour/soya deoiled cake flour/Moringa leaf powder.
2.4. Cookies Preparation
The cookies were prepared according to Igbabul et al. [13] with some adjustments. Hundred grams of different composite flours (as shown in Table 1) were mixed with 40 g palm oil, 43 g sugar, 1.67 g NaHCO3, 1.25 g salt, and 1 g baking powder. These blends were mixed with 22 g of water and kneaded to make dough. Then, the dough was prepared into 3-mm-thick sheets with a kitchen rolling pin and cut into a diameter of 4.5 cm with the cookie cutters. The cookies were baked in an oven at different baking temperatures and times (Table 1). Finally, the cookies were allowed to cool at room temperature and placed in airtight plastic bags and kept at −20°C for further analysis. The control cookies were prepared with 100% wheat flour.
2.5. Proximate Analysis
2.6. Determination of Water Activity
The water activity was determined using a water activity analyzer (AQUALAB 4TE, USA) at 25°C [16].
2.7. Color Analysis
Color measurements, L∗ (lightness), a∗ (redness-greenness), and b∗ (yellowish-bluish), of the formulated cookie samples were carried out using a spectrophotometer (Jasco V-770, Japan) [17].
2.8. Texture Analysis
The texture of the cookie samples was determined using a texture analyzer (TA1, LLOYD, England). The probe (4 mm wide) was run perpendicular to the sample’s major dimension at a constant speed of 2 mm/s. The hardest force (N) needed to shear the sample was measured and the distance at which the highest force is reached was also measured [18].
2.9. Physical Dimensions
2.10. TPC
2.11. Free Radical Scavenging Using the DPPH Assay
2.12. Ferric-Reducing Antioxidant Power (FRAP)
The FRAP was determined according to Chaves et al.’s [21] method. A 2.5 mL of 0.2 mM phosphate buffer solution at pH 6.6 and 2.5 mL of 1% potassium ferrocyanide were combined with aliquots of 1 mL of each methanol-extracted sample solution (Conc. 0.1, 0.5, 1, and 2 mg/mL). The mixture was centrifuged at 1000 rpm for 10 min after 2.5 mL of 10% trichloroacetic acid was added. Then, 2.5 mL of the supernatant was mixed with 2.5 mL of distilled water and 0.5 mL of 0.1% FeCl3, followed by the addition of 0.5 mL of 0.1% ferric chloride. Finally, the absorbance was measured at 700 nm using a spectrophotometer and the FRAP was expressed as a percentage of inhibition.
2.13. Sensory Evaluation
Sensory evaluation was conducted according to Svensson [22]. A seven-point hedonic scale (1 corresponds to “dislike it very much” and 7 corresponds to “like very much”) was used to evaluate the aroma, taste, and color. Randomly coded product samples were arranged in a random order on white plates and served to the panelists. The test was conducted by semitrained panelists (15 members). Potable water was provided as palate cleaners between sample evaluations.
2.14. Statistical Data Analysis
The processing parameters were optimized using D-optimal custom design and response surface methodology using Design-Expert software Version 12. The data were analyzed using Minitab software (Version 21), and the results are presented as mean ± standard deviation. To separate statistically the mean values of the results, one-way analysis of variance (ANOVA) and the significance test at p ≤ 0.05 were used.
3. Results and Discussion
3.1. Effect of Processing Parameters on Protein Content of Cookies
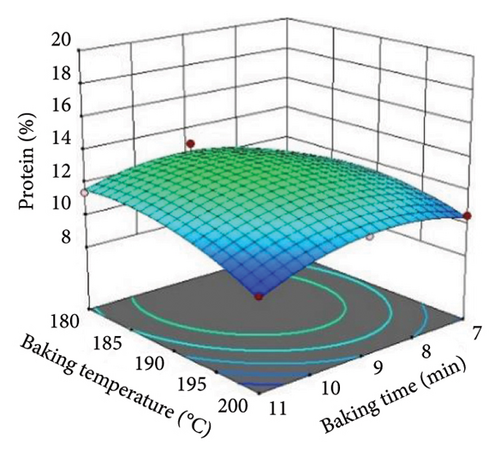
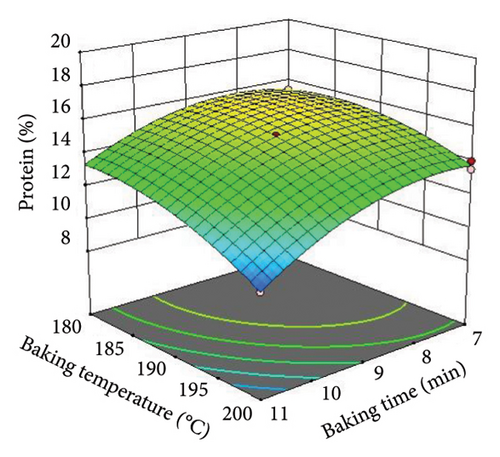
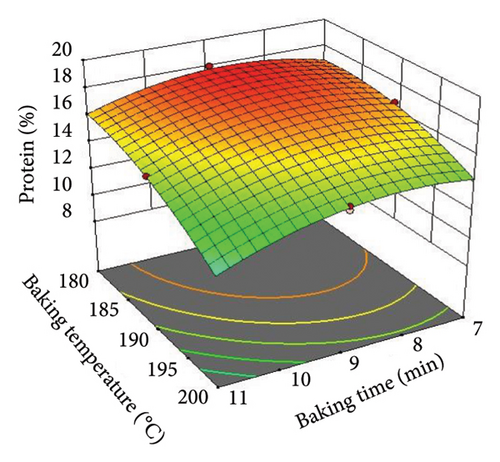
The cookies with the highest protein content (18%) were determined in the cookies prepared from a blending ratio of 65/20/15 (whole wheat flour/DSF/MLP) and baked at a temperature of 180°C for 9-min baking time. In contrast, the cookies with the lowest protein content (9.5%) were made with a 85/10/5 blending ratio of whole wheat flour/DSF/MLP and baked at 200°C for 11 min (Table 2). The protein content of the cookies increased mainly due to the addition of DSF. This is attributed to the DSF having a high protein content [23]. This finding agreed with the protein content of the cookies 7.53%–21.08% [24] and 11.6%–16.3% [25] from composite flour of whole wheat and DSF. As illustrated in Figure 1, the protein content of cookies was significantly (p < 0.05) affected by both baking temperature and time. The protein content of the cookies was lower when the baking temperature and time increased. This could be due to the partial destruction of some amino acids and other nitrogenous compounds [26]. In addition, a high temperature leads to the chemical reaction, Maillard reaction, which takes place between reducing sugars and amino acids, which also leads to the formation of non-nutritional compounds that could reduce the availability of amino acids such as protein [27]. According to Liu et al. [28], the secondary structure of the protein is changed from α-helix to β-sheet and β-turn when the baking temperature and frying times were increased.
| Runs | Factors | Responses | ||||
|---|---|---|---|---|---|---|
| Baking temp (°C) | Baking time (min) | Blending ratio (%) (wheat flour/DSF/MLP) | Protein (%) | TPC (mg GAE/g) | Overall acceptability | |
| 1 | 200 | 9 | 85/10/5 | 11 | 0.3 | 5.6 |
| 2 | 200 | 11 | 85/10/5 | 9.5 | 0.1 | 5.2 |
| 3 | 190 | 9 | 75/15/10 | 15.3 | 3.19 | 5.8 |
| 4 | 190 | 7 | 65/20/15 | 16.6 | 6.6 | 5.4 |
| 5 | 200 | 9 | 65/20/15 | 14.5 | 3.58 | 4.4 |
| 6 | 180 | 9 | 85/10/5 | 13 | 2 | 6.6 |
| 7 | 200 | 7 | 75/15/10 | 14 | 2.61 | 5.2 |
| 8 | 200 | 9 | 65/20/15 | 14.2 | 3.57 | 4.3 |
| 9 | 180 | 11 | 85/10/5 | 11.4 | 1.93 | 6.5 |
| 10 | 180 | 7 | 75/15/10 | 15.4 | 2.88 | 6.4 |
| 11 | 180 | 9 | 65/20/15 | 18 | 5.15 | 5.6 |
| 12 | 200 | 7 | 85/10/5 | 10.5 | 0.97 | 5.8 |
| 13 | 190 | 9 | 85/10/5 | 12.5 | 1.5 | 6.2 |
| 14 | 200 | 7 | 75/15/10 | 13.5 | 2.75 | 5.2 |
| 15 | 180 | 9 | 65/20/15 | 17.5 | 4.99 | 5.6 |
| 16 | 180 | 7 | 85/10/5 | 10.8 | 2.25 | 6.2 |
| 17 | 200 | 11 | 75/15/10 | 10 | 2 | 4.6 |
| 18 | 190 | 11 | 65/20/15 | 15 | 4 | 4.7 |
- Note: DSF, soya deoiled cake flour.
- Abbreviations: GAE, gallic acid equivalent; MLP, Moringa leaf powder; TPC, total phenolic content.
3.2. Effect of Processing Parameters on TPC of Cookies
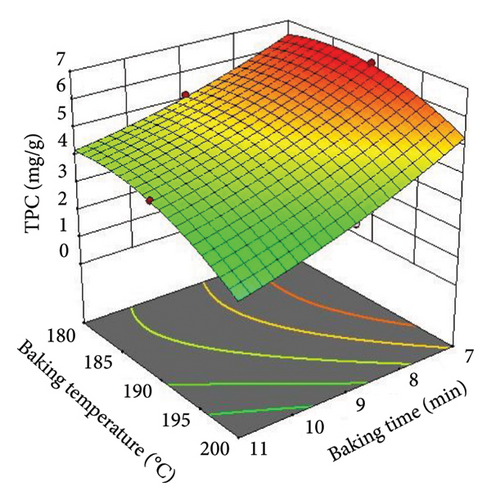
The TPC of cookies in this study ranged from 0.1 mg/g in the cookies prepared from 75/15/10 of wheat flour/DSF/MLP, baked at 200°C for 11 min, while the highest TPC was 6.6 mg/g in cookies prepared from 65/20/15 of wheat flour/DSF/MLP, baked at 190°C for 7 min. The TPC of the cookies prepared in this study is in close agreement with the results of cookies enriched with MLP and spirulina powder (0.95–5.35 mg/g TPC) [29] and higher than the TPC of bread (2.33 mg/100 g) from MLP and wheat flour blend as reported by Khan et al. [30]. The variation in the TPC could be attributed to the usage of the extraction solvent, methanol, that is reported as a better extraction solvent than ethanol for the determination of TPC in MLP [31]. The lower amount of TPC in the cookies prepared in this study is attributed to the baking temperature and time. As shown in Figure 2, the TPC of cookies in the current study was significantly (p < 0.0001) affected by both baking temperature and time as well as their interaction, which decreases as baking temperature and time increase.
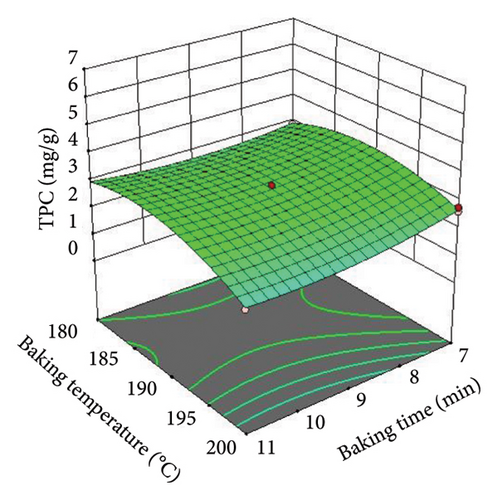

The loss of TPC by higher heat treatments is well reported and the high-temperature conditions during baking would be expected to degrade TPC. According to Daniel et al. [32], it is recommended to use a minimal heat treatment for lower durations (5–10 min) to preserve the antioxidant and TPC of MLP extracts. According to Razzak et al. [33], higher cooking times increase exposure to oxygen and decrease the TPC. This situation makes it easier for oxidase enzymes to carry out the oxidation process of the polyphenols. According to Vongsak et al. [34], antioxidant components in MLP extracts observed a rapid reduction when stored at high temperatures and relative humidity. Lower baking temperatures and times might not result in a significant decline in the TPC.
MLP is one of the most powerful natural antioxidant sources due to the presence of bioactive compounds that reduce the harmful effects of free radicals [8]. According to Khan et al.’s [30] study, there is a positive correlation between the concentration of phenolic compounds and antioxidant activity. The higher TPC of cookies was attributed to the presence of higher quantities of the TPC present in the raw materials. Therefore, in the present study, the TPC of the cookies was enriched with the increment of the MLP. In addition, it was also found that the TPC was negatively affected as the baking temperature was increased and to some extent, the baking time. As illustrated in Figure 2, at higher baking temperatures and times, the TPC of the cookies was decreased. According to Dadi et al. [8], the TPC of MLP was degraded when exposed to higher temperatures and longer times, which indicates that the bioactive compounds and antioxidant activity could be decreased in the food product. In this study, it was found that a higher TPC was found in the cookies developed from a 65/20/15 blending ratio of wheat flour/DSF/MLP baked at a temperature of 190°C for 7 min. While a lower TPC was found in cookies prepared from an 85/10/5 blending ratio of wheat flour/DSF/MLP, which was baked at a temperature of 200°C for 11 min (Figure 2). This might be related to a higher percentage of MLP (20%) in the former cookies and a lower percentage of MLP (5%) in the latter cookies. In addition, baking temperature and time also have effects on the TPC of the cookies (Table 2). Therefore, the blending ratio, baking temperature and time, and their interaction have a significant (p < 0.05) effect on the TPC of cookies.
3.3. Effect of Processing Parameters on Overall Acceptability of Cookies
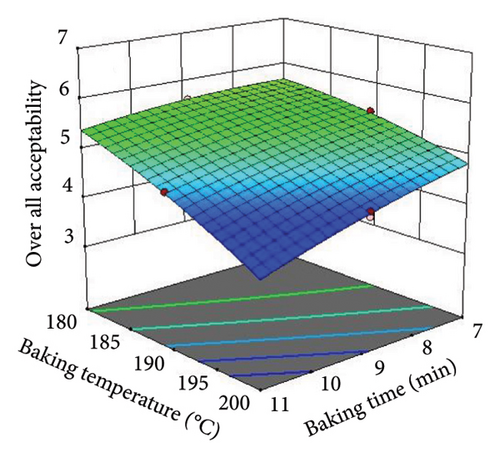
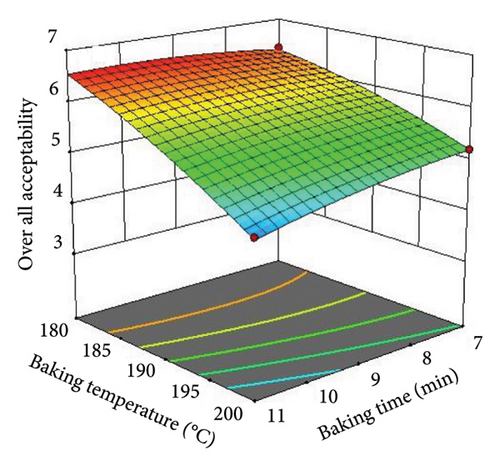
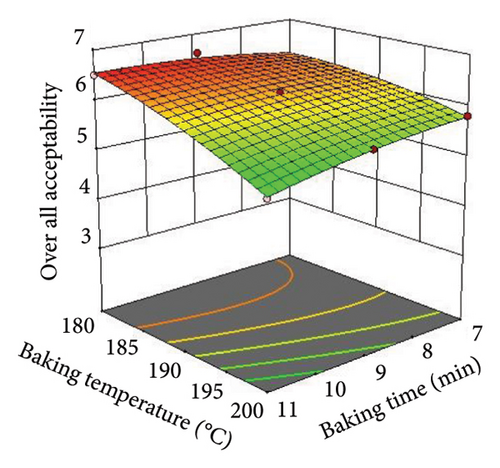
The overall acceptability of the developed cookies was measured based on appearance, color, aroma, taste, crispiness, and texture. The acceptance ratings for the cookies ranged from 4.3 to 6.6. The cookies prepared from 85/10/5 of wheat flour/DSF/MLP baked at 180°C for 9 min were the most preferred by the panelists. According to Adeyeye and Olalekan [35], the cookies developed from a high proportion of the wheat flour (100% wheat flour) had comparable acceptability with cookies developed from composite flours containing DSF and MLP. In the current study, cookies prepared from 85/10/5 of wheat flour/DSF/MLP showed a higher acceptability score than others. The overall acceptability of the cookies enriched with MLP and DSF flour was studied by varying the blending ratio, baking temperature, and baking time. It was found that the overall acceptability was highly affected by the addition of MLP and DSF, baking temperature, and, to some extent, baking time.
The addition of MLP and DSF affected the sensory acceptability of cookies. This might be due to the unfamiliar feeling of the panelist. The reduction in the wheat flour ratio is the main reason for the reduction of cookies’ physical properties. According to Chizoba’s [36] study, the acceptability of the cookies reduced as the level of the MLP increased. In another study, Ikorodu [37] reported that the replacement of wheat flour with up to 20% of soybean flour in cookie preparation showed better sensory acceptability. In this study, the higher overall sensory acceptability was observed for the cookies developed from the composite flour of 85/10/5, wheat flour/DSF/MLP, respectively, which was baked at 180°C temperature and 9 min of baking time (Figure 3). On the contrary, the lower overall acceptability was received for cookies developed from 65/20/15 of wheat flour/DSF/MLP composite flour baked at a higher temperature (200°C) and for 9 min of baking time. This may be attributed to the higher percentage of MLP (15%) in cookies. Therefore, it can be concluded that the blending ratio, baking temperature, and baking time and their interaction have a significant (p < 0.05) effect on the overall acceptability of cookies.
3.4. Optimization of Process Parameters and Model Validation
3.4.1. Modeling and the Experimental Findings
The F-values are 88.58, 213.51, and 128.37 for protein, TPC and OAA, respectively. The model was found to be statistically significant, which means a 0.01% chance that the F-value would be large, which might be due to noise. Moreover, p ≤ 0.05 indicates that the model terms were significant. The lack of fit value is another model fit indicator. In this study, the p value was p > 0.05 and the lack of fit was nonsignificant, which indicates that the model fits well. The R2 values of the protein, TPC, and OAA were 0.9939, 0.9975, and 0.9958, respectively. These showed that the R2 was close to one, which implies that the predicted data and the experimental data were close to each other.
3.4.2. Optimization of Process Parameters
The desired goal for each processing variable and the response was selected. Numerical optimization of all independent variables (blending ratio, baking temperature, and baking time) was kept in a range, while the dependent variables (TPC, crude protein, and overall acceptability) were maximized, since they all are necessary responses. The selected optimum parameters to develop nutrient-rich wheat-based cookies were a blending ratio of 75/15/10 (wheat flour/DSF/MLP), baking temperature of 180°C, and baking time of 8.75 min with the predicted values of 15.74%, 2.71 mg GAE/g, and 6.5 for protein, TPC, and overall acceptability at a desirability of 0.75. According to Khan et al. [38], a desirability value greater than 0.7 is considered outstanding.
3.4.3. Model Validation of Optimized Cookies
As shown in Table 3, the experimental values and the predicted values were not significantly different from the lower percent error, which tells us that the model fitted well.
| Factors | Responses | |||||
|---|---|---|---|---|---|---|
| Blending ratio (%) (wheat flour/DSF/MLP) | Baking time (min) | Baking temp. (°C) | Protein (%) | TPC (mg GAE/g) | OAA | |
| Predicted | 75/15/10 | 8.75 | 180 | 15.74 | 2.71 | 6.52 |
| Experimental | 75/15/10 | 8.75 | 180 | 15.54 ± 0.05 | 2.64 ± 0.04 | 6.49 ± 0.03 |
- Note: DSF, soya deoiled cake flour; OAA, overall acceptability.
- Abbreviations: MLP, Moringa leaf powder; TPC, total phenolic content.
3.4.4. Proximate Analysis of Optimized Cookies
The result of the proximate compositions and energy values of the optimized and control cookies are shown in Table 4. The crude protein content of control cookies was significantly (p < 0.05) lower (8.5%) than that of the optimized cookies (15.03%). The higher protein content in the optimized cookies was attributed to the higher protein content of DSF and MLP. The fat content of cookies developed from optimized parameters was significantly (p < 0.05) higher (16.76%) than the control cookies (14.75%). This might be attributed to the higher fat content present in the DSF.
| Sample | Protein (%) | Fat (%) | Ash (%) | Moisture (%) | Fiber (%) | CHO (%) | Energy (kcal/100 g) | aw |
|---|---|---|---|---|---|---|---|---|
| Control | 8.5 ± 0.5b | 14.75 ± 0.25b | 1.27 ± 0.02b | 8.23 ± 0.25a | 2.41 ± 0.10b | 67.19 ± 0.40a | 426.00 ± 1.62a | 0.34 ± 0.01b |
| OPC | 15.54 ± 0.15a | 16.76 ± 0.25a | 1.96 ± 0.02a | 9.10 ± 0.01a | 3.82 ± 0.02a | 57.12 ± 0.34b | 424.23 ± 0.01a | 0.29 ± 0.02a |
- Note: All mean values with different superscript letters in a column differ significantly (p < 0.05). Control, cookies developed from 100% wheat flour; OPC, cookies developed using optimized parameters.
The ash content of the cookies developed from optimized parameters was significantly (p < 0.05) higher (1.96%) than that of the control cookies (1.27%). This may be due to the relatively higher mineral content of MLP [7]. The moisture content of both the control and optimized cookies was not significantly different (p > 0.05) and had a lower moisture content of 8.23% and 9.1%, respectively, which favors the cookies for long shelf life.
The fiber content of the cookies developed from optimized parameters was significantly (p < 0.05) higher (3.82%) compared to the cookies developed from 100% wheat flour (2.41%). It was found that MLP has a higher fiber content [7], which contributed to the improvement of the fiber content of the cookies. On the other hand, the control cookies had a higher carbohydrate (67.19%) content compared to the cookies developed from optimized parameters (57.12%) (Table 4). The carbohydrate content in the formulated cookies is attributed to the higher carbohydrate content of the wheat as compared to DSF and MLP. The energy content of the cookies both from the control and optimized parameters was not significantly (p > 0.05) different.
The water activity of the cookie sample prepared from optimized parameters was lower than that of the control cookie sample. This may be due to the relatively higher water absorbance capacity of wheat flour. According to Ayub and Mohammad [39], the water activity below 0.6 effectively preserves food products by preventing microbial deterioration. Thus, both cookies were within the acceptable range.
3.4.5. Physical Properties of the Cookies
The hardness of the cookies developed from the control (100% whole wheat flour) and optimized parameters is shown in Table 5. The hardness of the control cookies was higher (6.40) than the cookies developed from optimized parameters (4.84 N). This might be related to the higher fiber content of the optimized cookie sample due to the presence of DSF and MLP and the lower gluten level.
| Sample | Hardness (N) | Diameter (cm) | Thickness (cm) | Spread ratio (%) |
|---|---|---|---|---|
| Control | 6.40 ± 0.12b | 6.24 ± 0.05b | 1.16 ± 0.01b | 5.38 ± 0.00a |
| OPC | 4.84 ± 0.23a | 6.43 ± 0.01a | 1.25 ± 0.06a | 5.14 ± 0.00b |
- Note: Mean values with different superscript letters in a column differ significantly (p < 0.05). Control, cookies from 100% whole wheat flour; OPC: cookies using optimized parameters.
The diameter, thickness, and spread ratio of the control and optimized cookies are shown in Table 5. The diameter and the thickness of a cookie developed from optimized parameters were higher than those of the control. This might be related to the lower viscosity of the composite flour caused by the inclusion of DSF and MLP. Similarly, Chauhan et al. [40] reported that adding a higher p ratio amaranth flour to wheat in cookie formulation reduces cookies’ diameter. The size of a cookie can impact the overall eating experience and thicker cookies tend to be softer and chewier, while thinner cookies tend to be crispier [41]. Since the diameter and thickness of cookies from optimum conditions were higher than those of the control cookies, the spread ratio of the control cookie samples was higher compared to the cookies developed from the optimum parameters. The spread ratio decreases when the diameter is dropped and the cookies’ thickness increases. The higher spread ratio was reported when the dough had lower viscosity, which is due to DSF and MLP that change the dough’s structure, allowing less spread ratio when baked. The results of the present study are in line with Abdel-Samie and Abdulla [42], who reported that the spread ratio of cookie samples having MLP was lower than the control samples.
3.4.6. Color Cookies
The L∗ values of cookies for the control sample were 50.56 and cookies from optimized parameters were 33.95. This result shows that as the DSF/MLP were added, the cookies were darker and L∗ values decreased (Figure 4). The values of the control cookies and optimum cookies were +2.61 and −1.84, respectively. The cookies made from the optimum formulation showed green color cookies. This is due to the green color of MLP (Figure 4).
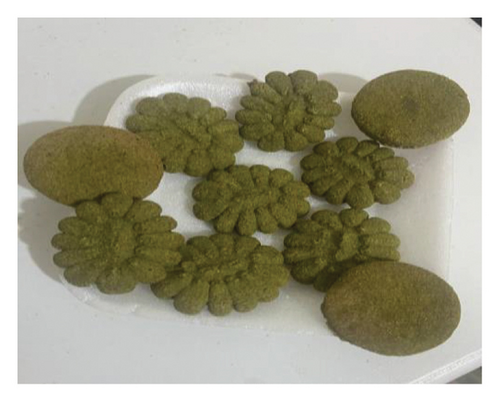
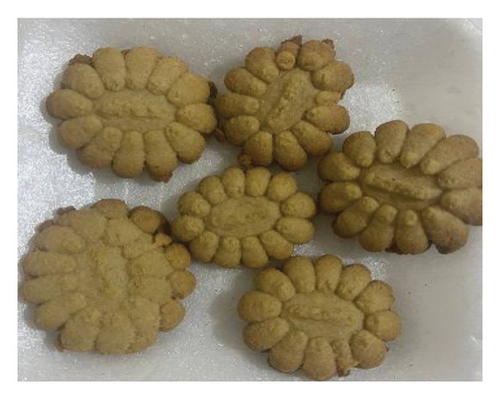
On the other hand, the b∗ values (yellow color) of the control cookies were higher than those of the cookies prepared from optimized formulation due to the whole wheat flour. Whereas the b∗ value decreased in the optimized cookies due to the presence of DSF and MLP (Table 6). These results were in agreement with Drisya et al. [43], who found that the values of L∗, a∗, and b∗ declined as the spinach leaf powder increased up to 15% in the composite dough.
| Sample | L∗ | a∗ | b∗ | ΔE |
|---|---|---|---|---|
| Control | 50.56 ± 0.11a | 2.61 ± 0.05a | 16.08 ± 0.02a | 52.05 ± 0.04b |
| OPC | 33.95 ± 0.03b | −1.84 ± 0.04b | 12.49 ± 0.03b | 67.25 ± 0.03a |
- Note: Mean values with different superscript letters in a column differ significantly (p < 0.05). Control, cookies from 100% whole wheat flour; OPC, cookies using optimized parameters.
3.4.7. Antioxidant Activity of the Cookies
Figure 5 shows the DPPH and reducing power assays that indicate the antioxidant activities of MLP. The result showed that cookies prepared from the higher content of MLP showed the highest antioxidant activities. This is also in agreement with Dadi et al. [44], who reported that the MLP extract has high antioxidant activities due to its high bioactive compounds such as TPCs and flavonoid compounds.
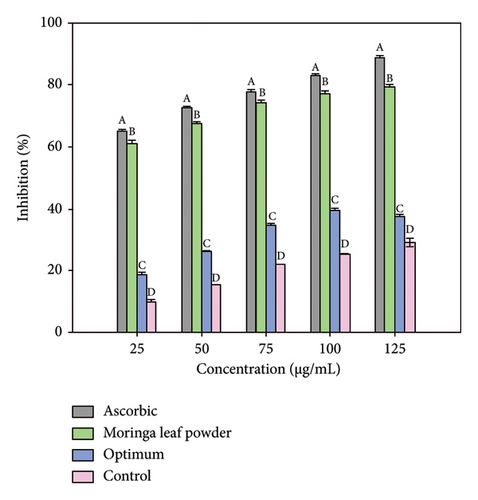
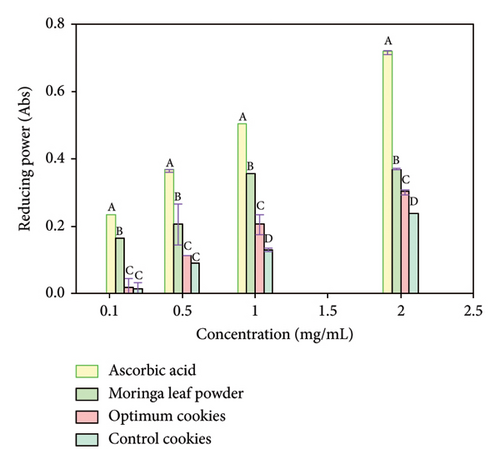
When the control and optimized cookies samples were compared, the cookies with the optimized formulation demonstrated higher levels of antioxidant activity (Figure 5). This is majorly related to the inclusion of MLP in the formulation. It also found that the antioxidant profile of functional cookies was the best and 14% peanut cake flour was added to cookies compared to the control [45]. Therefore, the cookies’ free radical scavenging activity increased due to MLP. There is a significant difference (p < 0.05) between the control and the cookies developed from optimal parameters. Hence, cookies developed with antioxidant and free radical–scavenging capabilities may impact their potential to prevent various chronic diseases [46].
4. Conclusion
This study showed that adding DSF and MLP to wheat flour improved the nutritional value of wheat-based cookies. In addition, the effect of process parameters revealed that higher baking temperatures and baking times reduced the protein and TPCs of the cookies. The developed cookies’ sensory acceptability varied greatly depending on the blending ratio and baking temperature and time. The current study shows that the blending ratio of 75% whole wheat flour, 15% DSF, and 10% MLP, with baking temperature of 180°C and 8.75 min baking time, were the optimum process parameters for wheat-based cookies with the optimum protein content (15.54%) and TPC (2.64 mg GAE/g) with the overall acceptability of 6.49. Therefore, the development of nutrient-enriched wheat-based cookies formulated from wheat flour, DSF, and MLP could serve as an alternative source of cookies for the food industry.
Conflicts of Interest
The authors declare no conflicts of interest.
Funding
No funding was received for this research.
Acknowledgments
The authors would like to thank the Department of Chemical Engineering, Addis Ababa Science and Technology University for providing laboratory facilities.
Open Research
Data Availability Statement
The data that support the findings of this study are available from the corresponding author upon reasonable request.


