Synergistic Effects of the Combination of Quercetin, Naringin, and Rutin on Cervical Cancer: Roles of Apoptosis and Autophagy
Abstract
Cervical cancer is, to date, the second most common cause of cancer in female patients worldwide. Most of the present-day research activities have concentrated on studies of antitumor medicinal plants and bioactive compounds obtained from natural flavonoids such as quercetin (Q), naringin (N), and rutin (R). The present study reported an in vitro method for assessing the combined anticancer activity of quercetin, naringin, and rutin in combination in HeLa cervical cancer cells. The anticancer potential of the compounds was investigated via experiments involving apoptosis, detection of ROS levels, rhodamine 123 staining, AO/EtBr staining, scratch tests, real-time methods, and Western blot techniques in protein-mediated autophagy pathways. On the basis of the results from the MTT assay and combination index, reasonable combinations of RQ and RQN were selected. Experiments revealed significant upregulation of Beclin1 protein levels and corresponding downregulation of P62, indicating enhanced autophagic flux in HeLa cells treated with flavonoid combinations. Assays for apoptosis revealed that the total number of apoptotic cells increased in a time-dependent manner, and the percentages of apoptotic cells enriched with the RQN combination were 16.07%, 65.02%, and 8.91% at 24, 48, and 72 h, respectively. The combination of RQ resulted in the following percentages of apoptotic cells at the same time points: 31.04%, 32.36%, and 11.46%. Real-time PCR and Western blotting of autophagy-related marker proteins revealed that the flavonoid combinations drastically modulated the autophagy pathway in HeLa cells by increasing the expression levels of Beclin1 (protein and expression levels) and LC3 (expression), whereas the expression level of P62 (protein and expression levels) notably decreased. Thus, these data suggest that flavonoid combinations may induce cervical cancer cell death through an autophagy-mediated mechanism and apoptosis. These flavonoid combinations represent potential therapeutic strategies for treating cervical cancer.
1. Introduction
Cervical cancer remains a critical public health problem worldwide and is the fourth most frequently diagnosed cancer among women [1]. In the United States, an estimated 13,360 new cases and 4360 deaths were recorded last year, making it the fourth most frequently diagnosed cancer among women in the country [2]. Treatments, including surgery, radiotherapy, and chemotherapy, although very much developed in this respect, are unfortunately not very effective, especially in advanced disease stages [3]. Hence, the overall survival rates are usually unsatisfactory, and new therapeutic approaches are urgently needed [3]. Recent preclinical studies have indicated the potential for the use of bioactive flavonoids as promising, nontoxic therapeutic options in chronic pathologies such as cancer [4]. Flavonoids are the primary plant compounds [5] and offer various health benefits, such as antioxidant [6], anti-inflammatory [7], and anticancer properties [8]. Natural flavonoids, such as quercetin, naringin, and rutin, have been widely studied in lung, blood, oral, and prostate cancers. These findings have extended the research on the effects of these compounds on cervical cancer cells. One of the flavonoids used in this study is rutin (R), which is a hydrophobic polyphenolic flavonoid phytochemical with broad pharmacological properties [9]. Different types of cancers, such as leukemia [8], colon cancer [10], neuroblastoma [11], hepatocellular carcinoma [12], and breast cancer [13], have been shown to have chemopreventive effects through extensive in vitro and in vivo research. Quercetin (Q) is another flavonoid component with manifold useful health benefits. Its cardioprotective activity, anticancer and antitumor properties, antiulcer effects, and ability to suppress allergies have been reported [14]. It exerts specific anticancer effects by suppressing cell proliferation, suppressing growth factors, and acting as an antioxidant [4]. Naringin (N) is a derived bioflavonoid that possesses a wide range of biological and pharmacological activities [8]. Research has revealed its beneficial effects, which include anticarcinogenic activity [15], superoxide scavenging [4], apoptotic properties [16], and antioxidant activity [8].
Although significant progress has been made in cancer therapy, a major challenge remains due to the complex characteristics of cancer resistance [17]. Since the appearance and inhibition of tumors are closely related to the regulation of apoptosis, one of the main oncotherapy strategies is programmed cell death, or the induction of apoptosis [18]. Ferroptosis and autophagy are two examples of the numerous novel nonapoptotic cell death mechanisms that have been described recently, revealing molecular mechanisms that go beyond apoptosis [19]. Autophagy has emerged as a very important biological process in combating cancers, especially cervical cancer, in the human body [20]. Autophagy is an evolutionarily conserved process in which organelles and proteins are sequestered and transported to lysosomes for turnover. Its induction is characterized by the formation of a phagophore or isolated membrane, which expands and closes to form an autophagosome. The latter then fuses with lysosomes to degrade their contents [21]. The dual nature of the impact of autophagy on tumor formation and tumor progression remains an object of active investigation [22]. Although induced initially as a tumor-suppressing mechanism, autophagy can promote cell survival, metastasis, and protection of cancer cells against environmental and drug-induced stress [23]. Therefore, targeting autophagy has become a novel strategy in cancer therapy.
Combination therapy, a modality of treatment using two or more therapeutic agents, is one of the cornerstones of cancer therapy. Compared with monotherapy, combination therapies for treating cancer can target pathways that induce disease more effectively [24, 25]. Monotherapy, though common, can result in significant toxicity and immune suppression due to its nonspecific nature. In contrast, combination therapy, although often toxic as well, tends to decrease overall toxicity because of the different pathways targeted and the allowance of reduced dosages of each pharmaceutical agent [26].
This study aimed to understand whether combination therapy with various flavonoid compounds (rutin, quercetin, and naringin) alters cervical cancer cell growth and the expression of genes and proteins associated with the autophagy pathway in laboratory culture models. We assessed the potential of this combination as a new therapeutic option for cervical cancer.
2. Methods
2.1. Cell Lines and Culture Conditions
The HeLa cell line, purchased from the Cell Bank of the Pasteur Institute of Iran repository, was cultured under controlled conditions; the culture medium consisted of DMEM supplemented with 10% FBS and 1% P/S; the cells were maintained at 37°C with 5% CO2 until they reached 80%–90% confluence [27]. These were then either subcultured or harvested after approximately 2-3 days for further experimental procedures. Furthermore, normal fibroblasts were well prepared and cultured under controlled conditions to make valid and relevant comparisons. These individuals were considered the healthy control group and were exposed to the same set of conditions as the experimental groups were. The consistency in the culture environment was maintained to keep at the minimal level any biased event and to establish a very reliable baseline against which the effects of different variables on cellular behavior can be determined.
2.2. Cell Cytotoxicity Study
The cytotoxic effects of rutin, quercetin, naringin, and their combination on HeLa cells were determined via the MTT assay. HeLa cells were seeded at a density of 2 × 10³ cells/well and then treated with increasing concentrations of rutin, quercetin, and naringin for variable periods of 24, 48, and 72 h. The combinations of rutin and quercetin, rutin and naringin, naringin and quercetin, and the triple combination of rutin, quercetin, and naringin were analyzed after 24, 48, and 72 h. The chosen concentrations of all the combination drugs were deliberately selected to span a good value range for the detailed study of their cytotoxic potential in HeLa cells. Notably, the dilution factor was considered constant across all the treatments. After that, the cells were treated with MTT reagent for 3-4 h, and the degree of cell survival was quantified via an absorbance reading at a wavelength of 570 nm to further determine the IC50 values obtained from the curves [28]. Normal fibroblasts were further cultured under the same conditions as HeLa cells at a seeding density of 2 × 10³ cells per well. These fibroblasts received the same drug treatments as those to which HeLa cells had been subjected, involving single drugs and various combinations of two or three drugs. The concentrations used for treatment were the same as those used for the treatments of HeLa cells, and a standardized treatment duration of 24 h was maintained to compare the cytotoxic effects of the different treatments on both cell types.
2.3. Real-Time Polymerase Chain Reaction (RT-PCR)
Quantitative RT-PCR was conducted. Briefly, after cell treatment, total RNA was extracted via an RNA extraction kit (TRIzol Reagent, Cat. No. 15596026; Invitrogen) according to the manufacturer’s protocol. The quality and concentration of the RNA were subsequently checked via electrophoresis and a NanoDrop spectrophotometer (NanoDrop 2000/2000c Spectrophotometers, Thermo Scientific, Inc., Wilmington, DE, USA) according to the 260/280 nm ratio. After that, with 1 μg of total RNA, cDNA synthesis was executed via a cDNA synthesis kit (ADDBIO, Cat. No. 22701, Korea) and amplification was carried out using specific primers (see Table 1). Gene expression levels were determined via the RealQ Plus 2x Master Mix Green (AMPLIQON, Cat. No. A323402, Denmark) protocol. The data were analyzed via the 2−ΔΔCT method. The CT value for each gene was normalized to the expression of the housekeeping gene (β-actin).
| Genes | Accession number | Annealing (°C) | Product length (bp) | Forward | Reverse |
|---|---|---|---|---|---|
| P62 | NM_003900 | 60 | 92 | GCACCCCAATGTGATCTGC | CGCTACACAAGTCGTAGTCTGG |
| LC3 | NM_032514 | 58 | 127 | AACATGAGCGAGTTGGTCAAG | GCTCGTAGATGTCCGCGAT |
| BECN1 | NM_003766 | 58 | 215 | CCATGCAGGTGAGCTTCGT | GAATCTGCGAGAGACACCATC |
| ACTB | NM_001101 | 60 | 146 | TGACCCAGATCATGTTTGAGACC | CTCGTAGATGGGCACAGTGTGGG |
2.4. Western Blotting
For the purpose of Western blotting, HeLa cells were exposed to various concentrations of RQ or RQN and incubated for 24, 48, or 72 h. The cells were then lysed in RIPA lysis buffer supplemented with protease inhibitor cocktail (P8340; Sigma-Aldrich; Merck Millipore). The total protein concentration in each group was measured via a BCA assay kit from Thermo Scientific. The proteins collected (30 μg per sample) were then separated via SDS—PAGE (12.5%) and transferred to a PVDA membrane.
After protein transfer, membrane blocking was carried out with 10% skim milk (1 h), and then the washed membranes were incubated overnight at 4°C with primary antibodies against P62, Beclin1 (1:1000 dil), with β-actin as the internal control at a dilution of 1:1000 for subsequent probing. The membranes were then washed three times for 10 min with 1X TBST buffer and incubated for 2 h at room temperature with secondary antibodies conjugated to horseradish peroxidase (HRP) diluted 1:4000. Then, the membranes were washed again three more times with 1X TBST buffer for 10 min each. Chemiluminescent reagents (123072; Sigma—Aldrich; Merck Millipore) were applied on top for the visualization of blots for 2 min. Chemiluminescent signals that resulted were captured using the ChemiDoc MP imaging system from Bio-Rad, while band intensities were quantified by densitometry analysis using Image Lab software, Version 6.1 (https://imagej.nih.gov/ij/download.html).
2.5. Flow Cytometry
Induction of apoptosis was assessed by flow cytometry according to the propidium iodide (PI) staining procedure. Briefly, cells were plated in six-well plate and exposed to RQ and RQN for 24-, 48-, and 72-h time durations. Following treatment, the cells were harvested by the EDTA buffer and subsequently centrifuged at 1500 × g in cold conditions. Cell pellets were washed with phosphate-buffered saline (PBS) and resuspended in a hypotonic PI lysis buffer containing 1% sodium citrate, 0.1% Triton X-100, 40 μg/mL PI, and 0.5 mg/mL RNase A. The samples were incubated at 37°C for 30 min to stain the nuclei before analysis by flow cytometry.
2.6. Mitochondrial Membrane Potential
This study used a fluorescent dye called rhodamine 123, which is a critical factor in the induction of apoptosis, to investigate the mitochondrial membrane potential. The uptake of rhodamine 123 is determined chiefly by the negative charge inside the mitochondrial matrix, which is controlled by the protonic membrane potential of the mitochondria. During cellular apoptosis, mitochondria undergo depolarization of membranes, which releases rhodamine 123 from the mitochondria and thus leads to a decrease in the intracellular fluorescence intensity. After treatment, the cells were washed with PBS and incubated with rhodamine 123 in the concentration of 10 μg/mL for 30 min at 37°C, followed by washing twice with PBS. The fluorescence images were taken with a fluorescence microscope (Agilent, BioTek Cytation 5 Cell Imaging Multimode Reader, USA).
2.7. Acridine Orange and Ethidium Bromide (AO/EB) Staining
HeLa cells were seeded in 6-well tissue culture plates at a density of 5 × 10⁵ cells per well. The cells were then subjected to treatment. Following treatment, the cells were washed twice with PBS. After trypsinization, the cells were stained with acridine orange (3 μg/mL) and ethidium bromide (10 μg/mL) and immediately observed under a fluorescence microscope (Agilent, BioTek Cytation 5 Cell Imaging Multimode Reader, USA).
2.8. Evaluation of Intracellular ROS Levels
The cellular oxidative stress status was assessed via the oxidation of the fluorescent compound 2′,7′-dichlorofluorescein diacetate (DCFH-DA). After cellular entry, DCFH-DA undergoes enzymatic cleavage by an intracellular esterase to form the nonfluorescent compound 2′,7′-dichlorofluorescin (DCFH). Intracellular ROS (hydrogen peroxide (H2O2) and superoxide anions (O2˙-)) subsequently oxidize DCFH to yield highly fluorescent 2′,7′-dichlorofluorescein (DCF). HeLa cells were grown in 6-well plates and treated for 6, 24, 48, or 72 h. The cells were then washed and incubated in fresh medium containing 10 μM DCFH-DA at 37°C for 1 h. Then, the cells were washed and resuspended in PBS, and the fluorescence intensity was measured via flow cytometry [29].
2.9. Cell Scratch Assay
The ability of the cells to migrate was examined via a cell scratch test. Six-well plates were filled with the cells. Following a 48 h cultivation period, the pipette tip was used to scratch the line via a ruler. After the underlined cells were removed from the cells via three PBS washes, medium containing 2% FBS was added. After that, the cells were incubated at 37°C with 5% CO2. At 48 h, the samples were viewed and captured with a camera. The images were analyzed via ImageJ software (https://imagej.net/ij/index.html), and the cell migration rate was determined on the basis of the area of the scratch (S) in the image according to the following formula: Relative cell migration rate = (S0 h − drug – S24 h − drug)/(S0 h − blank – S24 h − blank) × 100% [30].
2.10. Statistical Analysis
We conducted the statistical analyses via SPSS 21 software (SPSS/PC-21, SPSS Inc., Chicago, IL, USA). The data are presented as the means ± SEMs of three independent assays (n = 3). Statistical differences were assessed by one-way or two-way ANOVA, followed by Tukey’s or Bonferroni post hoc correction. Experiments with p < 0.05 were considered to be statistically significant. The software CalcuSyn (Version 21) was used to determine the 50% inhibitory concentration (IC50) values for the RQ and RQN treatments.
3. Results
3.1. Evaluating the Cytotoxic Effects of RQ and RQN
The present study was conducted to assess the cytotoxic effects of the combination drugs rutin (R), quercetin (Q), and naringin (N) on HeLa cells via the MTT assay. The results of this study revealed that, among the combination debates, the IC50 values of RQ and RQN are lower than those of single-RQN treatments, and other combinatorial debates revealed increased cytotoxicity against cervical cancer, with a greater selectivity index than that observed in fibroblasts cells (Tables 2 and 3).
| Treatment | IC50 24 h | 48 h | 72 h |
|---|---|---|---|
| R | 72.2 | 52.3 | 39.6 |
| Q | 263.4 | 196.6 | 102.8 |
| N | 1803.5 | 1928.8 | 1501.3 |
| R-Q | 56.5–56.5 | 26.6–26.6 | 24.5–24.5 |
| R-N | 60.5–1210 | 47.5–951 | 20.8–417 |
| N-Q | 844–42.2 | 1068–53.4 | 652–32.6 |
| R-Q-N | 28.6–28.6–344 | 21.6–21.6–432 | 15.5–15.5–311 |
| Treat | 24 h |
|---|---|
| R | 1233.916 |
| N | 2056.86 |
| Q | 305.87 |
| R-Q | 233.7–233.7 |
| R-N | 530.92–1327 |
| N-Q | 412–164.88 |
| R-Q-N | 177–177–443 |
Dose—response and combination index analyses demonstrated time-dependent increases in cytotoxicity for both the RQ and RQN treatments, with synergism at lower fractional effects, as shown in Figure 1(a) and 1(b) (Table 4).
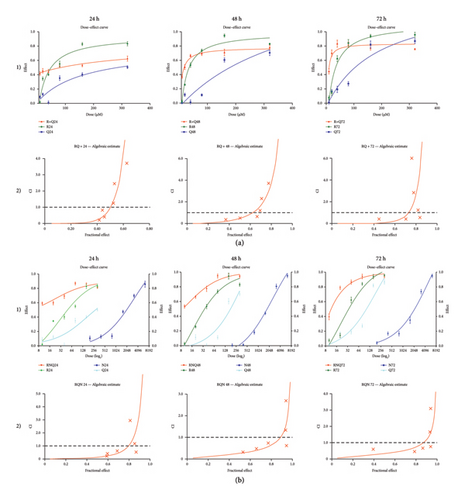
| Combination treatments | Time (h) | R&Q: 10 | 20 µM | 40 | 80 | 160 | 320 |
|---|---|---|---|---|---|---|---|
| N: 200 | 400 | 800 | 1600 | 3200 | 6400 | ||
| R-Q | 24 | 0.220 | 0.392 | 0.820 | 1.265 | 2.473 | 3.716 |
| 48 | 0.340 | 0.489 | 0.653 | 1.209 | 2.309 | 3.714 | |
| 72 | 0.407 | 0.443 | 0.575 | 1.227 | 2.848 | 6.014 | |
| R-N | 24 | 4.013 | 0.485 | 0.704 | 0.789 | 1.076 | 2.383 |
| 48 | 0.762 | 0.614 | 0.698 | 0.761 | 1.157 | 2.474 | |
| 72 | 1.101 | 0.755 | 0.654 | 0.579 | 1.210 | 2.378 | |
| N-Q | 24 | 0.537 | 0.666 | 0.445 | 0.403 | 0.523 | 1.706 |
| 48 | 1.102 | 0.656 | 0.577 | 0.831 | 0.827 | 1.579 | |
| 72 | 0.770 | 0.828 | 0.661 | 0.754 | 0.649 | 1.601 | |
| R-Q-N | 24 | 0.212 | 0.418 | 0.607 | 0.535 | 1.157 | 2.957 |
| 48 | 0.330 | 0.496 | 0.742 | 0.639 | 1.348 | 2.716 | |
| 72 | 0.630 | 0.456 | 0.663 | 0.777 | 1.671 | 3.106 | |
Values less than 1 indicate a synergistic effect of the combination, values equal to 1 indicate an additive effect, and values greater than 1 indicate an antagonistic effect.
Of these, the combination of RQN not only resulted in a greater dose response but also maintained its effect across all time points, indicating that naringin promoted the potentiation of the anticancer effects. Most importantly, this use of combinations allows for reduced concentrations of each compound, perhaps reducing the overall cytotoxic effects on normal cells. These findings indicate that the combination of RQ and RQN can have promising anticancer effects on cervical cancer and needs further investigation for therapeutic purposes. The subtoxic concentrations of RQ and RQN used in this study are shown in Table 5.
| Treatment | 24 h | 48 h | 72 h |
|---|---|---|---|
| RQ | 30-30 µM | 15-15 µM | 10-10 µM |
| RQN | 10-10-200 µM | 8-8-170 µM | 6-6-120 µM |
3.2. RQ and RQN Treatments Induce the Apoptosis of HeLa Cells
To check for the pro-apoptotic activity of the flavonoid combinations RQ and RQN in HeLa cells, flow cytometric evaluation was performed. The plots revealed a time-dependent increase in apoptosis in both treatment groups compared with the control group: RQ = 31.4 and RQN = 16.07 (Figure 2).
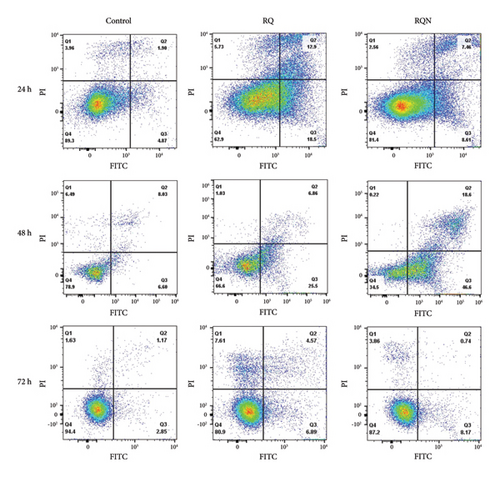
RQ treatment led to moderate induction of apoptosis (32.36%). However, at 48 h, the RQN combination consistently induced higher levels of early and late apoptosis (65.2%), where more than half of the cell population shifted to the apoptotic phase. By 72 h, while both combinations maintained apoptotic activity (not at 24 and 48 h), RQ resulted in 7.61% necrotic cells, and RQN resulted in 8.17% early apoptotic cells.
On the other hand, acridine orange/ethidium bromide (AO/EB) staining revealed distinct patterns of apoptosis and necrosis. The control cells presented predominantly green fluorescence, indicating high viability with minimal cell death. At 24 h, RQ treatment resulted in moderate increases in apoptotic and necrotic cells, with green-stained early apoptotic cells and some uniformly red-stained necrotic cells rather than RQN.
The percentage of apoptotic cells significantly increased after both treatments for 48 h, but the percentage of cells in the RQN-treated samples was greater than that in the RQ-alone samples. By 72 h, however, neither of the treatments was able to induce a greater percentage than that seen at the earlier time point, suggesting that the maximal induction of apoptosis was achieved within the 24 and 48 h timeframe (Figure 3). These observations suggest that RQ more rapidly induces apoptosis than RQN does but that RQN maintains a higher level of apoptosis at intermediate time points (48 h).
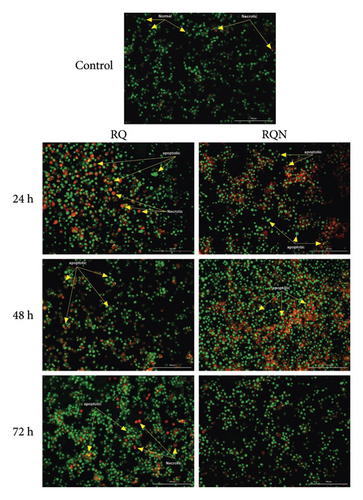
RQN treatment at this time point induced a more substantial apoptotic response, with an increased presence of orange- and red-stained cells indicative of late apoptosis. This trend intensified at 48 h, with both treatments resulting in more apoptotic cells, although RQN consistently led to a greater proportion of late apoptotic cells than RQ did.
3.3. Intracellular ROS Levels Were Increased Following RQN and RQ Treatment
To investigate ROS production, intracellular ROS levels were measured over 6, 24, 48, and 72 h via the DCF fluorescence assay and analyzed via flow cytometry (Figure 4). After 6 h, compared with those in the control group, the levels of ROS in the RQ and RQN groups significantly increased (p < 0.0001), but RQ induced the highest level of ROS production (Figure 4(a)). At 24 h, the ROS levels were greater in the RQN treatment group (p < 0.001) than in the RQ treatment group compared with those in the control group (Figure 4(b)). A trend toward a significant increase in the production of ROS was detected in the RQ-treated group at 48 h and 72 h (Figures 4(c) and 4(d)).
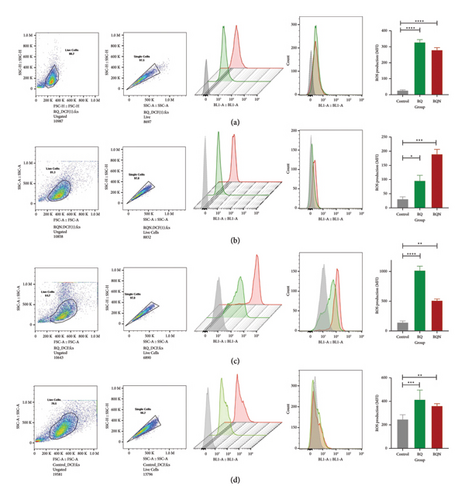
Our results also revealed a time-dependent correlation between ROS production and the induction of apoptosis in HeLa cells. For example, higher levels of ROS were present in RQ-treated samples than in control samples at 6 h post-treatment, reflecting early oxidative stress induction, which is known to trigger apoptosis. The data presented in Figure 2 indicate that the increase in apoptosis continues further in the RQ-treated group at 24 h postexposure; hence, the apoptotic action clearly occurred as a delayed response following initial ROS generation detected in the 6 h postexposure cell population.
3.4. Assessment of the Mitochondrial Membrane Potential (Δψm)
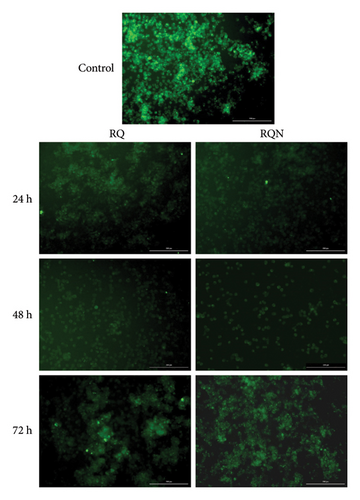
The effects of the combination of RQ and RQN on the Δψm of the mitochondrial membrane potential in HeLa cells were analyzed via Rhodamine 123 staining. Strong Rh123 fluorescence, indicating intact mitochondrial membrane potential, was observed in the control group. In contrast, a moderate decrease in fluorescence at 24, 48, and 72 h was induced by the combination of the drug RQ, resulting in gradual depolarization of the mitochondrial membrane potential. Notably, there was a greater decrease in Rh123 fluorescence, especially at 48 h, with the combination of RQN, reflecting a more pronounced disruption of the Δψm associated with enhanced mitochondrial depolarization (Figure 5).
3.5. Inhibition of Cell Migration by RQ and RQN Treatment
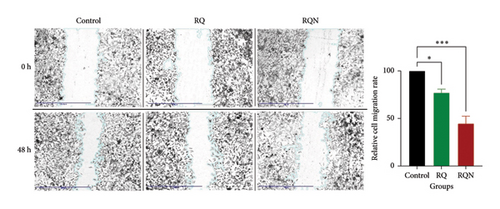
The wound healing assay results suggested that, compared with the untreated control, the RQ and RQN treatments hindered the migratory properties of the HeLa cells. Among the control cells, the wounds were almost occluded at 48 h postscratch, indicating that the degree of cell migration was high. On the other hand, the RQ-treated cells migrated at a lower rate and thus showed only partial occlusion of the wound. Furthermore, compared with no treatment, RQN treatment reduced cell migration, with a notably larger residual wound area after 48 h. This finding was confirmed below, as the relative cell migration rates in the RQ and RQN groups were significantly lower than those in the control group at p < 0.05 (RQ) and p < 0.001 (RQN), respectively. The results revealed that under both treatments, while reducing cell migration, RQN had a much stronger inhibitory effect than RQ did (Figure 6).
3.6. RQ and RQN Modulate Autophagy Through Differential Regulation of Beclin1, P62, and LC3
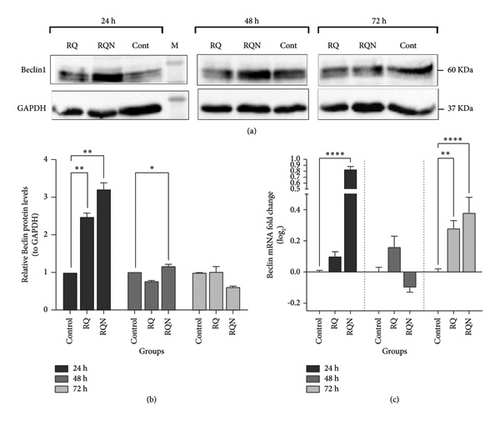
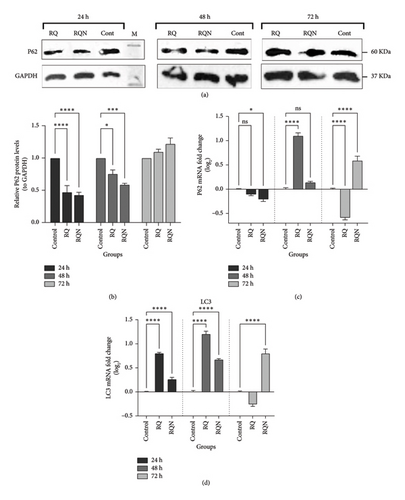
The expression of the autophagy markers Beclin1, P62, and LC3 was determined by Western blotting and real-time PCR in HeLa cells treated with RQ and RQN. Both the mRNA and protein levels of Beclin1 were significantly increased after the treatment of HeLa cells with RQN, specifically 24 h after the treatment. Beclin1 protein and mRNA levels were significantly greater in RQN-treated cells at 24 h than in RQ-treated and control cells, whereas at 72 h, the levels decreased. In contrast, Beclin1 expression was weakly affected by RQ at these time points. As shown in Figure 7, these results show that RQN transiently, but significantly, upregulates Beclin1, which reflects increased autophagic activity in the early phase after treatment. The protein levels of the autophagy-related protein P62 and the mRNA expression of LC3 were examined in HeLa cells treated for 24, 48, and 72 h with either RQ or RQN. Western blot analysis revealed that P62 protein expression in both the RQ and RQN groups was significantly lower than that in the control group, with the most pronounced effect occurring at 24 h (p < 0.0001) (Figures 8(a) and 8(b)). RT-PCR data revealed consistent downregulation of P62 mRNA levels in RQ- and RQN-treated cells at all the considered times, although RQN alone transiently upregulated P62 expression at 72 h (p < 0.05) (Figure 8(c)). LC3 mRNA expression was highly upregulated in both RQ- and RQN-treated cells, which is characteristic of the induction of autophagy, compared with the control. RQN caused a greater increase in LC3 expression at 24 and 48 h, indicating its stronger autophagic effect (p < 0.0001) (Figure 8(d)). These results suggest that RQ and RQN modulate autophagy through the upregulation of Beclin1 protein expression, the expression of LC3, and the downregulation of P62 protein expression. RQN resulted in a greater and more sustained increase in autophagic activity.
4. Discussion
In the present study, the combination of RQ (rutin plus quercetin) and RQN (rutin plus quercetin and naringin) with flavonoids had a critical effect on the viability, production of reactive oxygen species (ROS), apoptosis, migration, and autophagy of HeLa cells. The RQN treatment regularly resulted in the induction of higher ROS levels than was caused by RQ alone, which is proof of its involvement in ROS-mediated pathways. Both the RQ and RQN treatments had time-dependent effects on cell viability, with increased numbers of apoptotic and necrotic cells, especially at earlier times. Scratch assays revealed that RQ and RQN inhibited the migration of cells, with RQN exerting a more powerful inhibitory effect. Moreover, Western blot and real-time PCR analyses revealed that RQN significantly upregulated Beclin1 (protein and expression) and LC3 (expression) and decreased P62 (protein and expression) levels at early stages of treatment.
Previous studies have indicated that naringin suppresses the proliferation of cells and induces the apoptosis of tumor cells, including those in TNBC. Its proapoptotic effect on TNBC cells is due to cell cycle arrest, leading to a decline in cell survival with the resulting suppression of tumor growth [31]. Experiments involving naringin and doxorubicin (dox) both in vitro and in vivo in combination with HeLa cells demonstrated the growth inhibition of a tumor and an increase in apoptosis [32]. A study on the therapeutic effect of naringin in human cervical cancer cells revealed 50% inhibition at 750 μM, with apoptosis induced above 2000 μM. Naringin caused DNA fragmentation, morphological changes, and a reduction in the mitochondrial potential in a dose-dependent manner [33]. In this context, the present study revealed that naringin combined with low-dose RQN caused an increase in intracellular ROS and apoptosis and a decrease in the mitochondrial membrane potential, and one study tested the effects of 20 μg/mL rutin–fucoidan (Ru-Fu) complex on HeLa cells after 24 h. They reported that the Ru–Fu complex stimulated proliferation and caused mitochondrial membrane depolarization, as indicated by Rh123 staining. Compared with rutin (25%), fucoidan (21%), or their mixture (27%), rutin (25%), rutin (21%), or a mixture of both also increased intracellular ROS levels and apoptosis, resulting in a greater apoptosis rate (33%) [34]. The rutin–zinc (II) complex modulates the mitochondrial membrane potential and the expression of genes related to cell cycle progression, angiogenesis, and apoptosis in vitro in an Ehrlich ascites carcinoma model but is not cytotoxic to normal cells in vitro [35]. HeLa cancer cells were incubated with selected doses of rutin (80, 120, and 160 μM) for 24 h. Compared with untreated cells, rutin-treated cells were more prone to apoptosis [36]. Studies have also shown that the combination of quercetin with other flavonoids synergistically induces apoptosis via condensation and fragmentation of chromatin in various cancer cells [37, 38]. According to the findings of quercetin treatment at concentrations of 40, 80, and 120 μM in human cervical cancer cells in vitro for 24 h, there was a statistically significant increase in apoptosis compared with that of the untreated control, with observed apoptosis rates as follows: 40 μM: 21%;80 μM: 32%; and 120 μM: 47% [39]. In the present study, quercetin in combination with RQ at a concentration of 56.5 μM resulted in 31.4% apoptosis after 24 h. In the RQN combination, where quercetin was used at 28.6 μM, 16% of the cells were apoptotic after 24 h. On the basis of these findings, quercetin in combination with RQ and RQN, even at lower concentrations, resulted in a greater percentage of apoptosis. In line with these findings, our study also revealed apoptosis in HeLa cells treated with combinations of rutin such as RQ and RQN at lower doses of 56.5 and 28.6 μM over a 24 h period. A dose of 40 μM quercetin increased apoptosis in SAS cells, which was greater at 48 h than at 24 h. Quercetin significantly increased the ROS levels after 3 h, reduced the ΔΨm of the mitochondrial membrane potential after 24 h, and increased Ca2+ production after 24 h [40]. In this regard, in the present study, quercetin, when combined with rutin and quercetin (RQ and RQN), caused higher apoptosis rates at 48 h than at 24 h in HeLa cells. This finding agreed with the results of Ma et al. and thus demonstrated that the levels of ROS increased over time in HeLa cells treated with RQ and RQN. As expected and in agreement with previous studies, the elevation of Beclin1 and LC3 protein expression with the concomitant decrease in P62 levels points toward the induction of autophagy upon treatment with these flavonoid combinations. Moreover, flavonoids can promote autophagy via the upregulation of Beclin1. Furthermore, following flavonoid treatment, activated autophagy may simultaneously regulate cell growth, proliferation, apoptosis, necrosis, and cell migration [41, 42]. The increased expression of Beclin1 at all time points indeed reflects that these treatments stimulate the initiation of the autophagic process through the induction of autophagosome formation and also confirmed this induction of autophagy in HeLa cells. More importantly, the subsequent decrease in the expression of P62, an autophagic protein targeted for degradation during this process, further confirmed the induction of successful autophagic flux [43]. These results are in concert with work showing that autophagy plays a role in regulating the survival and death of cancer cells.
On the other hand, interestingly, our results revealed evident effects, especially at 48 and 72 h, for both the RQ and RQN combinations, which suggests a time-dependent increase in autophagy [44]. This temporal increase in the expression of autophagic markers could provide evidence that longer exposure to such flavonoid combinations prolongs their therapeutic efficacy by sustaining their autophagic activity [45]. Moreover, the slightly but consistently greater expression of Beclin1 detected in RQNs than in RQs further suggests that naringin increases the autophagic response through synergistic mechanisms involving several bioactive compounds [46]. Real-time PCR data also confirmed parallel changes in the mRNA levels of Beclin1, LC3, and P62 at the molecular level, confirming the Western blot results [43]. These transcriptional changes highlight the strong impact of these flavonoids on not only autophagy regulation but also cancer cell death and indicate that flavonoid combinations are potent inducers of autophagy-mediated cancer therapy [47].
In summary, our study demonstrated that RQ and RQN exert different effects on oxidative stress, autophagy, cell migration, and cell death in HeLa cells. RQN strongly but transiently enhanced the production of ROS and autophagic activity while potently suppressing cell migration. Both RQ and RQN elicited time-dependent apoptosis and necrosis in HeLa cells. All the findings so far suggest that RQ and RQN are also likely to enhance the state of oxidative stress while modifying cell survival pathways due to important implications for therapeutic design. Further studies have to be done in relation to elaborating on the exact mechanism concerned and also validating their use both in vitro and in vivo models.
Conflicts of Interest
The authors declare no conflicts of interest.
Funding
This work was supported by Babol Noshirvani University of Technology through research Grant Number: BNUT/975919029/1400.
Acknowledgments
This work is part of the Ph.D. thesis of Dr. Sara Goharpour Nazari in Chemical Engineering.
Open Research
Data Availability Statement
The data used to support the findings of this study are available from the corresponding author upon reasonable request.


