Characterization of Microbial Community Succession and Flavor Formation During Fermentation in Chinese Northern Strong-Flavor Daqu
Abstract
The aroma of strong-flavor Daqu is a key quality indicator, but its aroma components remain incompletely understood. These compounds stem from microbial metabolism, yet research on northern strong-flavor Daqu microbiota remains scarce. This study utilized physicochemical analyses, gas chromatography-olfactometry-mass spectrometry (GC-O-MS) detection, and Illumina high-throughput sequencing to comprehensively investigate the fermentation process of northern strong-flavor Daqu. Results indicated that both the diversity and contents of volatile compounds increased during fermentation, generating nutty, woody, and roasted aroma notes. A total of 105 volatile substances were identified, of which 21 were identified as the key aroma-active compounds, including ethyl hexanoate, hexanal, and 2,3,5-trimethylpyrazine. Dominant microbial genera identified during Daqu fermentation include Weissella, Lactobacillus, Leuconostoc, Thermoascus, Aspergillus, and Wickerhamomyces. Furthermore, Kroppenstedtia, Saccharopolyspora, Thermoactinomyces, Thermoascus, Aspergillus, Rhizomucor, and Thermomyces emerged as key microorganisms influencing the aroma profile of Daqu. These findings provide a theoretical foundation for quality optimization and standardized production of strong-flavor Daqu.
1. Introduction
Baijiu, a Chinese national liquor, stands among the world’s top six distilled spirits, boasting a rich history spanning over 2000 years [1]. The strong-flavor baijiu, categorized among the four major flavor styles, exhibits a potent aroma, sweet and refreshing taste, and a lingering aftertaste. Currently, it holds the position of the most produced and sold variety of baijiu [2]. The geographical origins divide strong-flavor baijiu into the Sichuan, Jianghuai, and northern categories, each offering distinct characteristics in aroma and taste [3].
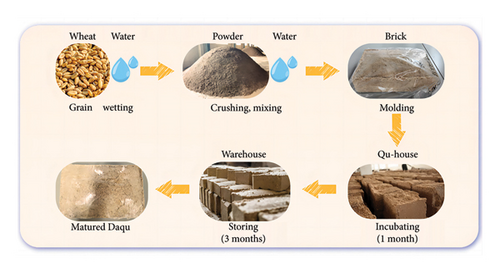
Daqu is a crucial saccharification fermentation agent in the production of baijiu, which utilizes wheat as the primary fermentation raw material [4]. The manufacturing process of Daqu encompasses a series of steps, including grain wetting; crushing; mixing with water; molding; natural fermentation within a Qu house, namely, a cultivation chamber, for approximately 30 days; turning; storage in a warehouse; and finally, the formation of the matured Daqu (Figure 1). The stacking arrangement of Daqu bricks leads to uneven heat distribution within the mass, with the central region experiencing faster heating compared to the periphery, resulting in disparate fermentation temperatures across different sections of Daqu stored in the same Qu house. To address this issue, seasoned workers will control the changes of the temperature and moisture content of Daqu through 3∼5 times of manual turning Daqu and opening and closing of windows and doors during the fermentation period. These practices are aimed at enhancing the uniformity of Daqu quality and fostering the proliferation of beneficial microorganisms [5, 6]. There is a wide variety of strains of microorganisms in Daqu, including bacteria, molds, yeast, and actinomycetes, with 9%–27% of the bacterial population and 61%–80% of fungi found in fermented grains originating from Daqu [7, 8]. These microorganisms are not only involved in the fermentation of baijiu but also provide abundant enzymes for the degradation of starch and the production of flavor compounds [9]. The amount of intensely strong-flavor Daqu added is about 20% of the raw material, and the metabolites produced during the fermentation process of Daqu will also directly or indirectly enter in the baijiu, which in turn affects the quality and style of baijiu [10]. Therefore, microbial communities and flavor substances in strong-flavor Daqu represent crucial factors influencing the quality of baijiu.
In the actual production of Daqu, the maturity of fermentation is assessed using sensory (olfactory examination and visual observation) and physicochemical indexes. This allows for timely adjustments to fermentation parameters, ensuring high-quality Daqu. Evaluation of Daqu aroma relies primarily on human olfaction, which is subjective and impacts Daqu stability and quality. Volatile compounds are the main contributors to the aroma of Daqu, shaped by microorganisms under specific environmental conditions. Currently, high-throughput sequencing combined with gas chromatography-mass spectrometry (GC-MS) and other methods are widely used to analyze dynamic changes in physicochemical properties, microbiota, and volatile compounds and their interactions during the fermentation of strong-flavor Daqu in the Sichuan and Jianghuai regions. These studies have revealed correlations such as acidity with Lactobacillus, saccharification power with Aspergillus, Rhizomucor, Rasamsonia, and Thermoascus, and esterification and fermentation power with the abundance of Wickerhamomyces [11]. Furthermore, a positive correlation has been observed between the relative abundance of Thermoascus and the levels of ethanol and ethyl oleate. Similarly, changes in 2,3-butanediol content correlate positively with variations in Bacillus abundance [12]. These discoveries aid in regulating functional microorganisms in Daqu, thereby enhancing its stability and quality. However, these findings may not be entirely applicable to the northern strong-flavor Daqu, while fewer studies have combined multiomics to analyze its fermentation process. Additionally, not all volatile compounds contribute to Daqu flavor but also gas chromatography-olfactometry-mass spectrometry (GC-O-MS) can be used to identify aroma compounds that contribute. The aroma compounds in Daqu and the microorganisms influencing their formation remain unknown.
This study employed a combination of physicochemical analyses, GC-O-MS detection, and Illumina high-throughput sequencing to reveal the dynamic changes in microbial communities, physicochemical properties, and aroma compounds, as well as their correlations during the fermentation of northern strong-flavor Daqu. Additionally, the study explored the differences between northern strong-flavor Daqu and that from the Sichuan and Jianghuai regions. These findings will provide a scientific foundation for further understanding the mechanisms behind the formation of aroma substances in strong-flavor Daqu fermentation. They will also help in assessing and enhancing Daqu quality, as well as gaining insights into the intrinsic mechanisms underlying regional differences in strong-flavor baijiu.
2. Materials and Methods
2.1. Sampling
Strong-flavor Daqu samples were collected between May and June 2023 from Shandong Bandaojing Co., Ltd. located in Shandong, China (35°55′∼37°17′ northern latitude, 117°32′∼118°31′ east longitude). The samples were taken from five different sites within the same incubating room and combined to form one sample. Sampling occurred on Days 0, 2 (first turning over the Daqu), 8 (second turning over the Daqu), 12 (third turning over the Daqu), 16 (fourth turning over the Daqu), and 31, respectively. The aseptic sealed sampling bags containing the samples were put into a dry ice heat preservation box and transported to the laboratory. The samples were stored at −20°C for physicochemical property and volatile metabolite analysis, and at −80°C for DNA extraction.
2.2. Analysis of Physiochemical Properties
The monitoring of temperature and humidity within the Qu house during Daqu fermentation was conducted utilizing a thermohygrometer. The samples were dried at 105°C until constant weight, and the moisture content was measured based on the difference in mass before and after drying. Total acidity was quantified employing a standard 0.1 mol/L NaOH solution, titrated until the final pH reached 8.2. To ascertain the pH ratio of the sample, deionized water was employed at a concentration of 1 : 20 (w/v) [13].
2.3. Identification and Semiquantification of Volatile Metabolites
The analysis of volatile compounds was conducted employing the headspace solid-phase microextraction gas chromatography-mass spectrometry (HS-SPME-GC-MS) methodology. Each headspace vial contained 1.5 g of Daqu samples, and 10 μL of three internal standards (amyl acetate, 4-octanol, 2-ethylbutyric acid) were spiked into each sample, resulting in a final concentration of 666.7 ng/g. The vials were covered, sealed, and equilibrated at 50°C for 20 min. The 50/30 μm DVB/CAR/PDMS fiber, with a tip positioned above the sample, underwent extraction at 50°C for 40 min and was subsequently resolved using a gas chromatography injector at 250°C for 5 min. Analysis was performed on a DB-FFAP capillary column (60 m × 0.25 mm × 0.25 μm, Agilent Technologies, Santa Clara, CA, USA) with high-purity helium (≥ 99.999%) serving as the carrier gas at a flow rate of 1 mL/min. The oven temperature profile initiated at 40°C and was maintained for 3 min, ramped to 90°C at a rate of 5°C/min with a 2-min hold, increased to 150°C at a rate of 2°C/min with another 2 min hold, and ultimately raised to 230°C at a rate of 15°C/min, followed by a 10-min hold. The transfer line maintained a temperature of 250°C, and the ion source of the mass spectrometer was set to 230°C. The electron collision ionization energy was 70 eV, with the acquisition range spanning the mass-to-charge ratio (m/z) from 45 to 450 amu. Injection was performed in splitless mode.
Each sample was tested in triplicate, with volatile compounds identified using the NIST (2020) spectral library and retention index (RI). RIs were determined by employing n-alkanes (C8–C40) under the same GC-MS conditions as the samples. The content of each compound was calculated by multiplying the ratio of its chromatographic peak area to that of the internal standard by the concentration of the internal standard.
2.4. Identification of Aroma Compounds and Odor Activity Value (OAV)
The analysis of potential aroma-active compounds was conducted utilizing headspace solid-phase microextraction-gas chromatography-olfactometry-mass spectrometry (HS-SPME-GC-O-MS). The chromatographic column employed was a polar DB-WAX column (60 m × 0.25 mm × 0.25 μm; Agilent Technologies, Santa Clara, CA), and the rest of the parameter conditions were the same as described in Section 2.3. Three experienced evaluators (one male and two females) were selected for gas chromatography-olfactometry (GC-O) analysis, with an average age of 25. Each member underwent three weeks of sensory training, four times a week for one hour each time, during which they sniffed at least 30 standard compounds with aromas to ensure that they had a consistent understanding of the aroma characteristic and intensity of the Daqu prior to the formal experiments. During the GC run, evaluators were instructed to position their noses at the sniffing ports, documenting the retention time, aroma characteristics, and intensity of detected odors. Intensity ratings ranged from 0 to 4, with 0 indicating no aroma intensity, 1 indicating weak aroma intensity, 2 indicating medium aroma intensity, 3 representing significant aroma intensity, and 4 indicating extremely strong aroma intensity [14]. In addition to comparing the RI of the standards and the information from the mass spectral library, consistency between the perceived odor characteristics and those of standard odors was considered to identify the same substance. Based on the quantitative results of the volatile metabolite, the OAV value of the aroma compound is calculated with reference to the threshold value of the substance in water [15].
2.5. DNA Extraction, Polymerase Chain Reaction (PCR) Amplification, and Illumina MiSeq Sequencing
Total DNA extraction from Daqu samples was executed utilizing the MagAttract PowerSoil Pro DNA Kit (Qiagen, Hilden, Germany) following the manufacturer’s instructions. The quality and concentration of the extracted DNA were assessed through 1.0% agarose gel electrophoresis and a NanoDrop ND-2000 spectrophotometer (Thermo Scientific Inc., USA). PCR amplification was conducted utilizing a GeneAmp 9700 instrument (ABI, Carlsbad, CA, USA). Bacteria were amplified using primers 338 F and 806 R for the V3-V4 highly variable region of the 16 s rRNA gene. For fungi, the internal transcribed spacer (ITS) region was amplified with primers ITS1F and ITS2R. Subsequently, the PCR products underwent purification and qualification before submission to Shanghai Majorbio Bio-Pharm Technology Co., Ltd (China). Sequencing was carried out on the MiSeq platform of an Illumina high-throughput sequencer (Illumina, San Diego, CA, USA).
2.6. Sequence Optimization and Annotations
The double-ended raw sequencing sequences were quality controlled using Fastp 0.19.6 (https://github.com/OpenGene/fastp) and spliced using Flash 1.2.11 (https://ccb.jhu.edu/software/FLASH/index.shtml). Subsequently, the optimized sequences underwent clustering into operational taxonomic units (OTUs) utilizing UPARSE 7.1 with a 97% sequence similarity threshold, and chimeric sequences were identified and eliminated. Taxonomic classification of representative OTU sequences was conducted using the RDP classifier 2.13 (https://sourceforge.net/projects/rdp-classifier/) with a confidence threshold set at 0.7. The utilized databases included the Silva Bacterial 16S rRNA database (https://www.arb-silva.de, Version 138) and the Unite Fungi ITS rRNA database (https://unite.ut.ee/, Version 8.0).
2.7. Data Analysis
The calculation of α diversity indices was performed using Mothur 1.30.2 (https://mothur.org/wiki/calculators/). Statistical comparisons of differences in α diversity indices among groups were conducted through one-factor analysis of variance (ANOVA) utilizing SPSS 22.0. Microbial community composition was visually represented using Circos-0.67-7 (https://circos.ca/) in conjunction with the R language. Intergroup differences in the microbial community were analyzed using principal coordinate analysis (PCoA) based on the Bray–Curtis matrix. Microbial interactions were analyzed by calculating Spearman’s rank correlations. Correlations with |ρ| > 0.7 and p < 0.05 were visualized as a co-occurrence network. Redundancy analysis (RDA) and Spearman correlation analysis were employed to discern correlations between physicochemical properties and bacterial or fungal genera. A correlation network diagram was constructed to explore relationships between microbial genera and volatile metabolites using Cytoscape 3.10.1.
3. Results
3.1. Physicochemical Properties During Daqu Fermentation
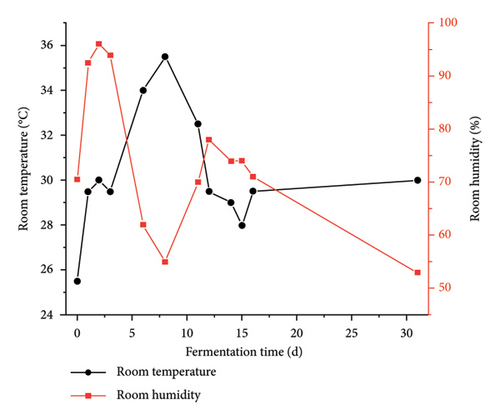
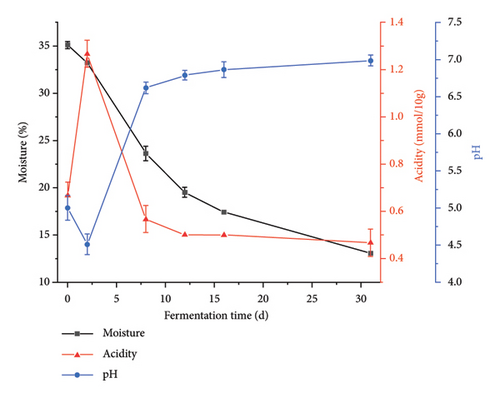
The room temperature exhibited a gradual increase over time, peaked, and subsequently underwent a slow descent before stabilizing. Similarly, room humidity initially rose, then experienced a gradual decline, rose again, before tapering off to a level of 53% (Figure 2(a)). The water content of Daqu exhibited a continuous decrease throughout the fermentation process. Particularly, a rapid decline occurred within the initial 12 days, followed by a moderated descent over the subsequent 19 days, ultimately settling at 13%. The acidity of the Daqu displayed a discernible ascent succeeded by a reduction, culminating in stabilization (Figure 2(b)). A significant negative correlation was observed between acidity and pH (Spearman’s ρ = −0.941, p = 0.005).
3.2. Volatile Metabolites During Daqu Fermentation
The HS-SPME-GC-MS methodology, in conjunction with RIs, was utilized for the identification and quantification of volatile compounds present in Daqu samples across various fermentation stages. A total of 105 volatile compounds were detected, comprising 33 esters, 16 alcohols, 11 acids, 18 aldehydes, four ketones, seven nitrogen compounds, one sulfur compound, six heterocyclic compounds, and nine other compounds (Table S1, Figure 3(c)). The total content of the compounds increased from the initial 60331.27 ng/g to the final 371881.84 ng/g during Daqu fermentation, which is about a five-fold increase, and the number of species increased from 58 to 65.
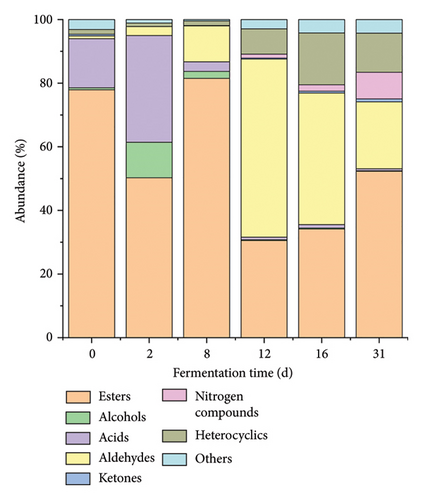
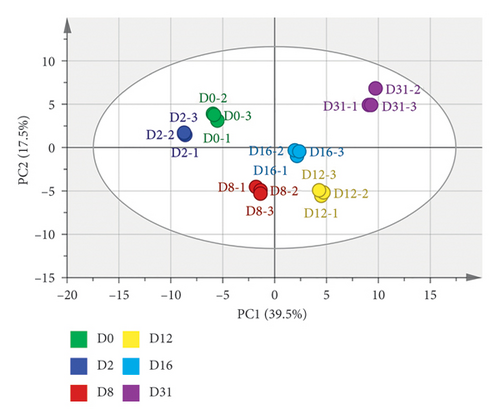
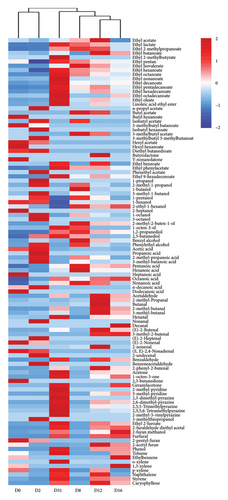
The dominance of esters and acids in volatile compounds was noted on Days 0 and 2, shifting to esters and aldehydes predominance after Day 8 (Figure 3(a)). The thermogram of volatile compounds illustrated significant changes in the content of each compound throughout Daqu fermentation (Figure 3(c)). Principal component analysis (PCA), an unsupervised multivariate statistical analysis technique, was employed to assess sample regularity and variability based on the contribution of principal components (PC) among different samples. The PCA results for volatile compounds in samples at various fermentation times are depicted in Figure 3(b), with a cumulative variance contribution of 57% for PC1 (39.5%) and PC2 (17.5%). The scatter distributions within sample groups exhibited clustering, indicating good intragroup repeatability and similarity in sample data. Conversely, the intergroup distribution showed greater dispersion, suggesting significant variation in volatile compounds throughout the Daqu fermentation process. Based on PCA analysis and clustering analysis, Daqu samples were classified into three categories: early (D0 and D2), middle (D8, D12, and D16), and late (D31).
3.3. Aroma-Active Compounds During Daqu Fermentation
GC-O-MS analysis was employed to examine the variations in aroma-active compounds during the fermentation process of the Daqu. A total of 32 aroma-active compounds were identified through mass spectrometry, RI, and odor description, as detailed in Table S2. The compound concentrations alone did not adequately reflect their impact on the overall flavor of the samples. Therefore, in conjunction with the quantitative analysis, OAVs were calculated, considering the threshold values of the compounds to assess their effects on the overall flavor. Out of the 32 compounds, only 21 had OAVs ≥ 1, making a more significant contribution to the overall aroma of Daqu and designating them as key aroma-active substances (Table 1). Among these, nine were esters, six were aldehydes and ketones, two were alcohols, two were nitrogen compounds, one was acid, and one was heterocyclic.
| Aroma compounds | CAS | Odor threshold (ng/g) | OAV | Descriptor | |||||
|---|---|---|---|---|---|---|---|---|---|
| D0 | D2 | D8 | D12 | D16 | D31 | ||||
| 2-methyl-propanal | 78-84-2 | 1.90 | — | 6.84 | 7.39 | 113.10 | 42.36 | — | Herbal, malt |
| Butanal | 123-72-8 | 2.20 | — | — | 24.79 | 497.11 | 58.59 | — | Banana |
| 3-methylbutyraldehyde | 590-86-3 | 1.20 | 40.55 | 103.89 | 54.02 | 688.55 | 306.36 | 173.46 | Fruity, green |
| Ethyl 2-methylpropanoate | 97-62-1 | 0.22 | 264.83 | 334.29 | 7245.40 | 6522.38 | 3015.52 | 5414.04 | Fruity |
| 2,3-butanedione | 431-03-8 | 2.90 | 47.46 | — | — | — | — | — | Cheese |
| Ethyl butyrate | 105-54-4 | 3.00 | 41.59 | 21.29 | — | 241.12 | 121.46 | 72.01 | Fruity, sweet |
| Ethyl 2-methylbutyrate | 7452-79-1 | 0.06 | 429.61 | 650.94 | — | — | — | 24304.33 | Fruity |
| Ethyl isovalerate | 108-64-5 | 0.11 | 232.40 | 216.22 | 10337.53 | 5711.27 | 3382.24 | 3404.86 | Fruity, sweet |
| Hexanal | 66-25-1 | 73.00 | 2.53 | 2.02 | < 1 | 5.82 | 5.23 | 14.82 | Apple, green |
| Isoamyl acetate | 123-92-2 | 0.15 | 427.54 | — | 3649.41 | 2104.94 | — | — | Fruity, sweet |
| Ethyl valerate | 539-82-2 | 5.80 | 1582.15 | 264.94 | 1964.68 | 1643.51 | 1464.99 | 2362.42 | Fruity, sweet |
| 3-methyl-1-butanol | 123-51-3 | 4.00 | 9.38 | 594.67 | 163.20 | 68.45 | 22.68 | 5.01 | Burnt, floral, malt |
| Ethyl hexanoate | 123-66-0 | 5.00 | 4474.28 | 653.47 | 9146.39 | 7972.20 | 6589.93 | 12643.23 | Fruity, sweet |
| 1-octen-3-one | 4312-99-6 | 0.04 | — | — | 515.08 | 3221.60 | 6257.72 | 9922.50 | Earth, mushroom |
| 2,3,5-trimethyl pyrazine | 14667-55-1 | 350.12 | — | — | — | 5.35 | 3.50 | 18.93 | Nut, coffee, roasted |
| Ethyl octanoate | 106-32-1 | 19.30 | 26.81 | 23.32 | 165.78 | 121.39 | 95.77 | 250.34 | Fruity |
| Furfural | 98-01-1 | 9562.00 | < 1 | < 1 | < 1 | 1.08 | 1.17 | 1.17 | Sweet, toasted, woody |
| 2,3,5,6-tetramethyl pyrazine | 1124-11-4 | 2525.02 | — | — | — | < 1 | < 1 | 3.29 | Nut |
| Ethyl nonanoate | 123-29-5 | 377.00 | — | < 1 | 1.42 | 1.90 | 2.33 | 11.07 | Fruity, rose |
| 3-methyl-butanoic acid | 503-74-2 | 490.00 | < 1 | 1.70 | < 1 | < 1 | < 1 | < 1 | Rancid |
| Phenylethyl alcohol | 60-12-8 | 564.23 | < 1 | 1.94 | 1.61 | < 1 | < 1 | < 1 | Rose |
- Note: “—” means not detected. Odor threshold were taken from [16]. OAV: OAVs were calculated by dividing the concentration by the respective odor threshold.
Esters were consistently present throughout the fermentation of the Daqu, imparting fruity and floral aromas. Notably, variations in aroma compounds were observed at different fermentation times. In the early stages (D0 and D2), the aroma profile was influenced by compounds such as 3-methylbutyraldehyde, 2,3-butanedione, hexanal, and 3-methylbutanol, contributing grassy, creamy, and malty aromas. Mid-fermentation (D8, D12, and D16) featured a grassy, malty, toasted, and mushroomy aroma, attributed to compounds such as 2-methylpropanal, hexanal, butanal, 3-methylbutanal, 1-octen-3-one, and 3-methylbutanol. In the later stages (D31), the aroma profile included compounds such as 3-methylbutyraldehyde, hexanal, 3-methylbutanol, 1-octen-3-one, 2,3,5-trimethylpyrazine, and 2,3,5,6-tetramethylpyrazine, contributing a grassy, malty, nut, woody, and roasted aroma to the Daqu.
3.4. Microbial Community Abundance and Diversity During Daqu Fermentation
Following the quality control process for raw sequences, the clean sequences of bacteria and fungi were randomly subsampled to 51,465 and 42,265 sequences, respectively, for subsequent α diversity analysis. Chao1, ACE, Shannon, and Simpson diversity indices were employed to assess the overall microbial abundance and diversity of Daqu samples (Table S3). The diversity and abundance of fungi decreased first and then increased, and there was no significant change between the beginning and the end of fermentation (p > 0.05). Specifically, lower fungal diversity was identified on the eighth and 16th days based on the Shannon index and Simpson index. The Chao index and ACE index indicated the lowest fungal richness on the second day. In contrast, bacterial diversity and richness displayed an initial increase followed by a tendency to stabilize, ultimately resulting in significantly higher levels at the end of fermentation compared to the commencement (p < 0.05). Throughout the entire fermentation process, bacterial diversity and abundance consistently surpassed those of fungi, indicating more active bacterial growth. The good coverage rate for each sample exceeded 99% (Table S3), and the dilution curve approached a plateau in the final stage, signifying sufficient sequencing depth capable of accurately reflecting the microbial composition in the sample (Figure S1).
3.5. Microbial Community Composition and Succession During Daqu Fermentation
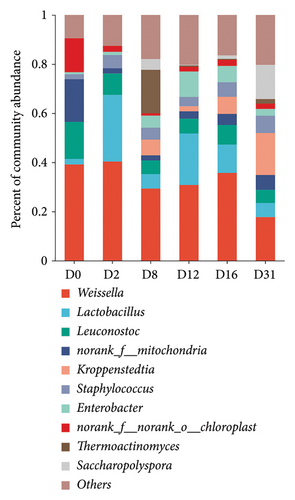
The predominant bacterial phyla (relative abundance > 1%) identified in Daqu included Firmicutes, Cyanobacteria, Proteobacteria, and Actinobacteria, with Firmicutes dominating the microbial composition (Figure S2A). Major bacterial genera consisted of Weissella, Lactobacillus, Leuconostoc, Kroppenstedtia, Staphylococcus, and Enterobacter (Figure 4(a)). The genus Weissella exhibited a fluctuating downward trend, with its relative abundance decreasing from 38.2% to 19.7%. Lactobacillus, Leuconostoc, Staphylococcus, and Enterobacter maintained relatively stable abundances throughout the entire fermentation process, ranging from 2.3% to 19.5%, 5.0% to 16.5%, 2.0% to 9.0%, and 0.8% to 8.4%, respectively. The relative abundance of Kroppenstedtia was initially less than 1% in the first 2 days and gradually increased, reaching 20.9% by the end of fermentation.
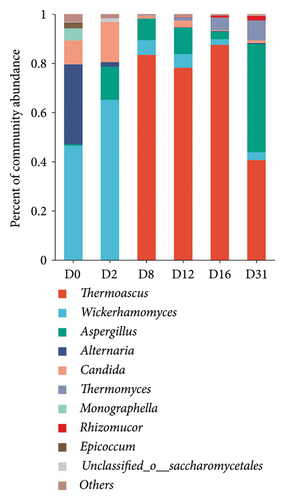
Major fungal phyla (relative abundance > 1%) encompassed Ascomycetes and Trichoderma, with Ascomycetes representing the dominant proportion (Figure S2B). Key fungal genera included Thermoascus, Wickerhamomyces, Aspergillus, Alternaria, Candida, and Thermomyces (Figure 4(b)). On day 0, the fungal community was primarily dominated by Wickerhamomyces (46.4%) and Alternaria (32.5%). Day 2 saw dominance by Wickerhamomyces (65.1%) and Candida (16.2%). During the middle stages of fermentation (D8, D12, and D16), Thermoascus became the dominant fungal genus, constituting more than 78.1%. In the late fermentation stage (D31), Thermoascus (40.6%) and Aspergillus (44.0%) were the dominant fungal genera.
3.6. The Compositional Differences and Interactions of Microbial Community During Daqu Fermentation
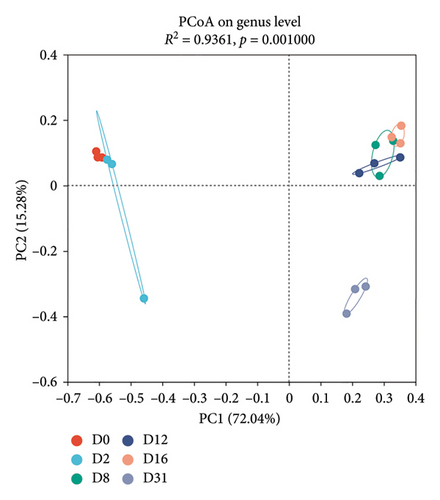
The results of PCoA indicated notable temporal succession patterns in both the bacterial community structure (Adonis, R2 = 0.6188, p = 0.001, Figure 5(a)) and the fungal community structure (Adonis, R2 = 0.9361, p = 0.001, Figure 5(b)). The cumulative contribution of the first two principal coordinates for bacterial and fungal communities was 62.72% and 87.32%, respectively. Closer distance between samples indicated greater similarity in community structure. Bacterial community structure was significantly different on Days 0 and 31 compared to other sampling times, with samples from Days 2, 8, 12, and 16 clustered together, except for one sample from Day 8. Fungal communities clustered in the early, middle, and late stages of fermentation, respectively.

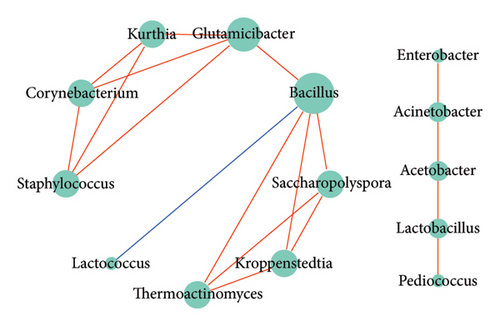
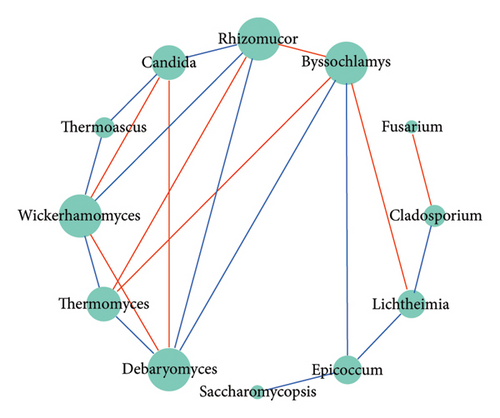
The bacterial correlation network graph (Figure 5(c)) portrayed 14 nodes (genera) and 18 edges (intergeneric relationships). Positive correlations were exhibited between most bacterial genera (indicated by red lines), while Lactococcus and Bacillus showed a negative correlation (indicated by blue lines). The fungal correlation network graph (Figure 5(d)) depicted 12 nodes and 20 edges, with 12 edges indicating negative correlations and eight indicating positive correlations.
3.7. Main Microbial Genera of Daqu and Correlation Analysis of Physicochemical Properties
RDA1 and RDA2 axes elucidated 49.31% and 84.66% of the variation in bacterial or fungal community differentiation (Figures 6(a), 6(b)), signifying a correlation between microbial communities and physicochemical factors. Noteworthy correlations were identified between bacterial community succession and moisture content, room temperature, and room humidity. Fungal community succession exhibited significant correlations with moisture content, acidity, and room humidity (Table S4).
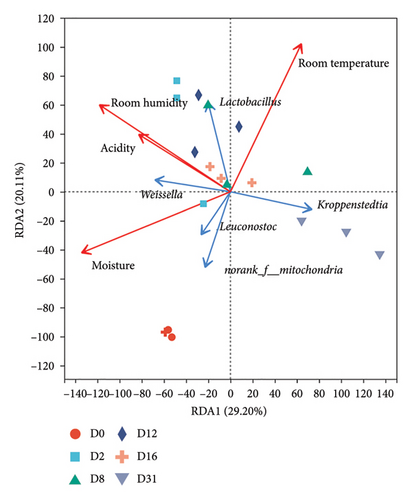
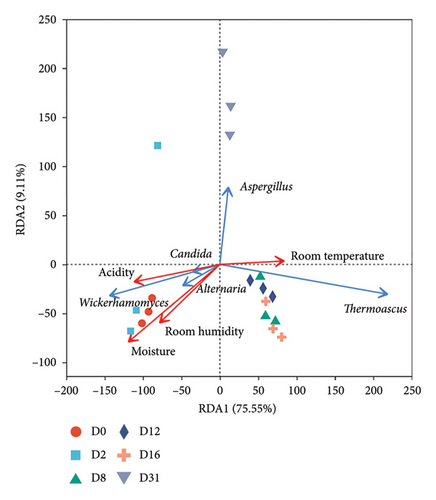
Spearman’s correlation coefficient table (Table S5) unveiled correlations between the top 10 microbial genera in abundance and physicochemical factors. The study found significant negative correlations between Kroppenstedtia, Saccharopolyspora, and Thermoactinomyces and moisture content and acidity, while significant positive correlations were found with Weissella. Additionally, room humidity was found to be positively correlated with Weissella and Lactobacillus and negatively correlated with Kroppenstedtia. Leuconostoc showed a significant positive correlation with moisture content and a significant negative correlation with room temperature. Regarding fungi, moisture content and acidity displayed significant negative correlations with Thermoascus, Thermomyces, and Rhizomucor, and significant positive correlations with Epicoccum, Candida, and Wickerhamomyces. Monographella showed a significant positive correlation with moisture content and a significant negative correlation with room temperature. Aspergillus exhibited a significant negative correlation with moisture content and acidity, and a significant positive correlation with room temperature.
3.8. Correlations Between Daqu Microbial Communities and Volatile Metabolites
The correlation between the principal microorganisms (top 10 genera in abundance) and 105 volatile compounds during fermentation was examined (0.7 < |Spearman’s ρ| < 1, p < 0.05). Four bacterial genera and nine fungal genera demonstrated significant correlations with volatile compounds (Figures 7(a), 7(b)). Notably, Kroppenstedtia, Saccharopolyspora, and Weissella emerged as the three most interconnected bacterial genera (29, 24, and 6). Among the fungi, Rhizomucor, Thermomyces, and Thermoascus were the top three connected genera (37, 31, and 19). The influence of fungi on the formation of volatile compounds surpassed that of bacteria.
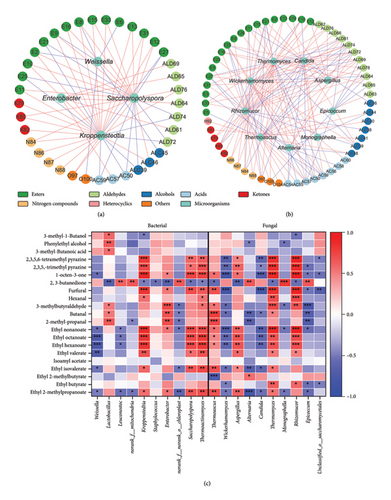
The Spearman correlation analysis, focusing on major microbial genera and key aroma-active compounds (OAV > 1), was conducted to explore the potential role of microorganisms in flavor formation during fermentation (Figure 7(c)). Enterobacter, Lactobacillus, and Thermoascus exhibited significant positive correlations with the formation of aldehydes (2-methylpropanal, butanal, and 3-methylbutyraldehyde), while Epicoccum displayed a significant negative correlation with the formation of these aldehydes. Aspergillus demonstrated a significant positive correlation with the formation of esters (ethyl 2-methylpropanoate, isoamyl acetate, ethyl valerate, ethyl hexanoate, ethyl octanoate, and ethyl nonanoate). Moreover, 2,3,5-trimethylpyrazine and 2,3,5,6-tetramethylpyrazine exhibited significant positive correlations with Kroppenstedtia, Rhizomucor, Thermomyces, and Thermoactinomyces.
4. Discussion
Obtaining timely and comprehensive information on microbial growth and metabolism during Daqu production remains challenging. Consequently, Daqu quality assessment often relies on physicochemical indices and sensory evaluations. At the conclusion of fermentation, the measured moisture content and acidity were 13.0% and 0.47 mmol/10 g, respectively. These results align with industry standards for strong-flavor Daqu, where moisture content should be below 14%, and acidity falls within the range of 0.3–1.5 mmol/10 g (light industry standard of the People’s Republic of China, Strong flavor Daqu, QB/T 4257-2011).
The sensory evaluation of Daqu primarily encompasses visual observation and olfactory assessment. Volatile compounds play a critical role in shaping the aroma profile of Daqu, with over 100 compounds identified in this study, predominantly comprising esters, alcohols, and aldehydes, consistent with the findings from Sichuan and Jianghuai strong-flavor Daqu [13, 17]. Esters, the most diverse and abundant trace constituents in Chinese baijiu, impart fruity and floral notes, primarily synthesized through esterification reactions and the acetyl coenzyme A pathway [18]. Acids and alcohols are primary metabolites, with acid compound levels peaking on the second day of Daqu fermentation before gradually declining. Similarly, alcohol compounds exhibit an initial increase followed by a decrease. Notably, the proportion of alcohol compounds in Jianghuai strong-flavor Daqu significantly exceeds that in Sichuan strong-flavor Daqu, potentially accounting for the enhanced mellowness and sweetness of Jianghuai strong-flavor baijiu [19]. Nitrogenous and heterocyclic compounds, initially absent or present at low levels, undergo a substantial increase by the 12th day of fermentation. Multiple pyrazine compounds have been identified in Daqu, which typically exhibit roasted and nutty aromas and offer certain health benefits [20].
However, the absolute content of volatile compounds does not solely dictate their impact on Daqu’s overall aroma, as odor thresholds also play a crucial role [21]. This study employed GC-O-MS in conjunction with OAV analysis to identify 21 key aroma-active compounds, including ethyl butyrate, ethyl valerate, ethyl hexanoate, ethyl caprylate, acetaldehyde, 3-methylbutyraldehyde, and furfural, all pivotal in shaping the aroma profile of strong-flavor baijiu. The aroma evolution of Daqu during fermentation exhibits distinct three-stage characteristics. Initial stage: The aroma profile is predominantly characterized by fresh grassy, creamy, and malty notes, which may be attributed to the abundant aldehyde and ketone compounds derived from the raw wheat material [17]. Mid-stage (high-temperature phase, 50°C–60°C): Microbial degradation facilitates the conversion of macromolecules into diverse flavor compounds and their precursors, leading to a significant increase in aroma complexity [22]. This stage presents a composite aroma profile featuring grassy, malty, roasted, and mushroom-like notes. Final stage: Under sustained high temperatures, the Maillard reaction and microbial metabolism synergistically promote the synthesis and accumulation of pyrazines, ultimately imparting the Daqu with distinctive nutty and roasted aroma characteristics [20]. Comparative regional studies revealed that the key aroma compounds in Sichuan strong-flavor Daqu include 2-n-pentylfuran, hexanal, 1-octen-3-ol, phenylethanol, guaiacol, 2,3,5-trimethylpyrazine, phenylacetaldehyde, and 4-vinylguaiacol [23]. In contrast, Jianghuai strong-flavor Daqu contains compounds such as guaiacol, 2-methoxy-4-vinylphenol, 2-ethyl-3,5-dimethylpyrazine, furfuryl alcohol, 2,3,5-trimethylpyrazine, 2-ethyl-3,5-dimethylpyrazine, and γ-butyrolactone, among others. Notably, hexanal (grassy aroma) and 2,3,5-trimethylpyrazine (baking aroma) are significant aroma-active compounds found in strong-flavor Daqu from all regions [17]. The volatile flavor compounds produced in Daqu are preserved throughout the fermentation and distillation processes of baijiu. Consequently, variations in the flavor profile of Daqu originating from different production regions may significantly influence the aromatic characteristics of strong-flavor baijiu.
The microbial community structure of strong-flavor Daqu exhibits both commonalities and regional variations across different production areas. In terms of bacterial composition, the dominant genera in Sichuan strong-flavor Daqu were Weissella, Bacillus, Lactobacillus, and Thermoactinomyces [5, 24], while the Jianghuai Daqu primarily features Weissella, Bacillus, Lactobacillus, and Leuconostoc [25]. Notably, Weissella, Lactobacillus, and Leuconostoc all belonged to the lactic acid bacteria. Lactic acid bacteria are known to produce a diverse array of flavor compounds, including aldehydes, esters, and alcohols, contributing to the rich flavor profile of baijiu [26]. Additionally, Kroppenstedtia, Staphylococcus, and Enterobacter have been commonly reported in Daqu studies [27–29]. Bacillus is the dominant bacterial genus in Sichuan and Jianghuai strong-flavor Daqu [30]. It has the ability to secrete enzymes that hydrolyze starch, protein, pectin, and other substrates, making it an essential microorganism for producing aromatic substances in baijiu. Regarding fungal communities, Sichuan strong-flavor Daqu mainly comprises Rhizopus, Pichia, Thermoascus, Aspergillus, and Thermomyces [5, 24], whereas Jianghuai Daqu additionally includes Lichtheimia as a dominant genus [25]. Among these, Aspergillus, Thermomyces, and Thermoascus play a significant role by excreting amylase, cellulase, and protease enzymes. These enzymes efficiently convert macromolecules present in the fermentation matrix into smaller molecules such as glucose and amino acids, providing essential energy and nutrients for microbial proliferation [31]. Wickerhamomyces is consistently observed throughout the whole fermentation period of the Daqu, releasing glucoside hydrolases, arabinosidases, and xylosidases, which are enzymes contributing to the formation of wine aroma in strong-flavor baijiu [32]. Candida can metabolize ethyl caproate, a most important flavor component in strong-flavor baijiu [33]. Rhizopus and Pichia stand out as the predominant fungal genera in the strong-flavor Daqu from the Sichuan and Jianghuai regions, playing crucial roles in saccharification [34]. At the phylum level, Firmicutes and Ascomycota dominate across all regional variants of strong-flavor Daqu [35]. The microbial species present in Daqu vary depending on its origin. This is because during the fermentation process, Daqu comes into contact with the external environment, allowing environmental microorganisms to form the functional microbial community of Daqu through continuous reproduction and adaptation to the fermentation environment [36]. Thermoactinomyces from Sichuan, Lichtheimia from Jianghuai, and Enterobacter from the northern region are the dominant microorganisms specific to their respective origins. However, the dominant microorganisms found in strong-flavor Daqu from various regions share certain similarities, mostly consisting of Weissella, Lactobacillus, Thermoascus, Aspergillus, and Thermomyces [11, 12, 30, 37, 38]. These microbes collectively drive the fermentation process and play a decisive role in shaping the baijiu flavor profile.
Microbial community succession in Daqu is a result of microbial adaptation to specific environmental conditions, aligning with the ecological niche theory, which posits that microbial communities will be affected by a combination of biotic and abiotic drivers [39]. Abiotic factors, particularly environmental physicochemical conditions, play a pivotal role and are subject to artificial control. Temperature, humidity, and acidity emerge as primary environmental physicochemical drivers influencing microbial succession [40]. Elevated temperature and humidity during the early stages of Daqu production have been observed to stimulate the growth of acid-producing bacteria. Physicochemical analyses revealed a peak in Daqu acidity on the second day of fermentation, consistent with the existing findings [5]. Concurrently, the relative abundance of Lactobacillus was significantly higher on Day 2, further supported by positive correlations between acidity, room temperature, room humidity, and Lactobacillus in RDA analysis. At the beginning of fermentation, there are sufficient nutrients and water in the Daqu, and the environment is suitable for the growth of microorganisms. As the Qu-house temperature rose, heat-sensitive fungi, including yeasts and certain molds, were inactivated, resulting in decreased fungal abundance and diversity from Days 2 to 12. Most bacteria, especially thermophiles, were still actively growing at this time [41]. Kroppenstedtia and Thermoactinomyces thrived during this period, positively correlating with room temperature and exhibiting significantly increased relative abundance when the room temperature peaked on Day 8. Beyond physicochemical influences, microbial interactions serve as the principal biological drivers shaping microbial community succession in Daqu [42]. Negative correlations, such as the significant negative correlation between Lactococcus and Bacillus, suggest potential antagonistic interactions. Lactic acid bacteria, such as Lactococcus, may produce lactic acid and bacteriocin, leading to pH reduction in Daqu and creating an unfavorable environment for the growth of other microorganisms [43]. Co-occurrence network analysis illustrates significant positive and negative correlations between different bacterial or fungal genera, indicating mutual coordination and constraint among microorganisms during Daqu fermentation. While the impact of bioheat and nutrient changes resulting from microbial metabolic activities on microbial community succession in Daqu remains unclear, further investigation is warranted to discern the driving factors behind microbial community dynamics in Daqu.
Volatile compounds within Daqu arise from intricate metabolic reactions, significantly influenced by microbial community. Notably, Aspergillus exhibited a significantly positive correlation with the production of specific esters, aligning with prior research findings [11]. Epicoccum was significantly and negatively correlated with the formation of certain aldehydes, and we hypothesize that species under this genus can indirectly influence the formation of compounds because the metabolites with antimicrobial activity that can be produced by Epicoccum inhibit the growth and metabolism of the volatile-producing microorganisms [44]. The correlation heatmap depicted significant and positive associations between Kroppenstedtia, Saccharopolyspora, Thermoactinomyces, Thermoascus, Rhizomucor, and Thermomyces with most of the key aroma compounds (Figure 7), promoting the accumulation of esters, aldehydes, and nitrogen-containing compounds, which were the key microorganisms in the formation of the aroma of northern strong-flavor Daqu. Furthermore, Kroppenstedtia, Thermoactinomyces, Rhizomucor, Aspergillus, and Thermomyces demonstrated positive correlations with aroma compounds (hexanal and 2,3,5-trimethylpyrazine) shared across different regions’ strong-flavor Daqu. Enterobacter, a distinctive microorganism prevalent in northern strong-flavor Daqu, exhibited significant and positive correlations with the formation of aldehydes (2-methylpropanal, butanal, and 3-methylbutanal). Therefore, the variations in the flavor compounds in Daqu samples from different origins are likely primary due to differences in the composition of their microbial communities. These microbial disparities subsequently result in stylistic differences in strong-flavor baijiu produced in various geographical regions. These findings contribute valuable insights for refining Daqu production processes, allowing for the preservation of local strong-flavor baijiu characteristics or facilitating a transition toward the strong-flavor baijiu style observed in other regions. It is crucial to note that statistical correlation does not inherently imply a causal relationship between variables, necessitating additional validation to substantiate these observed correlations. Future research endeavors will concentrate on isolating core microorganisms to discern their precise contributions to Daqu aroma.
5. Conclusion
This study systematically explores dynamic changes in physicochemical properties, microbial communities, and aroma compounds, along with their interrelationships, during northern strong-flavor Daqu fermentation. Key aroma-active compounds (hexanal and 2,3,5-trimethylpyrazine) and dominant microorganisms (Weissella and Thermoascus) were identified in Daqu, with regional variations compared. The environmental factors and microbial interactions affecting microbial succession were clarified, and the microorganisms promoting the formation of key aroma compounds (Kroppenstedtia and Saccharopolyspora) were revealed. These findings not only deepen the understanding of the Daqu fermentation mechanism but also provide a theoretical basis for optimizing the quality of Daqu through avenues such as biological enhancement or control of environmental factors.
Conflicts of Interest
The authors declare no conflicts of interest.
Author Contributions
Peng Xiao: conceptualization, writing – original draft, methodology, and investigation. Silei Lv: formal analysis, visualization, and investigation. Ling Xu: resources and supervision. Yunran Shen: investigation. Fengguo Zhang: resources. Youqiang Xu: visualization and software. Bowen Wang: methodology. Hehe Li: writing – review and editing, supervision, resources, and funding acquisition.
Peng Xiao and Silei Lv contributed equally to this article.
Funding
This work was supported by the Young Elite Scientists Sponsorship Program by CAST (No. 2022QNRC001) and the National Natural Science Foundation of China (No. 32172340) and Beijing Technology and Business University 2024 Graduate Student Research Ability Enhancement Program Project (No. 19008024042).
Acknowledgments
This work was supported by the Young Elite Scientists Sponsorship Program by CAST (No. 2022QNRC001) and the National Natural Science Foundation of China (No. 32172340) and Beijing Technology and Business University 2024 Graduate Student Research Ability Enhancement Program Project (No. 19008024042).
Supporting Information
Table S1: Concentrations a-types of volatile compounds in Daqu. Table S2: Identification of aroma active compounds in Daqu. Table S3: Bacterial and fungal α-diversity index. Table S4: Explanatory weight ratio of each dimension of RDA. Table S5: Spearman’s correlation coefficient. Figure S1: Rarefaction curve of bacterial (A) and (B) and fungal (C) and (D) diversity. Figure S2: Community compositions during Daqu fermentation at levels of bacterial (A) phylum and fungal (B) phylum.
Open Research
Data Availability Statement
Data will be made available on request.


