Role of Gallic Acid in Counteracting Depleted Uranium–Induced Renal Toxicity in Rats: Participation of Redox Stabilizers, Nrf2, NF-Kb, and Caspase-3
Abstract
Uranyl acetate (UA), a form of depleted uranium (DU) extensively applied for military and civilian purposes, poses a health threat to exposed populations. Gallic acid (GA), a phytochemical present in various edible sources, has the potential to restore redox balance and exhibit anti-inflammatory and antiapoptotic effects. Thus, we highlighted the potential protective role of GA in mitigating UA-induced renal cytofunctional impairments in rats. To achieve this objective, the rats were randomly divided into three groups. The first group was left untreated and served as the control. The second group (UA group) was administered a single intraperitoneal injection of UA at a dose of 5 mg/kg body weight. The third group (GA + UA) GA was orally administrated GA via a gastric tube at a dose of 20 mg/kg body weight for 14 days prior to the UA injection. In both the second and third groups, UA was administered on the 15th day, and the rats were euthanized on the 17th day of the experiment. At the end of the experiment, plasma renal damage biomarkers, renal redox parameters, and histopathological examination were estimated, along with immunohistochemical analysis of caspase-3, nuclear factor kappa B (NF-kB), and nuclear factor erythroid 2-related factor 2 (Nrf2). Our findings indicated that GA supplementation in UA-intoxicated rats reduced plasma urea and creatinine levels while increased total antioxidant capacity. It also restored normal kidney levels of superoxide dismutase, catalase, reduced glutathione, and nitric oxide. Additionally, it restored kidney glycogen reserves and decreased collagen fiber deposition. In the GA + UA group, immunoreaction levels of caspase-3 and NF-kB decreased, while those of Nrf2 increased. In summary, GA has the potential to mitigate DU-associated nephrotoxicity by enhancing the antioxidant defense mechanism, as well as modulating protein expression related to cell death pathways and proinflammatory transcription factors.
1. Introduction
Depleted uranium (DU) has approximately half the radioactivity of natural uranium but acts as a chemotoxic heavy metal. Beyond its military applications, DU is also utilized in civilian settings due to its high density, availability, and affordability. It has been employed as counterweights in aircraft, keel ballast in sailboats, and as radiation shielding [1]. DU presents potential health risks to humans through multiple exposure pathways, including inhalation, ingestion, and dermal contact [2]. It is primarily excreted through urine, making the kidneys vulnerable to damage and leading to its accumulation in renal tissues [3]. The intraperitoneal injection of DU in rats resulted in increase in serum renal damage biomarkers and disturbance in renal redox equilibrium [4]. DU causes kidney toxicity by increasing reactive oxidants, triggering cell death, suppressing Nrf2 activity, and causing cellular damage [5, 6].
Sequestering compounds have been widely used to reduce DU accumulation in body systems and expedite its clearance; however, these treatments often have drawbacks, such as low specificity, compatibility issues, exacerbation of renal toxicity, low efficacy, and significant acid–base imbalances [7]. Because of these limitations, researchers have extensively studied plant-based compounds to reduce the harmful effects of DU exposure. These compounds are safe and effective, making them a popular focus in recent studies. Gallic acid (GA) is a polyphenolic compound found in many dietary sources, including edible mushrooms, mangoes, grapes, teas, and wines [8]. GA is a promising radioprotectant because it maintains redox balance and prevents cell death, but few studies address this aspect. GA protected human blood lymphocytes from gamma radiation by preventing DNA mutations and blocking apoptotic pathways, likely by reducing free radical production [9]. It also reduced oxidative damage and prevented bone marrow cell death in a gamma-irradiated mouse model [10]. Our laboratory demonstrated the hepatoprotective effects of GA in rats with uranyl acetate (UA)–induced liver damage, including reduced collagen deposition, restored glycogen levels, decreased caspase-3 expression, and increased Nrf2 expression in liver tissue [11]. Another study showed that GA reduced NF-κB expression and alleviated structural kidney damage in a mouse model of nickel-induced nephrotoxicity [12]. In cisplatin-treated rats supplemented with GA, kidney NF-κB levels decreased, while anti-apoptotic BCL-2 expression increased, and pro-apoptotic Bax and caspase-3 expression decreased [13].
Although GA has demonstrated protective effects in various renal toxicity models, its potential to alleviate renal disorders associated with DU exposure remains unclear. This study aims to fill this gap in the literature by investigating the impact of GA on kidney injury markers, redox balance, histological integrity, and the immuno-expression of key proteins—caspase-3, NF-κB, and Nrf2—in Wistar rats exposed to DU. Understanding these effects is essential as it may lead to the development of novel therapeutic approaches to address renal dysfunction caused by environmental toxins, offering a natural and effective strategy to mitigate such damage.
2. Materials and Methods
2.1. Chemicals
UA dihydrate with a purity of ≥ 98% was procured from Sigma-Aldrich Company (St. Louis, MO, USA). GA with a purity of ≥ 99% was sourced from SD Fine Chem. Limited, India. All other chemical reagents were of analytical grade and were obtained from standard commercial suppliers or as specified in the methods.
2.2. Experimental Animals and Protocol
Eighteen adult male Wistar rats were included in this study. The rats were obtained from the Egyptian Company for Production of Vaccines, Sera, and Drugs, Egypt, and were acclimated for one week before the interventions began. They were housed under standard light/dark cycles at a temperature of 20°C–25°C and a relative humidity of 55.0 ± 5.0%. The rats had ad libitum access to commercial pelleted feed and water. They were evenly and randomly assigned to three groups. The first group remained untreated and served as the control. The second group (UA group) received a single intraperitoneal injection of 5 mg of UA/kg of body weight [14]. The third group (GA + UA) was supplemented orally with GA (dissolved in distilled water) via gastric tube at a dose of 20 mg/kg body weight for 14 days [15] prior to UA injection. This dose was shown to protect against nephrotoxicity by restoring the renal oxidant/antioxidant balance and reducing renal damage biomarkers in bisphenol A-intoxicated rats. Additionally, it improved histopathological lesions in the renal tissue. In both the second and third groups, UA was administered on the 15th day, with no administration on the 16th, and the rats were euthanized on the 17th day of the experiment [14].
2.3. Collection and Processing of Samples
At the end of the experimental procedure, blood samples were collected from the retro-orbital sinus after an overnight fast. Plasma was separated by centrifugation at 3000 rpm for 10 min and stored at −20°C for subsequent biochemical analysis. The rats were humanely euthanized by cervical dislocation under anesthesia induced by intraperitoneal injection of sodium thiopental. The right kidney was promptly dissected, homogenized in 1 mL of 0.1 M phosphate buffer (pH 7.4), and centrifuged (MPW-310, Mechanika Precyzjna, Poland) at 10,000 rpm for 15 min. The resulting supernatants were stored at −20°C to preserve the samples for later analysis of redox parameters. The left kidney was preserved in 10% neutral buffered formalin for histopathological examination.
2.4. Assay of Renal Damage and Redox Parameters
Commercial kits from the Egyptian Company for Biotechnology (catalog # 318,001, 234,001, and TA2513, respectively) were used to assess plasma urea, creatinine, and total antioxidant capacity (TAC). Renal total protein levels were measured following a previously established protocol [16], with concentrations determined using a standard curve. Malondialdehyde (MDA) levels were quantified based on the method of Ohkawa, Ohishi, and Yagi [17]. Nitric oxide (NO) levels were measured as nitrite concentration using the technique described by Ding, Nathan, and Stuehr [18]. Superoxide dismutase (SOD) activity was evaluated by its inhibition of epinephrine autoxidation [19], while reduced glutathione (GSH) was estimated following Beutler [20]. Catalase (CAT) activity was assessed using Lück’s method [21], which measures the enzyme’s capacity to decompose hydrogen peroxide. To standardize results and account for sample concentration variability, all measurements were expressed relative to the total protein content in the kidney tissue.
2.5. Histological and Histochemical Examinations
For histological and histochemical analysis, small kidney sections were fixed in 10% neutral buffered formalin (pH 7.2). The paraffin-embedding method was used for processing the kidney sections. After rinsing, the sections were cleared in xylene, dehydrated through a graded ethanol series (70%–100%), and embedded in paraffin wax. Paraffin blocks were sectioned at 5 μm thickness, followed by deparaffinization in xylene. Standard hematoxylin and eosin (H&E) staining was carried out for general histological examination [22]. Periodic acid–Schiff (PAS) staining was applied to visualize polysaccharides in renal tissue [23], and Picro-sirius red staining was used to identify collagen [24].
The tissue lesions in kidney sections were graded histopathologically as follows: (−) Absent lesion, (+) Slight (< 25%), (++) Moderate (25%–50%), and (+++) Severe (> 50%) [25]. Image analysis and documentation were performed with a digital camera (Toup Tek ToupView, Copyright 2019, Version: x86, Compatible with Windows XP/Vista/7/8/10, China), using ImageJ software and an Olympus CX31 light microscope (Olympus, Japan). Polysaccharides and collagenous fibers were examined at 40x magnification in randomly selected fields from at least three animals per group and quantified using ImageJ software.
2.6. Immunohistochemistry of Caspase-3, NF-kB, and Nrf2
Formalin-fixed kidney tissues were placed in a 10% neutral buffer (pH 7.2). Paraffin-embedded tissues were sectioned, cleaned, and rehydrated through a graded ethanol series (100%–70%) before rinsing with water. Antigen retrieval was achieved by boiling the slides in 1 mM ethylenediaminetetraacetic acid for 10 min, followed by immersion in 3% H2O2 for the same duration. Each section was then incubated in a blocking solution at room temperature for 1 h.
Primary antibodies were applied as follows: caspase-3 antibody (1:100) (Cell Signaling Technology), anti-NF-kB p65 antibody (1:100) (GTX54672, GeneTex), and anti-Nrf2 antibody (1:500) (GeneTex, Inc. North America). The sections were incubated with the primary antibodies for 24 h, followed by incubation with secondary antibodies (1:5000) for 2 h. The reaction was developed using DAB for 2–3 min, and sections were counterstained with hematoxylin for 2–5 min [11, 26].
2.7. Statistical Analysis
Differences between means were tested using Duncan’s multiple-range test. p < 0.05 was set as the limit of significance. All statistical analyses were conducted using SPSS Version 16 (USA).
3. Results
3.1. GA Rescued UA-Induced Renal Malfunction and Oxidative Burden in Rats
In rats exposed to UA, plasma creatinine and urea levels increased significantly by 69% and 74%, respectively, compared to the control group, confirming UA-induced nephrotoxicity. UA intoxication also led to redox imbalance in the kidneys, as indicated by a 107% increase in MDA levels, along with significant reductions in SOD activity (41.5%), CAT activity (19%), and GSH levels (31%). Additionally, plasma TAC decreased significantly by 16.7% compared to the control group. Intervention with GA following UA exposure effectively restored these parameters to normal levels, although TAC remained 10% lower than in the control group (Table 1).
| Parameters | Groups | |||
|---|---|---|---|---|
| Control | UA | GA + UA | p value | |
| Plasma urea level (mg/dL) | 48.212 ± 6.238 | 83.804 ± 9.052Ω | 42.137 ± 7.987Φ | 0.004 |
| Plasma creatinine level (mg/dL) | 0.747 ± 0.055 | 1.263 ± 0.097Ω | 0.530 ± 0.110Φ | 0.000 |
| Kidney MDA level (nM/mg protein) | 0.126 ± 0.010 | 0.261 ± 0.043Ω | 0.164 ± 0.020Φ | 0.004 |
| Kidney SOD activity (U/mg protein) | 1349.541 ± 157.851 | 788.896 ± 59.603Ω | 1369.412 ± 237.334Φ | 0.020 |
| Kidney CAT activity (U/mg protein) | 147.322 ± 1.467 | 119.085 ± 6.530Ω | 137.721 ± 3.729Φ | 0.000 |
| Kidney GSH level (nM/mg protein) | 11.990 ± 1.017 | 8.251 ± 0.611Ω | 12.771 ± 1.721Φ | 0.010 |
| Plasma TAC (nmol/mL) | 7.800 ± 0.171 | 6.500 ± 0.142Ω | 6.998 ± 0.022ΦΨ | 0.022 |
- Note: Results are expressed as the mean ± SEM of six rats per group (one-way ANOVA followed by Duncan post-test). GSH: reduced glutathione.
- Abbreviations: CAT, catalase; MDA, malondialdehyde; SOD, superoxide dismutase; TAC, total antioxidant capacity.
- ΩSignificant difference between control and UA groups.
- ΦSignificant difference between UA and GA + UA groups.
- ΨSignificant difference between control and GA + UA groups.
3.2. GA Attenuated the Histological Lesions in the Kidneys of UA-Intoxicated Rats
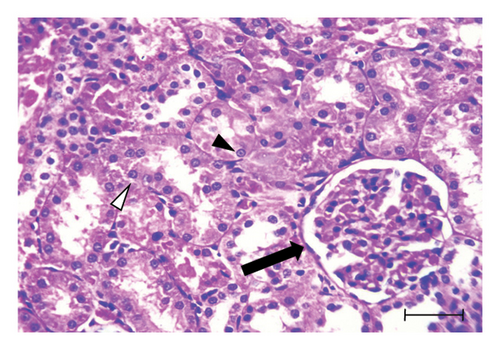
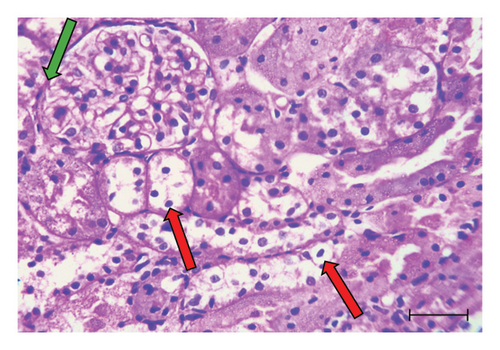
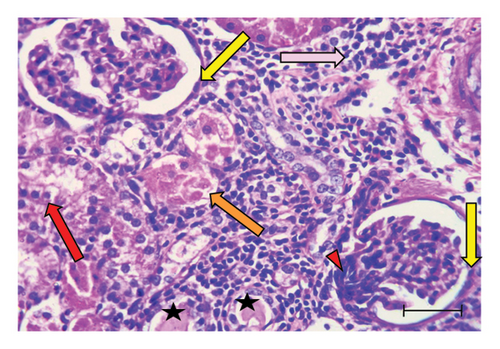
H&E-stained kidney sections from the control group displayed the normal architecture of renal tissue (Figure 1(a)). The cortex contained renal corpuscles of regular size, with intact Bowman’s capsules and glomeruli. The proximal and distal convoluted tubules were lined with cells possessing rounded vesicular nuclei and typical cytoplasm. In contrast, sections from the UA group revealed significant degeneration (Figures 1(b) and 1(c)). Some renal corpuscles showed thickening of Bowman’s capsule cells. Renal corpuscular spaces were either enlarged due to glomerular shrinkage or obliterated due to glomerular enlargement. The glomeruli showed increased cellularity in the capillary tufts. Some renal tubules were entirely destroyed, with prominent pyknotic nuclei and vacuolated cytoplasm in the lining cells. Certain tubules contained hyaline casts in their lumens, and widespread inflammatory cell infiltration was observed in the interstitial tissue. Kidney sections from the GA + UA group demonstrated considerable improvement; however, some pathological lesions persisted. These included thickened Bowman’s capsule cells, tubular cells with pyknotic nuclei and vacuolated cytoplasm, and a few completely destroyed tubules (Figure 1(d)). The histopathological abnormality scores for the kidney tissues across the studied groups are presented in Table 2.
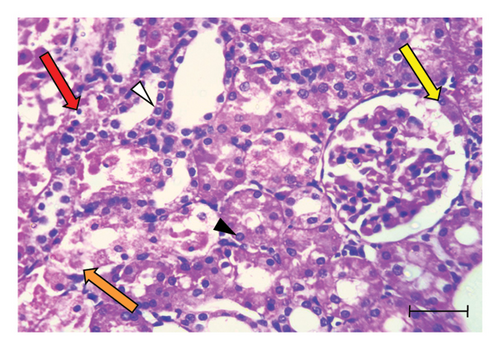
| Lesions | Groups | ||
|---|---|---|---|
| Control | UA | GA + UA | |
| Bowman’s capsule thickening | − | ++ | + |
| Obliterated renal capsular space | − | +++ | + |
| Glomeruli shrinkage | − | ++ | + |
| High cellularity in the tufts of capillaries | − | + | − |
| Complete degeneration of renal tubules | − | +++ | ++ |
| Separation of tubular cells from basement membrane | − | ++ | + |
| Pyknotic nuclei of renal tubular lining cells | + | +++ | ++ |
| Vacuolated cytoplasm of renal tubular lining cells | + | +++ | ++ |
| Inflammatory cell infiltration | − | +++ | + |
| Hyaline casts | + | +++ | + |
- Note: (−) Absent lesion, (+) Slight (< 25%), (++) Moderate (from 25% to 50%), and (+++) Severe (> 50%).
3.3. GA Exhibited Antifibrotic Action in the Kidneys of UA-Intoxicated Rats
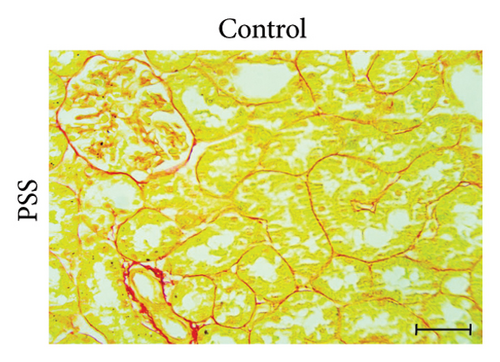
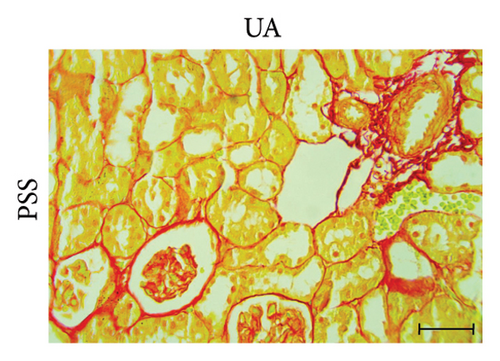
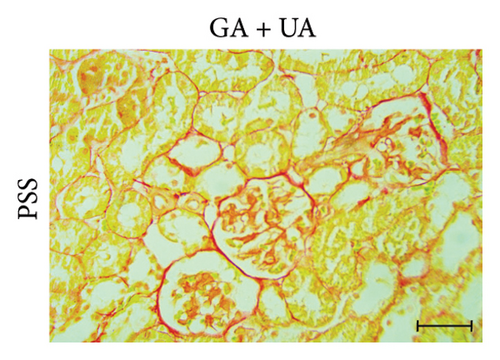
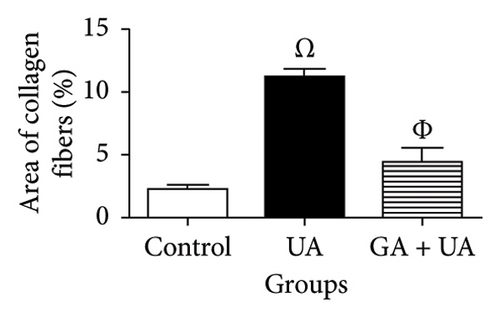
Picro-Sirius red-stained kidney sections from the control group exhibited the normal amount of collagen fibers in the kidney tissue (Figure 2(a)). UA administration led to a significant 391% increase in collagen fiber quantity compared to the control group, as indicated by the prominent red staining (Figure 2(b)). GA treatment in UA-exposed rats restored collagen fiber levels close to normal (Figure 2(c)). The percentage of collagen fiber area across the different groups is shown in Figure 2(g).
3.4. GA Normalized the Mucopolysaccharide Depletion in the Kidneys of UA-Intoxicated Rats
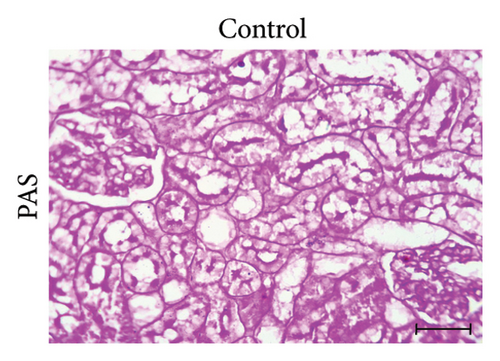
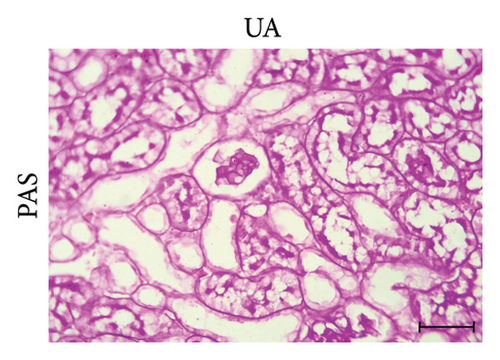
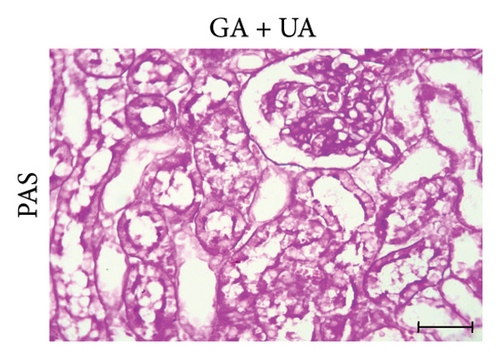
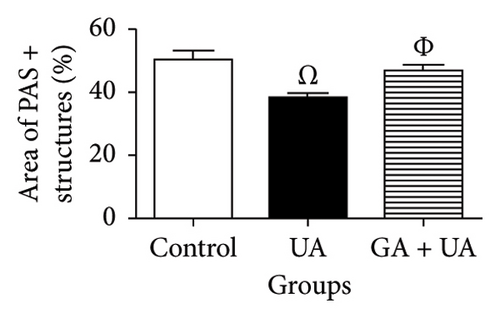
PAS staining of kidney sections from the control group revealed normal positive structures–stained magenta, including the basement membranes, glomeruli, and brush borders of the proximal convoluted tubules (Figure 2(d)). In the UA group, the number of positive PAS structures significantly decreased by 24% compared to the control group (Figure 2(e)). There was no significant difference in the positive PAS structures between the GA + UA group and the control group (Figure 2(f)). Figure 2(h) shows the percentage of the area occupied by positive PAS structures across the various groups.
3.5. GA Exhibits Antiapoptotic Effect by Reducing Caspase-3 Immunoreactivity in the Kidneys of UA-Intoxicated Rats
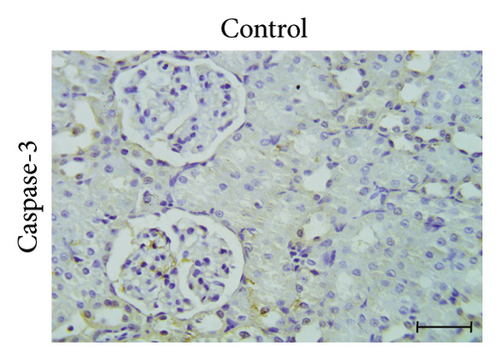
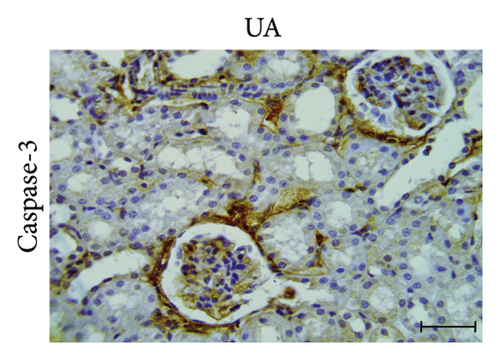
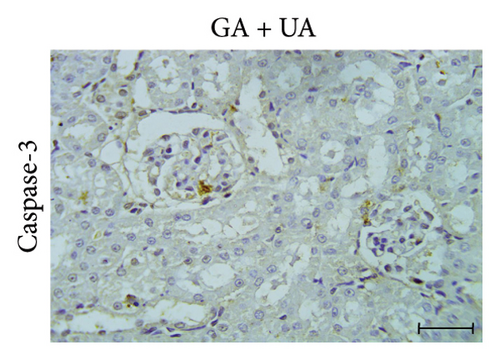
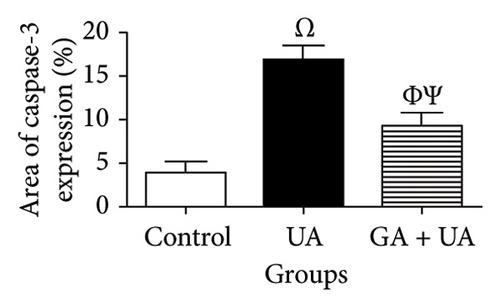
The determination of apoptosis through immunohistochemical assay of caspase-3 in kidney sections from the control group showed normal immunoreaction levels (Figure 3(a)). In the UA group, kidney sections displayed a positive immunoreaction, indicated by brown staining, particularly in the cells of Bowman’s capsule. The immuno-expression of caspase-3 in UA group significantly increased by 322% compared to the control group (Figure 3(b)). In the UA + GA group, the levels of caspase-3 immunoreactivity significantly decreased by 45% compared to the UA group (Figure 3(c)). The percentage area of caspase-3 protein expression in kidney sections across all groups is depicted in Figure 3(j).
3.6. GA Exhibits Anti-Inflammatory Effect by Reducing NF-kB Immunoreactivity in the Kidneys of UA-Intoxicated Rats
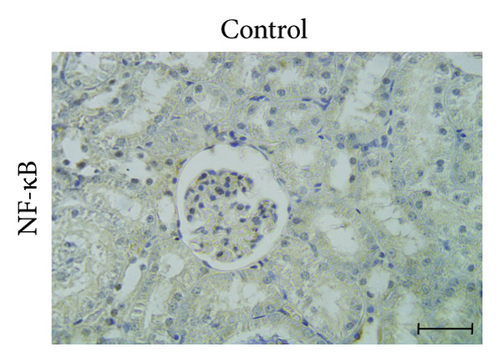
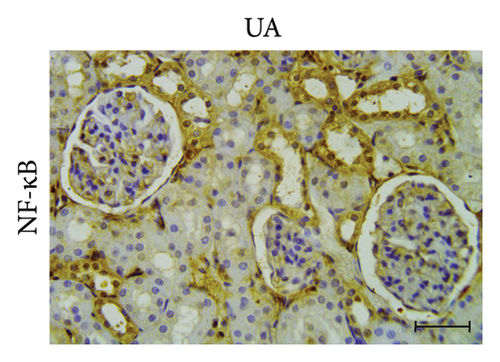
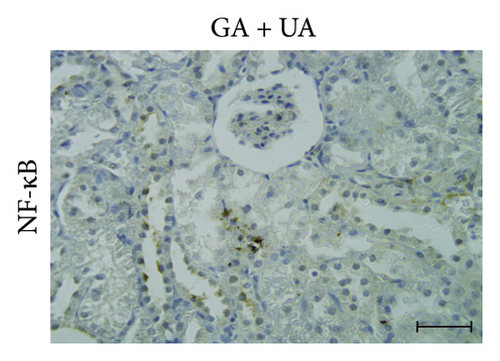
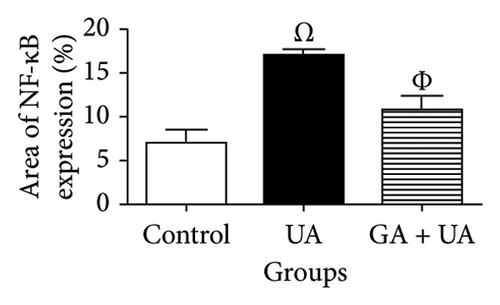
Kidney sections from the control group displayed normal immunoreaction levels of NF-kB (Figure 3(d)). In the UA group, there was an obvious increase in the level of NF-kB immunoreaction, indicated by the brown staining (Figure 3(e)). In the UA group, NF-κB immunoreaction levels, indicated by brown staining (Figure 3(e)), increased significantly by 144% compared to the control group. In the UA + GA group, NF-kB immunoreaction levels significantly decreased by 37% compared to the UA group (Figure 3(f)). The percentage area of NF-kB protein expression in kidney sections across all groups is shown in Figure 3(k).
3.7. GA Exhibits Antioxidant Effect by Raising Nrf2 Immunoreactivity in the Kidneys of UA-Intoxicated Rats
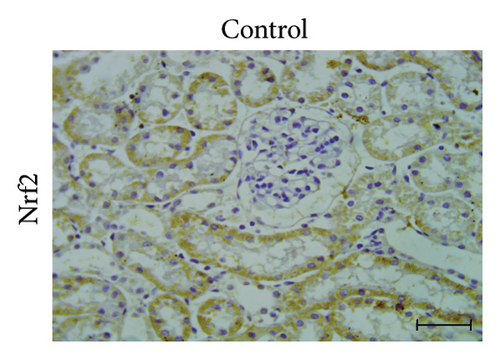
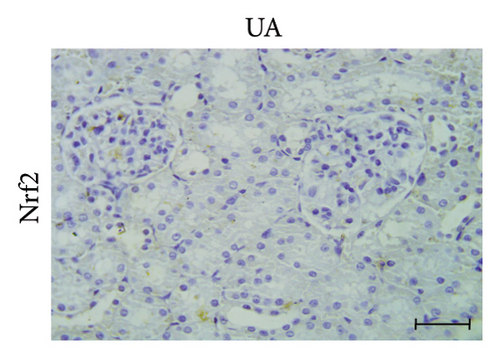
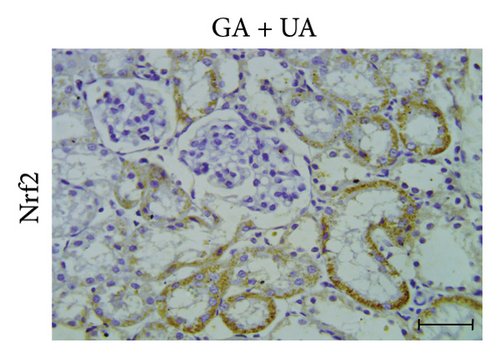
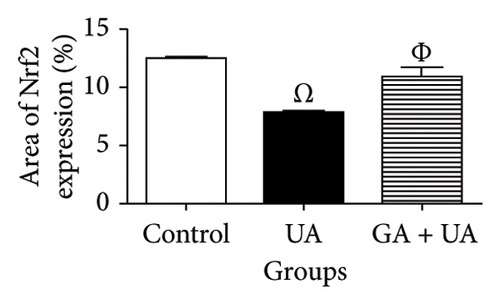
A positive immunoreaction of Nrf2 was observed in the control group, indicated by the brown staining (Figure 3(g)). In the UA group, a negative Nrf2 immunoreaction was observed (Figure 3(h)), whereas the GA + UA group showed a positive immunoreaction (Figure 3(i)). The percentage area of Nrf2 protein expression, shown in Figure 3(l), indicated that UA supplementation significantly reduced Nrf2 expression by 37% compared to the control group. However, GA administration in UA-exposed rats restored Nrf2 expression to levels comparable to those of the control group.
4. Discussion
The UA-induced renal insufficiency, evidenced by a significant increase in plasma urea and creatinine levels, aligns with findings from rats implanted with UA fragments [25]. This observation indicates compromised glomerular filtration due to thickening of glomerular basement membrane and impairment in renal perfusion [25, 27]. The intervention with GA countered the increase in renal damage markers caused by UA exposure, consistent with the findings of Alejolowo et al. [28]. The renal protective effect of GA is attributed to its free radical-neutralizing capacity, along with its cytoprotective and anti-inflammatory activities [29–31].
UA supplementation triggered lipid peroxidation, in harmony with the findings of Zheng et al. [14]. The decreased expression of enzymes that eliminate reactive oxidants and the inhibition of mitochondrial succinate dehydrogenase [32, 33] contribute to the overproduction of reactive species, which leads to subsequent lipid peroxidation. This process disrupts mitochondrial membrane integrity, resulting in the loss of mitochondrial membrane potential and the release of pro-apoptotic signaling molecules [34].
The anti-lipoperoxidative effect of GA aligns with a previous report on gamma-irradiated mice [35]. This effect is attributed to the ability of GA to scavenge oxygen-derived radicals by donating hydrogen to radicals, converting them into a stable substance known as quinone [36]. Additionally, GA can bind to iron and copper ions, preventing radical formation through the Fenton reaction [37].
Consistent with other studies [38], UA was found to induce redox imbalance in renal tissues, characterized by a marked decrease in GSH, SOD, CAT, and NO levels. Consumption of cellular antioxidant enzymes by free oxidants, along with decreased immuno-expression of Nrf2—which governs both the basal level and rate of GSH synthesis—may explain the depletion of GSH [38, 39]. The decline in GSH level has adverse sequelae, including impaired removal of lipid peroxides, promotion of apoptosis, and accumulation of intracellular reactive oxidants that exacerbate cellular damage [38, 40, 41]. The decline in NO concentration may arise from the uncoupling of NO synthase due to the oxidation of tetrahydrobiopterin, the accumulation of asymmetric dimethylarginine, and the formation of peroxynitrite through the reaction of NO with superoxide anion [42]. It may also result from its interactions with calcium-binding modulators or the stimulation of inhibitors of inducible NO synthase, such as interleukin-4 and interleukin-10 [43]. Reduced NO bioavailability compromises renal hemodynamics and disturbs tubular handling processes, as well as the morphological and biological integrity of glomerular filtration barrier [44, 45]. The restoration of renal oxidant/antioxidant balance following UA exposure through GA administration is consistent with previous findings [35]. GA promotes oxidative stability by interfering with lipid peroxidation chain reactions, up-regulating antioxidant gene expression, and enhancing redox-sensitive transcription factors [46–48].
The histological deteriorations in kidney of rats exposed to UA are consistent with Zhu et al. [25]. The destruction of kidney tubules can be attributed to the interaction of carbonato-uranyl combinations at the luminal surface of proximal tubules, leading to alterations in the plasma membrane. This disruption can subsequently affect membrane transport and permeability, cause lysosomal injury, and result in mitochondrial failure [49].
The presence of renal intratubular casts indicates glomerulonephritis, which arises from the degeneration of tubular epithelial lining [50]. This degeneration is a primary goal of DU attack, resulting in cytofunctional impairments associated with damage of mitochondrial respiratory chain and subsequent peroxidative injury in cells [4]. UA is engulfed and retained in tubular cellular compartments, leading to permanent cell necrosis and subsequent shedding of cells [6]. The vacuolated cytoplasm observed in the renal tubular lining cells may result from disrupted fatty acid metabolism, causing lipid accumulation [51]. During tissue processing, these lipids dissipate, leading to the formation of empty, unstained vacuoles [52].
The appearance of pyknotic nuclei in the renal tubular epithelium of the UA group indicates chromatin and nuclear condensation, which can occur in both apoptosis and necrosis [53]. The accumulation of inflammatory cells in renal tissue is triggered by reactive oxygen species, which activate inflammation through the stimulation of NF-κB [54]. This histopathological feature contributes to the onset and progression of fibrosis [55], as observed in the renal histological sections of our study.
Additionally, oxidative damage plays a crucial role in encouragement inflammation by increasing the production of cytokines and growth factors, thereby enhancing myofibroblast differentiation and fibrotic development [55]. The observed decrease in positive PAS-stained renal structures following UA exposure, as observed previously [56], reflects a reduction in polysaccharide content, suggesting impaired renal function [57]. Heavy metal toxicity and radiation exposure stimulate cortisol release, promoting glycogenolysis [58–60], which raises blood glucose levels to manage stress and meet energy demands.
The attenuation in histopathological abnormalities in GA + UA group compared to UA group is consistent with findings by Saif-Elnasr et al. [13]. This effect is attributed to the positive impacts of GA on cell division and differentiation, as well as its ability to suppress oxidative stress, inflammatory cascades, and programmed cell death in renal tissue [61–63].
In agreement with a previous report [64], GA exhibited antifibrotic activity in the kidneys, primarily due to decreased expression levels of NF-κB, TGF-β1, and Smad3 [65, 66], which are essential perquisites in proliferation and migration of renal fibrotic cells. Additionally, the up-regulation of Nrf2 expression limits collagen synthesis and mitigates fibrosis [67].
The restoration of the percentage of positive PAS-stained structures in the UA + GA group is consistent with findings from studies on bisphenol A-induced nephrotoxicity in rats [57]. This may be attributed to improved peripheral glucose uptake, enhanced glycogenesis, and increased insulin sensitivity [58]. Additionally, GA offers protection by mitigating the recruitment of inflammatory cells associated with xenobiotics exposure [57].
In line with findings from Hao et al. [68], UA toxicity increased caspase-3 immunoreactivity levels in renal tissue. UA promotes the release of apoptogenic molecules, such as cytochrome C and members of the caspase family, following a rupture of the mitochondrial outer membrane [41, 69]. The inhibition of apoptotic signals after GA supplementation resembles that observed in a cisplatin-induced nephrotoxic rat, which is attributed to elevated levels of BCl-2 protein and increased levels of Bax and caspase-3 [29].
Nrf2 is an intracellular transcription mediator that regulates the expression of various genes involved in governing redox-stabilizing enzymes, detoxifying elements, anti-apoptotic proteins, and drug carriers [70]. The negative immunoreactivity of Nrf2 in the renal tissue of UA-contaminated rats aligns with the findings observed in a rat kidney cell line [38] and the renal tissue of UA-exposed rats [14]. Nrf2 stability is regulated by both redox control via Keap1, and kinase regulation through the GSK-3/β-TrCP interaction [38]. Moderate or severe oxidative damage under UA exposure can alter the redox-sensing ability of Keap1 [71]. Exogenous contaminants like UA activate internal signaling pathways associated with the GSK-3/β-TrCP interaction in regulating Nrf2 protein stability. This oxidative stress may suppress Nrf2 protein nuclear translocation, as the extent of oxidative damage can influence the nuclear import of Nrf2 [72]. Furthermore, Nrf2 expression is governed by antioxidant response elements [73]. The sequences of these regulatory elements are located in the promoter regions of the Nrf2 gene, and a decreased nuclear Nrf2 concentration results in a vicious cycle of diminished transcription and translation of Nrf2 in an auto-regulatory loop [38]. The inhibition of Nrf2 leads to reduced expression of downstream antioxidants and detoxification-related genes [74] make the cells more vulnerable to the toxic effects of oxidative stressors. There is a strong correlation between Nrf2 suppression and increased susceptibility to apoptosis. Blocking Nrf2 activity and its associated genes induces apoptosis by elevating the Bcl-2/Bax ratio and reducing the expression of caspase 3 and poly (ADP-ribose) polymerase [75]. Moreover, the absence of Nrf2 is causally linked to increased NF-κB activity [76].
The up-regulation of Nrf2 protein expression following GA administration reflects findings in a mouse model of urolithiasis and in a proximal tubular epithelial cell line co-incubated with calcium oxalate monohydrate [48]. GA disrupts the interaction between Keap1 and Nrf2 through shape-dependent and hydrogen bonding interaction or by competitively binding to Keap1, facilitating the stabilization and nuclear translocation of Nrf2 [77]. It also improves genetic binding affinity and transcriptional activity of Nrf2 [78].
Reduced NF-kB immunoreactivity levels in the UA group were previously reported by Zheng et al. [14], who observed inhibited protein expression and nuclear translocation of the transcription factor Nrf2 in kidney homogenates. NF-κB is an essential redox-responsive transcription modulator and a key driver of the inflammatory response. Its predominant type, the p65/p50 heterodimer, binds to IκB proteins in the cytoplasm in an inactive state. Oxygen-derived species induce the degradation of IκBα proteins in the cytoplasm by phosphorylating them via the inhibitor of NF-κB kinase enzyme. This process liberates NF-κB, allowing its translocation into the nucleus [79]. NF-κB enhances the expression of NADPH oxidase, a source of intracellular free radicals, thereby contributing to oxidative damage [63]. Conversely, GA administration significantly reduced NF-κB immunoreactivity levels, as demonstrated in a cisplatin-induced nephrotoxic rat model [13]. This reduction is achieved through inhibition of IκBα and NF-κB phosphorylation, degradation of IκBα, and nuclear translocation of p65 [80, 81].
5. Conclusion
Oral administration of GA prior to UA toxicity reduced markers of renal dysfunction, redox instability, cytopathological abnormalities, and immunoreactivity of caspase-3 and NF-κB, while enhancing the immunoreactivity of Nrf2. GA shows promise as a protective agent against DU-induced renal toxicity. Further studies should explore the efficacy of GA against prolonged DU exposure in renal toxicity and other related abnormalities.
Ethics Statement
All methods in this study complied with the University roles for the care of experimental animals. The Research Ethics Committee of the Faculty of Veterinary Medicine at Assiut University, Egypt, granted ethical approval (06/2023/0070).
Conflicts of Interest
The authors declare no conflicts of interest.
Author Contributions
Nasser S. Abou Khalil conceptualized the study, carried out formal analysis, wrote the original draft, and supervised the research. Sohair M. M. Ragab and Elham A. Abd-Allah conceptualized the study and performed the biochemical assays. Alshaimaa A. I. Alghriany carried out the histopathological evaluation. Mohamed Afifi and Fahad O. Alenezi revised and published the paper. All authors have reviewed and approved the final version of the manuscript.
Funding
This study was conducted without financial support from any public, commercial, or nonprofit funding agencies.
Open Research
Data Availability Statement
The data supporting the results of this study can be obtained from the corresponding author following reasonable request.


