Apoptotic and Cytotoxic Potential of Carnosic Acid- and Carnosol-Rich Fractions From Salvia dorystaechas on Human Hepatoma (HepG2) Cells
Abstract
Plant isolates from Salvia dorystaechas (Lamiaceae) were investigated for their apoptotic and cytotoxic effects on human hepatocellular carcinoma (HepG2) cells under various treatment conditions. Chromatographic isolation yielded fractions (Fr C, D, F, and H) rich in carnosic acid (CA) and carnosol (CL), with significantly higher concentrations (26.3–93.5 g/kg) compared to the crude extract (10.0 g/kg). Other phenolic compounds, including caftaric acid, epicatechin, quercetin, and rutin, were also detected in notable amounts via ultra-high-performance liquid chromatography-mass spectrometry/mass spectrometry (UHPLC-MS/MS). CA-/CL-rich fractions effectively induced caspase-9 and caspase-3 activities, decreased cell viability, and increased lactate dehydrogenase (LDH) release. These effects were significant compared to those induced by 0.1 mM hydrogen peroxide (H2O2). Notably, Fr D and Fr H, which contained the highest CA/CL concentrations, showed caspase-9/caspase-3 activities of 1.60/1.83 and 1.63/1.94, respectively, at 25 μg/mL after 24 h of treatment, whereas the crude plant extract showed corresponding activity values of 1.33/1.36 under the same conditions. In contrast, the crude extract exhibited its strongest apoptotic and cytotoxic effects under harsher conditions (50 μg/mL and 48 h), with caspase-9/caspase-3 activities of 1.70/2.59, 12.0% cell viability, and 65.4% LDH release. Apoptosis was further supported by superoxide (O2•−) production mediated by NADPH oxidases (NOXs), as the NOX inhibitor diphenyleneiodonium (DPI) reduced O2•− levels by 28.6%–48.6%. Additionally, nuclei-stained cells revealed morphological changes, including nuclear fragmentation, apoptotic body formation, and loss of adhesion. In conclusion, CA-/CL-rich S. dorystaechas isolates demonstrated strong apoptotic and cytotoxic effects on HepG2 cells, with contributions from other phenolic compounds. These findings highlight the potential therapeutic value of S. dorystaechas isolates in liver cancer treatment.
1. Introduction
Cancer cells exhibit elevated levels of reactive oxygen species (ROS), along with antioxidant enzymes and proteins, suggesting a balance between these factors. However, when ROS levels surpass a critical threshold, apoptotic mechanisms in cancer cells are triggered, leading to programmed cell death [1]. The induction of apoptosis is a key mechanism underlying tumor cell death and is one of the main therapeutic strategies in cancer treatment [2, 3].
Exogenously administered simple phenolic or polyphenolic compounds have been reported to exhibit prooxidant activity, thereby inducing apoptosis in various cancer cell types [4, 5]. While these molecules are primarily recognized for their ability to scavenge ROS, paradoxically, they have also been shown to generate additional ROS to inhibit cancer cell proliferation [6–8]. This dual behavior appears to be highly dependent on both the concentration of the phenolic compound and the experimental conditions. Specifically, low concentrations of phenolic compounds typically display antioxidant properties, whereas higher concentrations promote prooxidant effects [9, 10]. Certain polyphenols have been demonstrated to induce apoptosis via activation of the caspase-3-dependent pathway [11, 12] or by initiating H2O2 production, thereby increasing oxidative stress and causing DNA damage [13].
Hepatocellular carcinoma is the fifth most common cancer type globally and the third leading cause of cancer-related mortality. Additionally, the liver is a frequent site of metastasis [14]. Due to its aggressive progression and high mortality rate, hepatocellular carcinoma is recognized as a major global health challenge. Current treatment strategies, including surgery, chemotherapy, liver transplantation, and pharmacological therapies, are often associated with toxic side effects and high recurrence rates due to resistance to chemotherapeutic agents [15]. Consequently, the isolation and synthesis of effective antitumor compounds from natural products are critical for the development of novel agents capable of inducing apoptosis in cancer cells while minimizing adverse effects.
Salvia dorystaechas B.T.Drew, an endemic species of the Lamiaceae family in Türkiye, is widely consumed as tea. However, studies on S. dorystaechas (syn. Dorystaechas hastata) are quite scarce, and no research has specifically investigated the apoptotic and cytotoxic potential of isolates derived from this plant species [16, 17]. To address this gap, this study aimed to evaluate the apoptotic and cytotoxic effects of the crude extract and chromatographically isolated fractions obtained from S. dorystaechas on human hepatocellular carcinoma cells (HepG2).
2. Materials and Methods
2.1. Materials
The solvents used for liquid chromatography, including methanol (CH3OH), dichloromethane (DCM), 1-butanol, ethyl acetate (EtOAc), isopropanol (IPA), acetic acid (HOAc), trifluoroacetic acid (TFA), water (H2O), acetonitrile (ACN), acetone, and hydrogen peroxide (H2O2), were purchased from Merck (Darmstadt, Germany). Chromatographic adsorbents, including normal-phase (NP) and reversed-phase (RP) C18-functionalized silica gel, were obtained from Merck (Darmstadt, Germany) and Aldrich (MO, USA), respectively. Borosilicate-glass chromatographic columns were custom-manufactured by Ildam (Ankara, Türkiye).
Cell culture consumables, including T75 flasks, 6- and 96-well plates, were obtained from Corning (NY, USA). HepG2 cell line (HB-8065) and fetal bovine serum (FBS) were acquired from ATCC (VA, USA). Dulbecco’s modified Eagle’s medium (DMEM) and phosphate-buffered saline (PBS) were supplied by Thermo Fisher Scientific (MA, USA) and Gibco (NY, USA), respectively.
Chemicals such as Folin-Ciocalteu reagent (Supelco, Darmstadt, Germany), gallic acid, dimethyl sulfoxide (DMSO), antibiotic penicillin-streptomycin, trypsin-ethylenediaminetetraacetic acid solution (EDTA), Triton X-100, nitrotetrazolium blue chloride (NBT), and 1,1-diphenyl-2-picrylhydrazyl (DPPH•) were procured from Sigma or Sigma-Aldrich (MO, USA; Darmstadt, Germany). (3-(4,5-Dimethylthiazol-2-yl)-2,5-diphenyltetrazolium bromide (MTT) and antimycotic Plasmocin were obtained from Invitrogen (CA, USA) and Invivogen (CA, USA), respectively. 4′,6-Diamidino-2-phenylindole dihydrochloride (DAPI) and diphenyleneiodonium (DPI) were purchased from Santa Cruz Biotechnology (CA, USA).
Caspase-9 and caspase-3 colorimetric assay kits were sourced from BioVision (CA, USA). A lactate dehydrogenase (LDH)-based in vitro toxicology assay kit was obtained from Sigma (MO, USA).
2.2. Plant Material, Extraction, and Chromatographic Separation
Aerial parts of S. dorystaechas were collected from the Konyaaltı district of Antalya, Türkiye, in mid-June 2022. The plant material was air-dried at room temperature (23°C–25°C) for 10 days. Leaves were separated from branches and stored at 4°C for a few days before processing.
A total of 100 g of dried leaves was ground and extracted with 500 mL methanol under reflux at 65°C for 10 h. The mixture was filtered twice through Whatman No. 1 paper, and the solvent was removed using a rotary evaporator (IKA RV 10, Germany) under reduced temperature and pressure. The resulting 4 g of crude extract was sequentially washed with hexane (x3) and a hexane:EtOAc mixture (9:1) (x3), with solvents removed by centrifugation at 4°C. The extract was dissolved in methanol, split into eight aliquots, and sonicated for 30 min to transfer soluble components to methanol and exclude insoluble matter. After centrifugation (4000 rpm, 15 min, 4°C), the supernatant was collected, and the solvent was removed at 35°C under reduced pressure. The crude extract was further dried in a vacuum oven at 30°C for 6 h and stored at 4°C until purification.
NP and RP chromatographies were used for fractionation. NP separations were performed on a 30 cm borosilicate glass column (3 cm diameter) packed with 40 g silica gel (40–63 μm). Crude extract (2 g) mixed with silica gel (4 g) was applied (1.5 g per run). RP separations were conducted on a similar column (2 cm diameter) packed with 20 g C18-silica gel (40–75 μm, 70 Å). For RP, 0.7 g of crude extract was applied directly onto the column. Gradient elution for both NP and RP separations was facilitated using an air pump.
- •
Elution 1: Acidified (0.5% HOAc) DCM:CH3OH (10:1 ⟶ 4:1) was followed by 1-butanol:HOAc:H2O (7:1:2) and acidified ACN:acetone:CH3OH (4:4:1).
- •
Elution 2: Acidified DCM:CH3OH (5%, 10%, 20%, and 30% methanol composition) followed by 1-butanol:HOAc:H2O (7:1:2).
A total of 11 fractions (Elution 1) and 8 fractions (Elution 2) were collected. RP separations for these fractions are schematically shown in Figure S1. A total of 12 isolates (Fr A–Fr L) and a methanolic crude extract were obtained. Among these, Fr C, D, F, H, I, K, and the crude extract showed cytotoxic and/or apoptotic effects on HepG2 cells. Results for other fractions, which were inactive, are omitted to avoid unnecessary data crowding. Chromatographic steps were monitored using thin-layer chromatography with standard compounds.
All plant isolates were analyzed for phenolic composition using ultra-high-performance liquid chromatography-mass spectrometry/mass spectrometry (UHPLC-MS/MS).
2.3. UHPLC-MS/MS Analysis
Phenolic compounds in plant isolates were analyzed using UHPLC-MS/MS. Homogenized 1.0 g of sample was extracted with 10 mL of CH3OH:ACN (1:1) containing 0.1% (v/v) formic acid. The mixture was vortexed for 5 min, centrifuged at 4000 rpm for 15 min at 4°C, and the supernatant was filtered through a 0.2 μm PTFE membrane before injection into the UHPLC-MS/MS system. The total analysis time was 7 min.
Analysis and quantification were performed using a Thermo Scientific Ultimate 3000 UHPLC coupled with a TSQ Fortis triple quadrupole mass spectrometer (Thermo Fisher Scientific Inc., Waltham, MA, USA). Chromatographic evaluations were conducted with Xcalibur software. Separations were achieved using a Hypersil Gold RP C18 column (1.9 μm; 50 × 2.1 mm) maintained at 40°C. The mobile phases consisted of (A) H2O:ACN (95:5) with 0.1% formic acid and 4 mM ammonium formate, and (B) ACN:H2O (95:5) with 0.1% formic acid and 4 mM ammonium formate. A gradient flow program was applied during elution.
The mass spectrometer employed atmospheric pressure ionization/heated electrospray ionization (API/HESI) with a triple quadrupole detector. The ionization technique used soft ionization, based on protonation (M + H) for positive ionization or deprotonation (M-H) for negative ionization, preserving the main analyte mass. Solutions of reference standard phenolics with known concentrations were prepared and analyzed under identical conditions. Quantification of phenolics in plant isolates was performed by comparing the data to those of reference standards.
2.4. Total Phenolics Content (TPC) Assay
The TPC of S. dorystaechas isolates was determined following the procedure by Singleton et al. [18], with modifications for use with a Multiskan FC microplate reader (Thermo Scientific, MA, USA). Briefly, 40 μL of a 500 μg/mL plant isolate solution in methanol was mixed with 40 μL of Folin-Ciocalteu reagent in a 96-well plate. After 3 min, 40 μL of saturated Na2CO3 solution and 280 μL of H2O were added sequentially. A blank was prepared similarly using methanol as the sample. The plate was incubated in the dark for 60 min, and absorbance was measured at 725 nm. A calibration curve using gallic acid standard solutions (0.05–5 mM, R2 = 0.999) was used to calculate TPC as g gallic acid equivalent per kg of isolate (g GAE/kg).
2.5. Radical Scavenging Activity
Antioxidant activities of the samples were expressed as IC50, defined as the concentration of the sample required to reduce the absorbance of the control (Acontrol) by 50%.
2.6. Cell Culture and Treatment With S. dorystaechas Isolates
HepG2, a human hepatoma cell line (HB-8065, ATCC), was maintained in T75 polystyrene culture flasks with DMEM containing 10% FBS, 1% antibiotic-antimycotic solution, 3.7 g/L NaHCO3 as a buffer system, and 1 mM sodium pyruvate, under a 5% CO2 atmosphere at 37°C. After harvesting, cells were seeded in clear 6-well or 96-well plates at varying densities per well, depending on the assay, and incubated for 12 h to recover from handling. At the end of this, the culture medium was removed and replenished with fresh medium, followed by an additional 12 h of incubation. Subsequently, the medium was replaced with FBS-free medium containing 12.5, 25, or 50 μg/mL of the plant isolate or rosmarinic acid, at their respective final concentrations per well.
The doses of plant isolates used for treatment were determined based on preliminary data from this study. Cells containing DMSO without any sample were used as the control. Additionally, 0.1 mM was tested on cells as positive control for apoptotic/cytotoxic effects. The maximum DMSO concentration in culture was ensured not to exceed 0.5% (v/v) during treatment with samples.
2.7. Evaluation of Apoptosis
2.7.1. Caspase-9 and Caspase-3 Activity Assays
The activities of caspase-9 and caspase-3 were measured using the respective colorimetric assay kits [19, 20]. For both assays, cells were seeded in 6-well plates at a density of 0.5 × 10⁶ cells/well. After treatment, the media were removed, and the cells were collected using 0.25% (w/v) Trypsin-0.53 mM EDTA solution, counted, and pelleted (2–5 × 10⁶ cells). The cell pellets were resuspended in lysis buffer and incubated on ice for 10 min. Following centrifugation, the supernatant was used to determine protein concentration. For each assay, 100–200 μg protein was diluted in cell lysis buffer and combined with 2X reaction buffer containing 10 mM dithiothreitol.
To assess caspase-9 activity, 5 μL of 4 mM LEHD-pNA substrate (final concentration: 200 μM) was added to each sample, while for caspase-3 activity, 5 μL of 4 mM DEVD-pNA substrate (final concentration: 200 μM) was added. All samples were incubated at 37°C for 2 h. At the end of the incubation, aliquots of the reaction mixtures were transferred to a 96-well plate, and absorbance was measured at 405 nm for both assays.
Results for caspase-9 and caspase-3 activities were expressed as fold increases, calculated by comparing the results of treated cells with those of control cells without any inducer.
2.7.2. Nuclear Staining for Morphological Assessment of Apoptotic Changes
The presence of apoptotic bodies and nuclear morphology in HepG2 cells was assessed by DAPI staining and phase-contrast imaging. For DAPI-staining, cells were seeded on coverslips in 6-well plates at a density of 0.5 × 10⁶ cells/well. After culturing and treatments, cells were fixed with 4% paraformaldehyde in PBS, permeabilized with 0.5% Triton X-100 in PBS, and stained with 300 nM DAPI solution for 10 min in the dark. Following three washes with PBS (5 min each), coverslips were mounted on glass slides and imaged under a fluorescence microscope (Soptop ICX41, Sunny Instruments) equipped with a 25x objective lens and a resolution of 0.5 μm/pixel. A scale bar of 50 μm was applied to all images, using the blue filter setting. Morphological changes were also examined in stain-free cells using phase-contrast imaging with an inverted microscope at the end of the treatments.
2.8. Evaluation of Cytotoxicity
2.8.1. Assessment of Cell Viability Using the MTT Assay
The MTT assay measures metabolic activity in cells, based on the ability of NADPH-dependent cellular oxidoreductase enzymes to reduce the tetrazolium dye, MTT, into purple formazan. Cells were seeded in a 96-well plate at a density of 1 × 10⁴ cells/well and cultured to assess viability. After treatment with samples, the cells were washed with PBS, and the supernatant was removed. Subsequently, 10 μL of 5 mg/mL MTT prepared in PBS was added to 100 μL of medium in each well, and the plate was incubated at 37°C for 3 h. After gentle removal of the supernatant, 100 μL of DMSO was added to each well to dissolve the purple formazan crystals. The plate was placed on a microplate shaker for 15 min, and absorbances were measured at 572 nm with a reference wavelength of 630 nm (Asample) using a microplate reader.
2.8.2. Assessment of Cytotoxicity Using the LDH Release Assay
The principle of the assay is based on the reduction of NAD by LDH. The resulting reduced NAD (NADH) is utilized in the conversion of a tetrazolium dye, which is measured spectrophotometrically. The LDH release assay was performed using the in vitro Toxicology Assay Kit (LDH-based) [21]. Cell seeding, culturing, and treatment were carried out in the same manner as described for the MTT assay above. Briefly, microplates containing the cells were removed from the incubator and centrifuged to pellet the cells. The supernatant from each well was transferred to a clean microplate. The LDH assay mixture, prepared immediately prior to the assay, was added to each well at a volume equal to twice the volume of the removed medium. The plate was incubated at room temperature in the dark for 30 min. The reaction was stopped by adding 1 N HCl to each well before measuring absorbance at 490 nm. Cytotoxicity results, expressed as the percentage of LDH release, were calculated using the equation provided for the MTT assay, after subtracting the background absorbance value from the primary absorbance for each well.
2.8.3. Measuring O2•− Formation Using NBT
The spectrophotometric measurement of reduced NBT is a widely used colorimetric method for determining superoxide (O2•−) production. The procedure was adapted from the study by Kolářová et al. [22]. Cells were seeded at a density of 3 × 10⁴ cells/well in 96-well plates and incubated at 37°C in a 5% CO2 atmosphere for 24 h. NBT was added to each well at a final concentration of 0.48 mM in a total volume of 100 μL, and the plates were incubated at 37°C for 1 h. Following this, selected plant isolates (Fr C, F, H, I, and K, as well as the crude extract) or rosmarinic acid were added to the wells at a final concentration of 25 μg/mL. For wells treated with the NADPH oxidase (NOX) inhibitor (DPI), the inhibitor was added at a final concentration of 10 μM, 10 min prior to the addition of the test samples. Both DPI-treated and untreated wells underwent the same sample treatments. Reactions for each sample, with or without DPI, were stopped at intervals ranging from 1 to 8 h. The formazan accumulated in the cells was solubilized with 10% Triton X-100 in PBS, and absorbance was measured at 572 nm. Samples containing NBT without cells were used to determine background absorbance values. Data were presented as an “Absorbance versus reaction time (h)” graph to evaluate O2•− formation in cells stimulated by plant isolates or rosmarinic acid.
2.9. Statistics
The Excel software (Office 2013, Microsoft, USA) was used for the statistical evaluation of the results. One-way analysis of variance (ANOVA) at a 95% confidence level, followed by the Duncan post hoc test, was applied. Excel and Python coding were also used to prepare the graphics.
3. Results and Discussion
3.1. Phenolic Profile and Antioxidant Activity of S. dorystaechas Isolates
A crude methanolic extract and a total of 12 fractions (Fr A–L) (Figure S1) were isolated from the S. dorystaechas plant species. The crude extract was found to contain various classes of phenolic compounds, including flavonols (quercetin and rutin), hydroxycinnamic acid derivatives (caftaric acid, p-coumaric acid, ferulic acid, and rosmarinic acid), catechins (catechin, epicatechin, epicatechin gallate, etc.), anthocyanidins (cyanidin and delphinidin), and the phenolic abietane diterpenes CA and CL. Among all phenolics detected, the crude extract contained notable amounts of rutin (28.8 g/kg), epicatechin (4.6 g/kg), cyanidin (2.2 g/kg), CA (6.7 g/kg), CL (3.3 g/kg), caftaric acid (4.2 g/kg), ferulic acid (15.7 g/kg), and rosmarinic acid (6.6 g/kg) (Table 1).
| Phenolic constituents | The crude extract | Fr C ∗ | Fr D ∗ | Fr F ∗ | Fr H ∗ | Fr I ∗ | Fr K ∗ |
|---|---|---|---|---|---|---|---|
| Epigallocatechin | 0.0 ± 0.0h | 0.0 ± 0.0d | 0.0 ± 0.0g | 0.0 ± 0.0d | 0.0 ± 0.0e | — | 0.0 ± 0.0e |
| Epigallocatechin gallate | 0.0 ± 0.0h | — | — | — | — | 0.0 ± 0.0f | — |
| Epicatechin gallate | 0.0 ± 0.0h | 0.0 ± 0.0d | — | — | 0.0 ± 0.0e | — | — |
| Caftaric acid | 4.2 ± 0.2d | — | — | 1.9 ± 0.4c | — | 4.6 ± 0.9d | 5.3 ± 1.4b |
| Cyanidin | 2.2 ± 0.3e | — | — | 0.0 ± 0.0d | — | — | — |
| Epicatecin | 4.6 ± 0.6d | 5.2 ± 2.3c | 3.3 ± 1.2d | 2.5 ± 1.6c | 14.1 ± 3.4b | 11.1 ± 2.3c | 12.4 ± 1.5a |
| Gallocatechin | 0.0 ± 0.0h | 0.0 ± 0.0d | 0.0 ± 0.0g | 0.0 ± 0.0d | 0.0 ± 0.0e | — | 0.0 ± 0.0e |
| Caffeic acid | 0.3 ± 0.2g | — | 0.0 ± 0.0g | — | — | 0.0 ± 0.0f | 0.2 ± 0.1d |
| Catechin | 0.4 ± 0.3g | — | 0.3 ± 0.0f | 0.2 ± 0.0d | 1.2 ± 0.8d | 1.5 ± 0.7e | 1.1 ± 0.3c |
| p-Coumaric acid | 1.4 ± 0.5f | — | — | — | — | — | 4.1 ± 1.5b |
| Delphinidin | 1.3 ± 0.4f | — | 0.5 ± 0.0e | 0.2 ± 0.2d | 0.5 ± 0.4d | 0.9 ± 0.4e | 0.5 ± 0.3d |
| Ferulic acid | 15.7 ± 2.5b | — | — | — | — | — | 1.5 ± 0.8c |
| Rosmarinic acid | 6.6 ± 1.3c | — | — | — | — | 19.5 ± 3.5b | — |
| Rutin | 28.8 ± 3.5a | — | 48.1 ± 6.2b | — | 2.6 ± 1.0c | 62.4 ± 5.6a | — |
| Quercetin | 1.9 ± 0.5e | 32.9 ± 5.2a | 11.6 ± 2.0c | 8.5 ± 1.6b | 3.2 ± 0.8c | — | 2.4 ± 0.7c |
| Carnosol (CL) | 3.3 ± 1.1d | 8.5 ± 3.1b | 15.2 ± 2.8c | 7.0 ± 1.3b | 11.6 ± 3.2b | — | — |
| Carnosic acid (CA) | 6.7 ± 1.7c | 24.0 ± 3.7a | 64.1 ± 4.6a | 19.3 ± 3.0a | 81.9 ± 6.4a | — | — |
- Note: Results were given as mean ± STD (n = 3). Means followed by the same letter within each column are not significantly different (Duncan test, [p < 0.05]).
- Abbreviation: STD, standard deviation.
- ∗: Fr: Fraction.
- ∗∗: UHPLC-MS/MS: Ultrahigh-performance liquid chromatography–mass spectrometry/mass spectrometry.
Fractions C, D, F, and H were observed to contain significant amounts of CA (19.3–81.9 g/kg), CL (7.0–15.2 g/kg), and quercetin (3.2–32.9 g/kg) as common constituents. Notably, Fr D also contained a substantial amount of rutin (48.1 g/kg). Epicatechin, a key antioxidative constituent commonly found in green tea, was detected in all isolates in considerable amounts (2.5–14.1 g/kg). Fr I, which contained the highest amounts of rutin (62.4 g/kg) and rosmarinic acid (19.5 g/kg) among all fractions, and Fr K were the only isolates devoid of the phenolic diterpenes CA and CL. Fr K was determined to contain the lowest amount of total phenolic compounds (27.5 g/kg; TPC: 33.4 g GAE/kg) among all isolates (Table 2).
| Plant isolates ∗ | Amount of total phenolic compounds (g/kg isolate) | Total amount of CA/CL cal. from UHPLC-MS/MS ∗∗∗ | IC50 from DPPH• assay (µg/mL) | R2 from “inhibition% of DPPH• vs. concentration of plant isolate” plots | |
|---|---|---|---|---|---|
| calculated from UHPLC-MS/MS | from TPC assay ∗∗ | ||||
| Crude extract | 77.4 | 76.2 ± 2.6e | 10.0 | 120.5 ± 6.0b | 0.993 |
| Fr C | 70.6 | 72.3 ± 2.1e | 32.5 | 62.5 ± 4.8cd | 0.996 |
| Fr D | 143.1 | 108.4 ± 5.7 d | 79.3 | 45.5 ± 4.2cde | 0.980 |
| Fr F | 39.6 | 78.3 ± 2.5e | 26.3 | 65.6 ± 2.8c | 0.986 |
| Fr H | 113.1 | 147.4 ± 5.1c | 93.5 | 33.0 ± 3.1ef | 0.989 |
| Fr I | 100.0 | 43.3 ± 5.8f | — | 868.7 ± 42.9a | 0.987 |
| Fr K | 27.5 | 33.4 ± 2.5f | — | N.A. | N.A. |
| Rosmarinic acid | — | 745.5 ± 23.2b | N.A. | 13.1 ± 3.1fg | 0.995 |
| Quercetin | — | 870.5 ± 15.3a | N.A. | 6.3 ± 0.7g | 0.985 |
- Note: IC50: the concentration of the sample required to make a 50% decrease in the absorbance of the control sample; R2: coefficient of determination; DPPH•: 1,1-diphenyl-2-picrylhydrazyl. Means followed by the same letter within TPC and IC50 columns are not significantly different (Duncan test, [p < 0.05]).
- Abbreviations: CA, carnosic acid; CL, carnosol; N.A., not applicable; TPC, total phenolics content; UHPLC-MS/MS: ultrahigh-performance liquid chromatography–mass spectrometry/mass spectrometry.
- ∗: Fr: Fraction.
- ∗∗: g GAE/kg.
- ∗∗∗: (g/kg isolate).
Six fractions (Fr C, D, F, H, I, and K), along with the crude extract, were identified to exhibit bioactivities on HepG2 cells, as will be elaborated in the following paragraphs. Therefore, results obtained for the other fractions were excluded to avoid redundancy and overcrowding. Detailed information on UHPLC-MS/MS analysis of phenolics in the crude extract is presented in Table S1. Total ion chromatograms of the crude extract, Fr H, and Fr I are provided as representative examples in Figures S2, S3, and S4, respectively.
Phenolic compounds, due to the presence of one or more hydroxyl groups attached to an aromatic ring in their structure, have the ability to scavenge radicals both in vitro and in vivo. As such, these compounds are primarily recognized for their antioxidant activity. A commonly used method to measure this activity is the radical scavenging capacity against DPPH• radicals. The IC50 value, defined as the concentration of the test sample required to achieve a 50% reduction in the absorbance of a control sample lacking a radical scavenger, is typically used to express radical scavenging activity. A lower IC50 value indicates higher antioxidant or radical scavenging activity.
From Table 2, a strong correlation between antioxidant activity and the total amounts of CA and CL is evident. Additionally, a significant relationship between the TPC value and antioxidant activity is observed. In this regard, Fr H (IC50 of 33.0 μg/mL) and Fr D (IC50 of 45.5 μg/mL) were found to be among the most effective isolates in scavenging DPPH• radicals among all S. dorystaechas samples. The crude extract, which has a more complex matrix of numerous components compared to the fractions, still exhibited reasonable antioxidant activity with an IC50 value of 120.5 μg/mL.
3.2. Apoptotic and Cytotoxic Effects of Plant Isolates on HepG2 Cells Under Varying Treatment Conditions
The apoptotic effects of plant isolates on cells were assessed by measuring caspase-9 and caspase-3 activities, as well as visualizing nuclear changes through DAPI-staining. Cytotoxicity was evaluated using LDH release and MTT assays. These experiments were performed following treatment with plant isolates at various concentrations (12.5, 25, and 50 μg/mL) for 24 and 48 h. For comparison, cells were also treated with 0.1 mM H2O2 as a positive control to evaluate the apoptotic/cytotoxic effects of the plant isolates. Additionally, rosmarinic acid, a phenolic compound identified in S. dorystaechas, was included as a pure test sample due to its phenolic structure.
3.2.1. Assessment of Apoptotic Effects via Caspase-9 and Caspase-3 Activity Induction
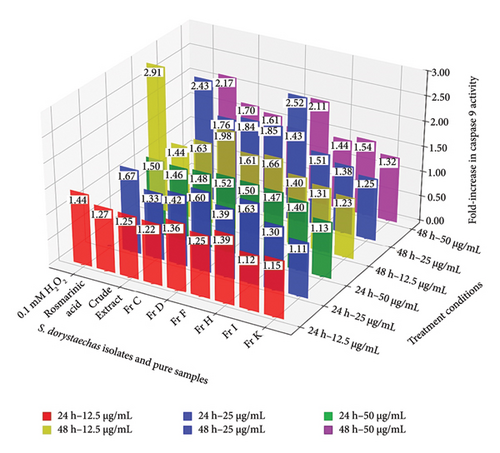
The activation of the caspase cascade is a fundamental event in the execution of apoptosis. Effector caspases, such as caspase-3, are activated by initiator caspases like caspase-9. Following treatment with plant isolates or pure samples (H2O2 and rosmarinic acid) to induce apoptosis, caspase-9 and caspase-3 activities were assessed using colorimetric assays [19, 20]. The caspase-9 activity measured at the end of the treatments increased when the treatment dose in HepG2 cells was raised from 12.5 to 25 μg/mL at both incubation times (24 and 48 h), for most plant isolates and rosmarinic acid, with a few exceptions (Figure 1(a)). However, in most treatments, the caspase-9 activity either decreased or showed minimal change when the concentration was increased to 50 μg/mL, the highest concentration tested, particularly at 48 h, but also at 24 h. Notably, the crude plant extract exhibited its highest caspase-9 activity (1.46) at the highest treatment dose (50 μg/mL) during the 24-h incubation (p < 0.05). On the other hand, Fr D (79.3 g/kg) and Fr H (93.5 g/kg), which contained the highest total amounts of CA/CL among all plant isolates (Table 2), exhibited caspase-9 activities very similar to H2O2 (1.44), with values of 1.36 and 1.39 (p > 0.05), respectively, even at the mildest conditions (12.5 μg/mL and 24 h) (Figure 1(a)). These fractions also demonstrated the highest caspase-9 activities at 25 μg/mL and 24 h, closely resembling the activity of rosmarinic acid (1.67), a hydroxycinnamic acid derivative of caffeic acid, previously reported to induce apoptosis in cervical cancer cells [23]. Fr I and Fr K displayed significantly lower caspase-9 activities compared to the other samples under nearly all conditions. The only significant increase in caspase-9 activity for both extracts was observed with Fr I, at the highest treatment dose (50 μg/mL) for both incubation periods, yielding values of 1.40 (24 h) and 1.54 (48 h). Furthermore, treatment of HepG2 cells with most samples led to higher caspase-9 activities at 48 h compared to 24 h for each corresponding dose (Figure 1(a)). However, Fr C, Fr F, and the crude extract, which contained lower levels of the CA/CL combination compared to Fr D and Fr H (p < 0.05) (Table 2), exhibited higher caspase-9 induction potential at 48 h than the latter two, a finding that contradicted the 24 h results. Specifically, caspase-9 activities induced by Fr C (1.61–1.98) and Fr F (1.66–2.52) appeared to be higher in general than those of Fr D (1.43–1.85) and Fr H (1.40–1.51) during the 48-h incubation. For example, Fr F (with a total CA/CL amount of 26.3 g/kg), which exhibited a caspase-9 activity of 2.52, was as effective as rosmarinic acid (2.43) at 25 μg/mL (p > 0.05) (Figure 1(a)). In conclusion, plant isolates with higher total CA/CL (chemical structures given in Figure S5) content (Fr H and Fr D) were more effective at inducing caspase-9 at lower doses (12.5 and 25 μg/mL) and shorter treatment duration (24 h), whereas isolates with comparatively lower total CA/CL content (Fr C, Fr F, and the crude extract; p < 0.05) (Table 2) were generally more effective at almost all doses during longer treatment duration (48 h) (Figure 1(a)).
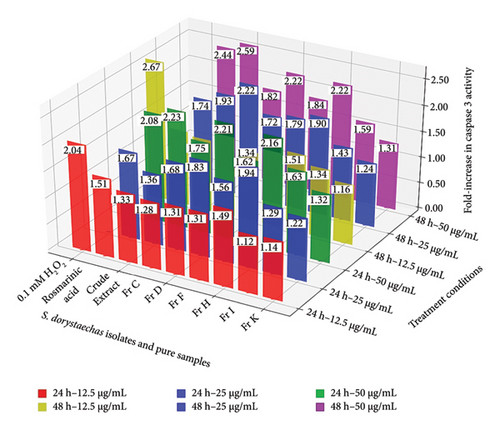
In addition to the aforementioned discussion, the reduction in caspase-9 activity observed in most samples appears to correlate with an increase in caspase-3 activity, which reaches its peak under the harshest condition tested (50 μg/mL at 48 h) (Figure 1(b)). A similar trend was also observed at 50 μg/mL after 24 h of incubation for most samples. This phenomenon may be attributed to caspase-3, the critical apoptotic executor, which likely amplifies signals generated by caspase-9 and/or caspase-8 [24]. However, the key takeaway is that the activity of the effector caspase, caspase-3, was found to be concentration-dependent in HepG2 cells during treatment with nearly all samples across both treatment durations (24 and 48 h) (Figure 1(b)). Fr D (1.31–2.21) and Fr H (1.49–2.16), together with rosmarinic acid (1.51–2.08), demonstrated the highest efficacy in caspase-3 induction among the samples, exhibiting significant activity at nearly all three concentrations under 24-h treatment conditions. Additionally, the caspase-3 activities induced by Fr D (1.83) and Fr H (1.94) at 25 μg/mL treatment dose were found to approach levels comparable to that of H2O2 (2.04) under the same conditions (Figure 1(b)). Conversely, the crude S. dorystaechas extract exhibited a significant increase in caspase-3 activity only at the highest concentration of 50 μg/mL, reaching a value of 2.23 after 24 h of incubation. However, the caspase-3 activities measured in the cells exhibited varying trends with incubation time at each corresponding concentration. For example, the caspase-3 activity values obtained for Fr D, Fr H, and rosmarinic acid at 12.5 and 25 μg/mL showed no significant variation with changes in incubation time. In contrast, activities measured at 50 μg/mL showed significant increases with extended incubation time, but only in the cases of the crude plant extract, Fr F, and rosmarinic acid (Figure 1(b)). Consequently, the samples studied primarily exhibited inconsistent and irregular trends in caspase-3 activity changes as treatment time increased at each corresponding dose. Most importantly, all S. dorystaechas fractions containing varying amounts (26.3–93.5 g/kg) of the combined phenolic abietane diterpenoids (Table 2), CA and CL, exhibited significant caspase-9 and caspase-3 induction effects on the cells, comparable to those induced by the pure test samples, H2O2 and rosmarinic acid (Figure 1). Fr I (TPC of 43.3 g GAE/kg) and particularly Fr K (TPC of 33.4 g GAE/kg), both of which are the only plant isolates devoid of CA and CL (Table 2), induced lower caspase-3 activities in the cells, consistent with the observed caspase-9 activities, in comparison to the other plant isolates under most treatment conditions. The only noticeable increase in caspase-3 activity induced by Fr I was observed at 50 μg/mL, with values of 1.63 (24 h) and 1.59 (48 h), a pattern similar to the one seen for caspase-9 as mentioned earlier (Figure 1). Fr K, which contained the lowest amount of total phenolic compounds as determined by UHPLC-MS/MS analysis (27.6 g/kg, p < 0.05), could not induce significant changes in the activation of either caspase. In this sense, it is helpful to specifically recall from Table 1 that Fr I is composed of mainly rutin (62.4 g/kg), rosmarinic acid (19.5 g/kg), epicatechin (11.1 g/kg), and caftaric acid (4.6 g/kg), and the amounts of these components are much higher than those of the other phenolics detected. However, as just mentioned, it appears to stimulate caspase-9 and caspase-3 activities at significantly lower levels compared to all other CA-/CL-containing plant fractions in most cases. Thus, it seems likely to conclude that the amounts of the individual phenolic compounds in S. dorystaechas isolates have a role in their ability to induce caspase-9/-3 in HepG2 cells, but more importantly, the amount of the type of phenolic compounds existing in that plant isolate has a more pronounced effect in the same context.
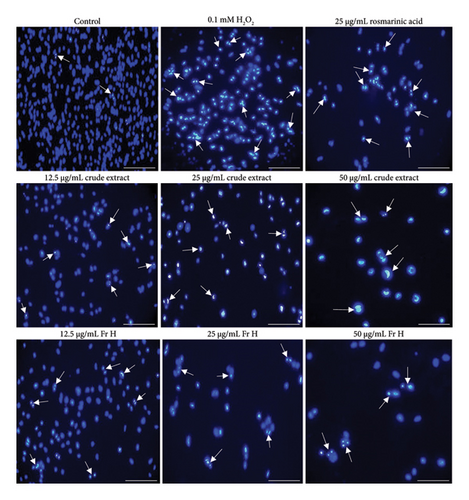
DAPI is a fluorescent dye used to visualize nuclear changes and assess apoptosis in cells. Figure 2 presents DAPI-stained images of HepG2 cells treated with selected S. dorystaechas isolates and pure samples (H2O2 and rosmarinic acid) at specific concentrations during 24 h-treatment. Morphological changes in HepG2 cells were observed as condensed and fragmented nuclei [25], marked by white arrows, which serve as indicators of apoptosis. Notably, it can be observed how effectively Fr H induced apoptosis in the cells as the treatment dose increased at 24 h. In the same sense, the crude plant extract displayed its highest efficacy only at 50 μg/mL, the highest dose tested, during 24 h-incubation, consistent with the caspase-9 and caspase-3 activity results for these two samples, as previously mentioned, under the same experimental conditions. Additionally, images of cells treated with H2O2 (0.1 mM) and rosmarinic acid (25 μg/mL) were included in Figure 2 for comparison purposes.
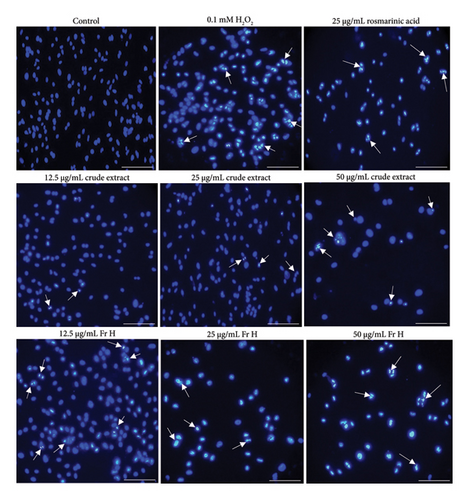
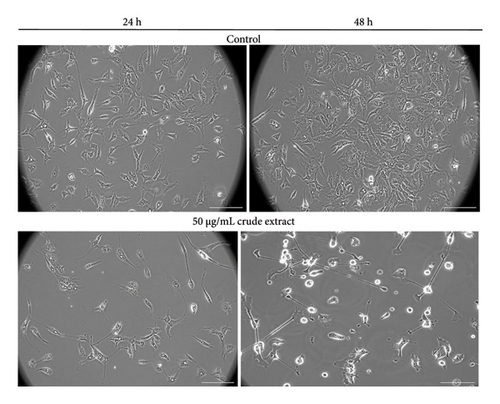
Figure 3, in the same manner as Figure 2, illustrates the impact of the incubation period on cells treated with the crude plant extract and Fr H at 48 h, as a function of concentration change. Morphological changes, such as increased nuclear fragmentation, apoptotic body formation and loss of adhesion [25], which are indicative of apoptosis, along with some cell swelling, reflect the degree of changes occurring as the treatment dose increases over the longest time studied. The distinct morphological alterations in cells treated with the crude S. dorystaechas extract at 50 μg/mL, as incubation time changes, can also be clearly observed in the stain-free images (Figure 4).
All other images of DAPI-stained and stain-free HepG2 cells treated with the plant isolates and pure samples (H2O2 and rosmarinic acid) under various treatment conditions, not presented here, are provided in Figures S6–S14 in the “Supporting Information.”
3.2.2. Assessment of Cytotoxic Effects Using Cell Viability and LDH Release
MTT assay is widely used to measure cellular metabolic activity in response to potential anti-cancer agents as an indicator of cell viability and proliferation. LDH release assay, on the other hand, is based on the measurement of LDH activity in the extracellular medium, as LDH is rapidly released into the culture supernatant upon damage to the plasma membrane. Both viability and LDH release values are common markers of cytotoxicity used in cell culture studies. In this context, Figure 5 shows viability and LDH release percentages of HepG2 cells treated with plant isolates or pure samples under various conditions. Notably, Fr H at a concentration of 12.5 μg/mL and an incubation period of 24 h, which represent the mildest conditions studied, as well as 0.1 mM H2O2 during the same period, displayed the only noticeable effects on the cells in terms of both viability (p < 0.05) and LDH release (p < 0.01) percentages. The measured viability and LDH release percentages under these conditions ranged between 72.3% and 77.2% and between 6.2% and 10.0%, respectively, for the two samples. Viability values obtained for most samples studied were observed to be concentration-dependent during 24 h of treatment, with the most pronounced decreases noted for rosmarinic acid, Fr H, Fr D, and the crude plant extract at concentrations of 25 and 50 μg/mL, surpassing even the effects of 0.1 mM H2O2 (p < 0.05) (Figure 5(a)). Among all samples, these four exhibited the highest potential for inhibiting cell proliferation at 50 μg/mL during 24 h of treatment, with viability values ranging from 41.1% to 55.2%. LDH release, on the other hand, was significantly elevated only at the highest concentration studied (50 μg/mL) for the plant isolates during the same treatment period, with values ranging from 36.0% to 55.8% (Figure 5(b)). Notably, the crude plant extract exhibited the highest cytotoxicity among all samples, as determined by the LDH assay, releasing LDH into the culture medium at a level of 65.4% at 50 μg/mL following 24 h of treatment (p < 0.05).
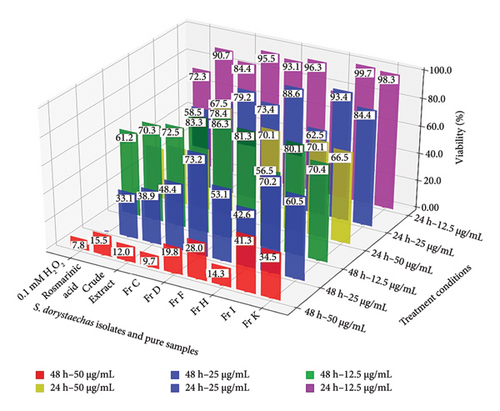
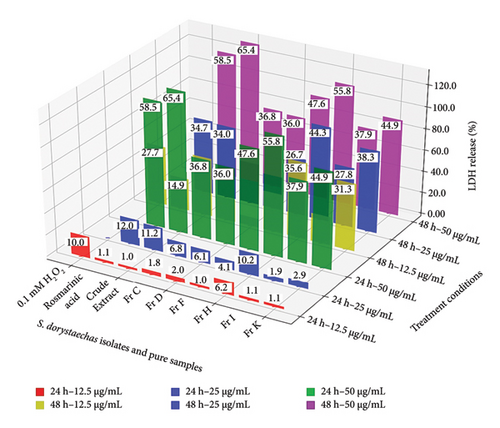
Certainly, viabilities at each corresponding concentration were observed to decrease, when cells were incubated with the samples for twice the duration, i.e., 48 h (Figure 5(a)). However, the increases in LDH release percentages were less pronounced compared to the decreases in proliferation (Figure 5(b)). Morphological changes, such as cell shrinkage, loss of adhesion characterized by rounding off from the surface, and/or intense nuclear condensation, were also evident when cells were treated with most samples at increased concentrations for 48 h (Figures 3 and S6–S14). The lower extent in LDH release exhibited by most samples in change of treatment time from 24 to 48 h at the lowest dose studied (12.5 μg/mL), along with the notable caspase-9 (Figure 1(a)) and caspase-3 (Figure 1(b)) activity values under the same conditions, may suggest apoptotic cell death at low treatment doses rather than a necrotic event, even at 48 h. This is further supported by irregular values deviating from consistent activity trends in both caspases for most samples, especially at the highest dose (50 μg/mL) and the longest incubation period (48 h), as previously mentioned. However, it is not appropriate to draw definitive conclusions about the mechanism of cell death in this study and under these conditions.
3.3. 3.4. Superoxide (O2•−)− Production via NOXs
ROS production is known to contribute to mitochondrial dysfunction and oxidative stress [26]. Evidence suggests that polyphenols may exhibit prooxidant activity, either through electron transport across mitochondrial membranes or via NOXs [27–30]. O2•− is among the commonly studied ROS which is often detected by NBT reduction assay and serves as a key indicator. Notably, the involvement of NOX in ROS generation is frequently assessed using DPI, a flavin-containing oxidase enzyme inhibitor, which significantly reduces O2•− levels. To evaluate the involvement of O2•− production by NOXs during treatment with S. dorystaechas isolates, cells were treated with selected samples at a final concentration of 25 μg/mL, including rosmarinic acid for comparison. DPI, the NOX inhibitor employed, was found to reduce O2•− formation by 56.1%, 48.6%, 36.3%, and 31.3% compared to DPI-free treatments in the cases of rosmarinic acid, Fr H, the crude extract, and Fr C, respectively (Figure 6(a)). Notably, DPI did not significantly alter the signal when cells were treated with Fr K or Fr I, indicating the ineffectiveness of these fractions on inducing NOX (p ≪ 0.01). Among the plant fractions selected for this assay, Fr C, Fr F, and Fr H, which were determined to contain significant amounts of the phenolic diterpenoids CA and CL (Table 2), as well as the crude plant extract and rosmarinic acid, were successful in enhancing O2•− generation in a time-dependent manner (Figure 6(b)). However, concentration dependency was not evaluated in this study. On the other hand, the increases in ROS formation were seen to decrease beyond a point, for most samples. This probably originates from the fact that mitochondria have the highest levels of antioxidants in the cell and play an important role in the maintenance of cellular redox status, thereby acting as a ROS and redox sink limiting NOX activity [11]. Actually, O2•− is rapidly reduced, both spontaneously and enzymatically to H2O2, and unlike O2•−, H2O2 has no net charge [28], rendering it more favorable.
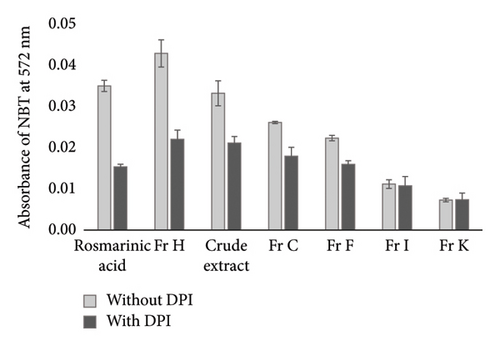
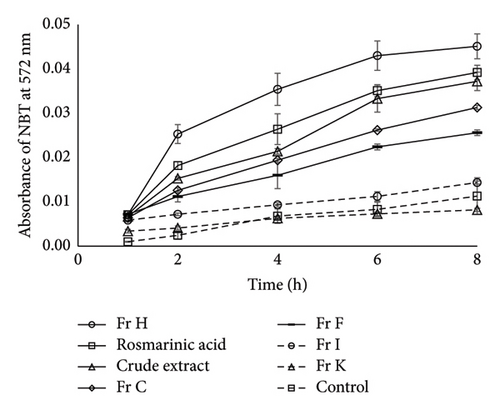
In light of the above findings, specific polyphenols such as CA and CL, or molecules like epicatechin, quercetin, and rutin in significant amounts, may act as prooxidants rather than antioxidants, contributing to the formation ROS in cellular systems. For instance, previous studies have demonstrated that H2O2 concentrations increased with quercetin concentrations ranging from 25 to 200 μM in human lymphocytes [31], indicating that, under certain conditions, the prooxidant effects of some flavonoids may dominate their antioxidant properties. Consistent with this, quercetin, which was detected in concentrations of 3.2–32.9 g/kg in CA-/CL-containing fractions (Table 1), could also contribute to the observed cytotoxic/apoptotic effects of these fractions, as the prooxidative potential of the compound becomes predominant at such elevated concentrations.
Furthermore, the data presented above are consistent with previous findings suggesting that polyphenolic compounds can induce apoptotic behavior in HepG2 cells through NOX pathways [32] and the mitochondrial electron transport chain. Specifically, the association of CA-induced apoptosis with oxidative stress-mediated mitochondrial pathways in the HepG2 cell line has been previously reported [33], supporting the anti-hepatocellular carcinoma properties of this compound. Moreover, recent studies revealed that CA significantly inhibits cell proliferation, increases apoptosis, and induces vacuole formation at a very low dose (10 μM), further supporting its anticancer effects on HepG2 cells [34].
4. Conclusion
In the present study, the fractions obtained from S. dorystaechas were found to contain phenolic-type abietane diterpenoids, carnosic acid (CA) and carnosol (CL), in significant total quantities (26.3–93.5 g/kg fraction), as well as other phenolic compounds, some of which were detected in noteworthy amounts. Fractionation through chromatography enabled the isolation of CA-/CL-rich fractions from the plant, with remarkably higher concentrations compared to the crude extract (10.0 g/kg extract; p < 0.01).
Fractions rich in the combined total amounts of CA and CL effectively induced caspase-9 and caspase-3 activity, while also increasing cytotoxicity, as assessed by cell viability and LDH release, in HepG2 cells. These effects were notable when compared to those induced by H2O2. Based on DAPI-stained cell images and other experimental results, substantial levels of CA and CL appear to promote apoptotic effects under relatively milder treatment conditions. In contrast, the crude S. dorystaechas extract exhibited its most pronounced apoptotic potential under harsher treatment conditions.
Additionally, most fractions displayed a dose- and time-dependent increase in apoptotic and cytotoxic effects. However, deviations from these consistent trends were observed, particularly at the highest treatment dose and extended incubation period.
Interestingly, treatment with selected S. dorystaechas isolates containing CA/CL combinations suggested the involvement of O2•− production mediated by NOXs. Nonetheless, the current data are insufficient to conclusively determine the exact cell death pathways involved, necessitating further investigation.
In conclusion, the significant amounts of diterpenoidic phenolic compounds, CA and CL, detected in S. dorystaechas isolates are likely the primary contributors to the apoptotic potential observed in the HepG2 liver hepatoma cell line. Additionally, the considerable contributions of other individual phenolic components should not be underestimated.
Conflicts of Interest
The authors declare no conflicts of interest.
Funding
The research was supported by Akdeniz Üniversitesi ∗ FBA-2020-5029.
Acknowledgments
This work was supported by the Scientific Research Projects Unit of Akdeniz University (Grant number: FBA-2020-5029).
Supporting Information
Figure S1: Flowchart of chromatographic steps in isolation of fractions from S. dorystaechas.
Figure S2: Predominant phenolics of S. dorystaechas extract determined by UHPLC-MS/MS. UHPLC-MS/MS: Ultra-high-performance liquid chromatography–mass spectrometry/mass spectrometry.
Figure S3: Predominant phenolics of Fr H from S. dorystaechas extract determined by UHPLC-MS/MS. UHPLC-MS/MS: Ultrahigh-performance liquid chromatography–mass spectrometry/mass spectrometry.
Figure S4: Predominant phenolics of Fr I from S. dorystaechas extract determined by UHPLC-MS/MS. UHPLC-MS/MS: Ultrahigh-performance liquid chromatography–mass spectrometry/mass spectrometry.
Figure S5: Chemical structures of carnosic acid (CA) and carnosol (CL).
Figure S6: Phase-contrast images of HepG2 cells treated with Fr K from S. dorystaechas under various conditions. Images were taken at 25x magnification with a 50 μm scale bar.
Figure S7: DAPI-stained and phase-contrast images of HepG2 cells treated with Fr I from S. dorystaechas under various conditions. Images were taken at 25x magnification with a 50 μm scale bar.
Figure S8: DAPI-stained and phase-contrast images of HepG2 cells treated with Fr C from S. dorystaechas under various conditions. Images were taken at 25x magnification with a 50 μm scale bar.
Figure S9: DAPI-stained and phase-contrast images of HepG2 cells treated with Fr D from S. dorystaechas under various conditions. Images were taken at 25x magnification with a 50-μm scale bar.
Figure S10: DAPI-stained and phase-contrast images of HepG2 cells treated with Fr F from S. dorystaechas under various conditions. Images were taken at 25x magnification with a 50-μm scale bar.
Figure S11: Phase-contrast images of HepG2 cells treated with 0.1 mM H2O2 during 24 and 48 h. Images were taken at 25x magnification with a 50-μm scale bar.
Figure S12: DAPI-stained and phase-contrast images of HepG2 cells in case of treatment with rosmarinic acid under various conditions. Images were taken at 25x magnification with a 50-μm scale bar.
Figure S13: Phase-contrast images of HepG2 cells in case of treatment with S. dorystaechas extract under various conditions. Images were taken at 25x magnification with a 50-μm scale bar.
Figure S14: Phase-contrast images of HepG2 cells treated with Fr H from S. dorystaechas under various conditions. Images were taken at 25x magnification with a 50-μm scale bar.
Table S1: Information on UHPLC-MS/MS analysis of phenolics in S. dorystaechas crude extract.
Table S2: Standard deviation (STD) values for caspase-9 and caspase-3 activities of HepG2 incubated with S. dorystaechas isolates under various conditions.
Table S3: Standard deviation (STD) values for viability and LDH release percentages of HepG2 incubated with S. dorystaechas isolates under various conditions.
Open Research
Data Availability Statement
The data that support the findings of this study are available in the Supporting material of this article.


