The Effects of Bitter Melon (Mormordica charantia) on Weight Loss and Body Composition: A Systematic Review and Dose-Response Meta-Analysis of Randomized Controlled Trials
Abstract
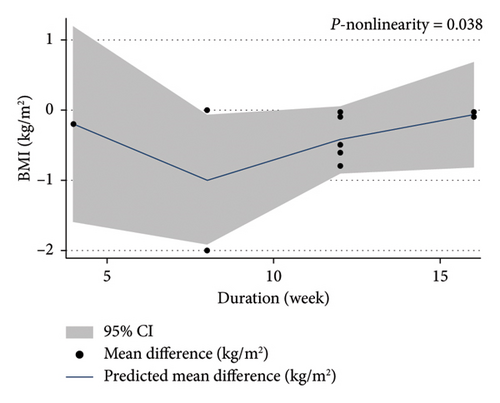
Results from the clinical research about Momordica charantia (MC) benefits on weight loss have been contradictory. This study, which included the most available randomized placebo-controlled trials (RCTs), was the first to investigate the impact of MC supplementation on body weight and composition. The effects of the given MC on weight, body mass index (BMI), waist circumference (WC), and percentage of body fat (PBF) were examined in RCTs up to February 2023 (without limitation on release date). Online databases (PubMed/Medline, Google Scholar, Scopus, and Web of Science) were searched for these studies. The inclusion and exclusion criteria were followed in the screening and evaluation of the literature. The Cochrane tool was used to assess bias risk. There were a total of ten RCTs, including 448 participants. The meta-analysis revealed that MC supplementation had no effect on weight (weighted mean difference (WMD): 0.04 kg; 95% confidence interval ([CI]: −0.16 to 0.25; p = 0.66), BMI (WMD: −0.18 kg/m2; 95% CI: −0.43 to 0.25; p = 0.16), WC (WMD: −0.94 cm; 95% CI: −3.04 to 1.16; p = 0.37), and BFP (WMD: −0.99; 95% CI: −2.33 to 0.35; p = 0.14). According to the subgroup analysis, MC could lower the BMI at a dosage of ≤ 2000 mg/d when compared to a placebo group (p<0.001). The dose-response analysis represented a significant nonlinear connection between the MC dosage and weight reduction (Pnon−linearity = 0.011); the effect on weight loss was observed the most at doses of 2000 and 4500 mg. Moreover, MC consumption decreased the BMI by the sixth week and then increased the BMI up to the 17th week (Pnonlinearity = 0.03). Our results indicate that MC consumption can reduce the BMI in some dosages and duration of supplementation.
1. Introduction
The condition of obesity refers to excess fat being stored in the body that is harmful to health [1]. The obesity epidemic is contributing to an increase in certain types of cancer, hypertension, fatty liver disease, and Type 2 diabetes mellitus (T2DM) among other diseases [2]. Furthermore, both life expectancy and quality of life are adversely affected by obesity. The World Health Organization (WHO) report estimates that being overweight or obese will decrease the health of over 167 million people and children by 2025 [1].
For obese people, a healthier diet and a more active lifestyle are the first-line treatments [3]. As a component of complementary and alternative medicine, herbal treatments are increasingly being utilized to treat obesity because of their proven ability to hasten weight loss [4–7]. A hundred and fifty species of plants, out of the 21,000 used commercially for medicinal purposes globally, are utilized in medicine, according to the WHO report [8]; however, their efficacy is still unknown in most cases.
A tropical plant species in the Cucurbitaceae family known as Momordica charantia (MC) is widely cultivated in Asia, South America, and East Africa [9, 10]. Researchers have reported that MC has antidiabetic, antioxidant, antiviral, anti-inflammatory, antimutagenic, and cholesterol-lowering properties [10–12]. Additionally, MC’s antiobesity activity and associated mechanisms have been reported in in vitro and animal studies [13–17]. It has been shown in some studies that MC supplements can significantly reduce weight and body mass index (BMI) [18, 19], and in some studies, it has not had a significant effect [20–23]. The current study contains a significantly higher number of trials and anthropometric measurements than Phimarn’s previous meta-analysis [24]. Our results are completely different from those of the previous meta-analyses, which showed that MC supplements can lead to 3.45 kg weight loss when compared to control groups. Several subgroup analyses were undertaken in the present study to address these issues, and the results showed that MC supplementation did not significantly reduce weight and other anthropometric measures. This systematic review and meta-analysis used a highly sensitive search technique and included a large number of RCTs to evaluate the effects of MC supplementation on body composition and weight.
2. Methods
The results of this comprehensive meta-analysis were presented in adherence with the systematic review and meta-analysis (PRISMA) guidelines [25], as outlined in the Supporting Table 1. Furthermore, the protocol for this study has been registered with PROSPERO under the registration number CRD42023428026.
2.1. Search Strategy
The relevant studies were identified through an extensive and methodical search across major medical databases, including PubMed/Medline, Scopus, Web of Science, and Google Scholar. This search process was carried out from the initial stages of the project up until February 2023. The MESH and non-MESH terms applied included the following: (“Momordica charantia” [tiab] OR “bitter melon” [tiab] OR Karelas [tiab] OR Karela [tiab] OR “Momordica charantia” [Mesh]) AND (“Body Weight” [tiab] OR BMI [tiab] OR “Body Mass Index” [tiab] OR “Weight Loss” [tiab] OR “Waist Circumference” [tiab] OR Obesity [tiab] OR overweight [tiab] OR “fat mass” [tiab] OR “Body Fat” [tiab] OR “Waist-to-Hip Ratio” [tiab] OR “Body Weight” [Mesh] OR “Weight Loss” [Mesh] OR “Body Mass Index” [Mesh] OR Obesity [Mesh] OR “Waist Circumference” [Mesh]) AND (intervention [tiab] OR RCT [tiab] OR randomized [tiab] OR random [tiab] OR Randomly [tiab] OR Placebo [tiab] OR trial [tiab] OR trials [tiab] OR randomized [tiab] OR “Double-Blind” [tiab] OR Cross-Over [tiab] OR “Placebos” [Mesh] OR “Cross-Over Studies” [Mesh]) (Supporting Table 2). No restrictions were placed on the language or publication date of the studies. Additionally, to ensure no relevant articles were missed, the reference lists of all pertinent studies were manually reviewed, including those from review articles published in major journals.
2.2. Eligibility Criteria
Two researchers (C.A. and M.A.) conducted a comprehensive online database search to identify potentially relevant clinical trials. The criteria used to determine study eligibility were as follows: (1) the study participants were adults aged 18 years or older, (2) the study evaluated the impact of oral bitter melon supplementation on at least one of the following outcomes: body weight, BMI, waist circumference (WC), or percentage of body fat (PBF), and (3) the study employed a RCT design, either parallel or crossover, and compared bitter melon to a placebo group. Studies were excluded if they were cross-sectional, case-control, or cohort studies, conference abstracts, letters, or involved lactating women, children, or pregnant individuals. Furthermore, studies were also excluded if the changes in the outcome measures were not clearly reported or were reported inappropriately.
2.3. Data Extraction
Two researchers independently evaluated the titles and abstracts to identify and eliminate irrelevant studies. For the included trials, the following information was extracted: average age and gender of participants, study design (crossover or parallel), author names, health status of participants, year of publication, duration of intervention, details of intervention such as bitter melon dosage and type, location of study, and the number of participants in the intervention and placebo groups. The data were standardized and organized in a spreadsheet, which included the mean ± standard deviation (SD) and/or changes in the outcome measures, such as weight, BMI, WC, and PBF, before and after the intervention, for both the intervention and control groups. Any discrepancies in the units of measurement were converted to the most commonly used units.
2.4. Risk of Bias
To evaluate the quality of the included studies, the updated Cochrane risk-of-bias tool for randomized trials (RoB 2) was employed (as shown in Table 1) [25]. Two researchers, M.R.A. and C.A., completed the RoB 2 checklist for each eligible study. The checklist assesses five key domains: the randomization process, deviations from the intended intervention, missing outcome data, measurement of the outcomes, and the selection of the reported results. Based on these domains, each study was classified into one of the three risk of bias categories: low risk, some concerns, or high risk. A strong agreement was indicated by Cohen’s kappa of 0.72 between the two researchers’ (M.R.A. and C.A.) assessments.
| Publications | Randomization process | Deviations from the intended interventions | Missing outcome data | Measurement of the outcome | Selection of the reported result | Overall bias |
|---|---|---|---|---|---|---|
| 1. Cortez-Navarrete et al. [32] | L | L | L | L | L | L |
| 2. Cortez-Navarrete et al. [18] | L | L | L | L | L | L |
| 3. Kumari et al. [23] | L | S | L | L | L | S |
| 4. Soo May et al. [19] | L | S | L | L | L | S |
| 5. Yang et al. [26] | L | L | L | L | L | L |
| 6. Zänker et al. [27] | L | L | L | L | L | L |
| 7. Dans et al. [20] | L | L | L | L | L | L |
| 8. Kinoshita and Ogata [21] | L | L | L | L | L | L |
| 9. Krawinkel et al. [22] | L | S | L | L | L | S |
| 10. Trakoon-osot et al. [28] | L | L | L | L | L | L |
- Note: H, high risk of bias; L, low risk of bias; S, some concerns.
2.5. Statistical Analysis
Stata software was used for the statistical analysis. The mean differences in weight, BMI, WC, and BFP were used to calculate the overall effect size with the DerSimonian and Laird random-effects model. Adjustments were made to account for unreported SDs. Due to the small number of included studies for each factor, we used the Hartung–Knapp adjustment [29]. To ascertain the degree of heterogeneity among the outcomes of the included trials, we used the I-square (I2) test at a significance level of p < 0.10. Subgroup analyses explored potential sources of heterogeneity based on factors such as dosage, duration, age, health status, and country. Sensitivity analyses evaluated the impact of individual studies on the overall effect. Fractional polynomial modeling examined nonlinear effects of duration and dosage on outcomes. Publication bias was checked using Egger’s test. The overall effect sizes were reported as weighted mean differences (WMDs) with 95% confidence intervals (CIs) [30].
2.6. Certainty Assessment
Based on the standards developed by the Grading of Recommendations Assessment, Development, and Evaluation (GRADE) Working Group, the evidence from randomized controlled trials was ranked. Four categories of evidence quality were identified based on the the following criteria: high, moderate, low, and very low [31].
3. Results
3.1. Study Selection
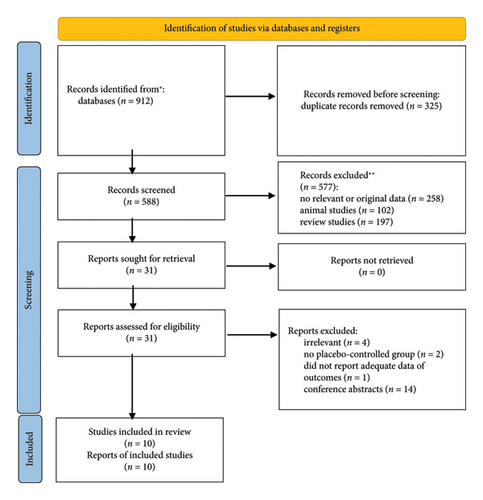
From the primary databases, a total of 913 citations were initially identified. After removing 325 duplicate entries, the remaining articles were further evaluated. As summarized in Figure 1, the examination of titles and abstracts led to the exclusion of 577 studies. The full texts of the remaining 31 trials were then reviewed, which resulted in the exclusion of another 21 articles due to the following reasons: irrelevance (n = 4), lack of a placebo-control group (n = 2), insufficient data on the outcomes (n = 1), and being conference abstracts (n = 14). Ultimately, 10 RCTs were included in the final quantitative analysis.
3.2. Study Characteristics
Table 2 summarizes the general characteristics of the 10 eligible trials included in the analysis. A total of 448 participants were involved across these studies. The included articles were published between 2007 and 2022, and the studies were conducted in various countries: Mexico [18, 32], India [23], Malaysia [19], Taiwan [26], Germany [27], Philippines [20], Japan [21], Tanzania [22], and Thailand [28]. The mean age of the participants ranged from 45 to 62.5 years. The duration of the interventions varied from 4 to 16 weeks, and the daily bitter melon consumption dosage ranged from 100 to 6000 mg. The baseline BMI of the participants fell between 23.5 and 32.2 kg/m2, and all the trials included both male and female subjects.
| First author (year) | Location | Study design | Health status | Sex | Sample size (male/female) | Duration (week) | Mean age (year) | Baseline BMI (kg/m2) | Intervention group | Adverse events | Comparator group | Outcome | |
|---|---|---|---|---|---|---|---|---|---|---|---|---|---|
| Yes | No | ||||||||||||
| 1. Cortez-Navarrete et al. (2022) | Mexico | RCT | Patients with obesity | Both | 24 (5/19) | 12 | 48 ± 8.2 | 32.2 | 2000 mg Momordica charantia (bitter melon) | No | Placebo | Weight/BMI/WC/PBF | |
| 2. Cortez-Navarrete et al. (2018) | Mexico | RCT | T2DM | Both | 24 (8/16) | 12 | 48.5 ± 7.3 | 28.9 | 2000 mg Momordica charantia (bitter melon) | No | Placebo | Weight/BMI/WC/PBF | |
| 3. Kumari et al. (2018) | India | RCT | T2DM | Both | 50 (NA) | 8 | 50 | 27.6 | 1000 mg Momordica charantia (bitter melon) | No | Placebo | BMI | |
| 4. Soo May et al. (2018) | Malaysia | RCT | Primary knee osteoarthritis | Both | 75 (24/51) | 12 | 59.8 ± 9.17 | 27.6 | 4500 mg Momordica charantia (bitter melon) supplementation | No | Placebo | Weight/BMI | |
| 5. Yang et al. (2022) | Taiwan | RCT | T2DM | Both | 40 (11/29) | 12 | 58.4 ± 13.1 | 26.1 | 600 mg Momordica charantia insulin receptor binding Peptide-19 (mcIRBP-19) | No | Placebo | Weight/BMI/WC/PBF | |
| 6. Zänker et al. (2012) | Germany | RCT | T2DM | Both | 62 (44/18) | 16 | 62.6 ± 7.85 | 29.7 | 1000 mg Momordica charantia (bitter melon) | No | Placebo | Weight/BMI/WC | |
| 7. Dans et al. (2007) | Philippines | RCT | T2DM | Both | 40 (15/25) | 12 | 59.2 ± 9.86 | 26.2 | 3000 mg Momordica charantia (bitter melon) | No | Placebo | BMI | |
| 8. Kinoshita et al. (2018) | Japan | RCT | Healthy | Both | 43 (19/24) | 4 | 56 ± 7.90 | 23.5 | 100 mg of bitter melon extract, approximately equivalent to 3000 mg of melon | No | Placebo | Weight/BMI | |
| 9. Krawinkel et al. (2018) | Tanzania | RCT | Prediabetic individuals | Both | 52 (NA) | 8 | 47.5 ± 8.70 | 29.6 | 2500 mg Momordica charantia (bitter melon) | No | Placebo | BMI | |
| 10. Trakoon-osot et al. (2013) | Thailand | RCT | T2DM | Both | 38 (11/27) | 16 | 58 ± 7.90 | 25.1 | 6000 mg Momordica charantia (bitter melon) | No | Placebo | Weight/BMI | |
- Abbreviations: BMI, body mass index; PBF, percentage body fat; RCT, randomized controlled trial; T2DM, Type 2 diabetes mellitus; WC, waist circumference.
3.3. Quality Evaluation of Trials
Every included paper described the randomization procedure in detail. Seven trials had a low risk of bias deviations from the intended interventions, while three other publications raised some concerns. Missing outcome data have shown in every study. A low risk of bias was the selection of the reported result in every 10 studies. Based on an overall assessment of the risk of bias, seven articles showed an unclear risk of bias, while three studies showed a low risk of bias.
3.4. Effect of Bitter Melon Intervention on Weight
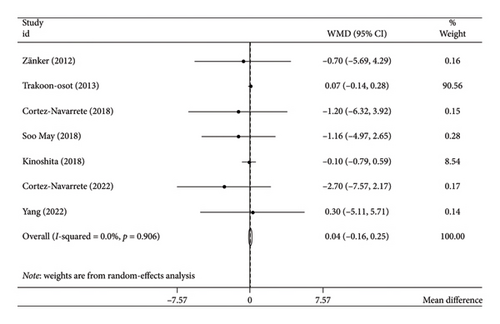
The analysis employing the random-effects model demonstrated that bitter melon consumption did not have a statistically significant impact on body weight (WMD: 0.04 kg; 95% CI: −0.16 to 0.25; p = 0.66) (Figure 2). There was no evidence of heterogeneity among the included studies (I2 = 0.0%, tau2 < 0.001, p = 0.96) (Table 3). Furthermore, the subgroup analyses did not reveal any alterations in the pooled results.
| Group | No. of trials | WMD (95% CI) | p value | I2 (%) | P-heterogeneity | p for between subgroup heterogeneity |
|---|---|---|---|---|---|---|
| Weight | ||||||
| Pooled-effect size | 7 | 0.04 (−0.16, 0.25) | 0.664 | 0.0 | 0.906 | — |
| Duration (week) | 0.667 | |||||
| ≤ 8 | 1 | −0.10 (−0.79, 0.59) | 0.776 | — | — | |
| > 8 | 6 | 0.06 (−0.15, 0.27) | 0.589 | 0.0 | 0.854 | |
| Dose (mg/day) | 0.357 | |||||
| ≤ 2000 | 4 | −1.15 (−3.69, 1.40) | 0.377 | 0.0 | 0.874 | |
| > 2000 | 3 | 0.05 (−0.15, 0.25) | 0.613 | 0.0 | 0.739 | |
| Mean age | 0.259 | |||||
| ≤ 50 | 2 | −1.99 (−5.52, 1.54) | 0.270 | 0.0 | 0.678 | |
| > 50 | 5 | 0.05 (−0.15, 0.25) | 0.619 | 0.0 | 0.951 | |
| Health status | 0.448 | |||||
| T2DM and prediabetic | 4 | 0.07 (−0.14, 0.28) | 0.534 | 0.0 | 0.954 | |
| Nondiabetic | 3 | −0.18 (−0.85, 0.49) | 0.595 | 0.0 | 0.514 | |
| Country | 0.506 | |||||
| Asia | 4 | 0.05 (−0.15, 0.25) | 0.611 | 0.0 | 0.894 | |
| North America | 2 | −1.99 (−5.52, 1.54) | 0.270 | 0.0 | 0.678 | |
| Europe | 1 | −0.70 (−5.69, 4.29) | 0.783 | — | — | |
| BMI | ||||||
| Pooled-effect size | 10 | −0.18 (−0.43, 0.07) | 0.161 | 55.5 | 0.017 | — |
| Duration (week) | 0.683 | |||||
| ≤ 8 | 3 | −0.04 (−0.23, 0.16) | 0.723 | 59.6 | 0.084 | |
| > 8 | 7 | 0.01 (−0.07, 0.09) | 0.832 | 60.2 | 0.020 | |
| Dose (mg/day) | < 0.001 | |||||
| ≤ 2000 | 5 | −1.11 (−1.72, −0.51) | < 0.001 | 15.7 | 0.315 | |
| > 2000 | 5 | 0.02 (−0.06, 0.10) | 0.599 | 0.0 | 0.738 | |
| Mean age | 0.272 | |||||
| ≤ 50 | 4 | −0.15 (−0.42, 0.13) | 0.299 | 82.6 | 0.001 | |
| > 50 | 6 | 0.01 (−0.07, 0.09) | 0.832 | 0.0 | 0.880 | |
| Health status | 0.050 | |||||
| T2DM and prediabetic | 7 | 0.03 (−0.05, 0.11) | 0.516 | 0.0 | 0.426 | |
| Nondiabetic | 3 | −0.24 (−0.49, 0.01) | 0.064 | 80.7 | 0.006 | |
| Country | 0.003 | |||||
| Asia | 6 | 0.01 (−0.07, 0.09) | 0.786 | 15.2 | 0.316 | |
| North America | 2 | −1.43 (−2.21, −0.66) | < 0.001 | 0.0 | 0.448 | |
| Africa | 1 | 0.10 (−0.20, 0.40) | 0.512 | — | — | |
| Europe | 1 | −0.20 (−1.88, 1.48) | 0.815 | — | — | |
| WC | ||||||
| Pooled-effect size | 4 | −0.94 (−3.04, 1.16) | 0.379 | 0.0 | 0.883 | — |
| Mean age | 0.651 | |||||
| ≤ 50 | 2 | −1.47 (−4.57, 1.63) | 0.354 | 0.0 | 0.523 | |
| > 50 | 2 | −0.50 (−3.35, 2.36) | 0.734 | 0.0 | 0.837 | |
| Health status | 0.928 | |||||
| T2DM and prediabetic | 3 | −1.01 (−3.56, 1.54) | 0.437 | 0.0 | 0.723 | |
| Nondiabetic | 1 | −0.80 (−4.52, 2.92) | 0.673 | — | — | |
| Country | 0.884 | |||||
| Asia | 1 | −0.20 (−4.21, 3.81) | 0.922 | — | — | |
| North America | 2 | −1.47 (−4.57, 1.63) | 0.353 | 0.0 | 0.523 | |
| Europe | 1 | −0.80 (−4.87, 3.27) | 0.700 | — | — | |
- Abbreviations: BMI, body mass index; T2DM, Type 2 diabetes mellitus; WC, waist circumference; WMD, weight mean difference.
Considering the limited number of primary studies included in the investigation, we applied the Hartung–Knapp adjustment; however, the outcomes remained unchanged (WMD: 0.04 kg; 95% CI: −0.20 to 0.29; p = 0.68).
3.5. Effect of Bitter Melon Intervention on BMI
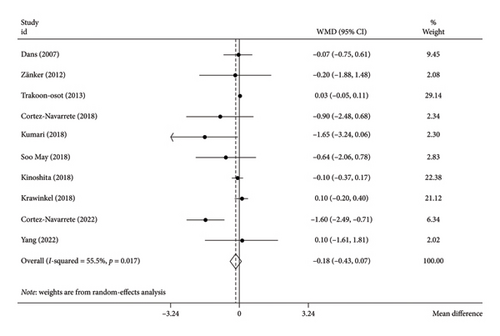
The analysis using the random-effects model revealed that bitter melon consumption did not significantly impact the BMI (WMD: −0.18 kg/m2; 95% CI: −0.43 to 0.25; p = 0.16) (Figure 3). However, there was a moderate level of heterogeneity among the included studies (I2 = 55.5%, tau2 = 0.05, p = 0.01). The Hartung–Knapp adjustment was necessary due to the limited number of included studies; nonetheless, it did not alter the outcomes (WMD: −0.30 kg/m2; 95% CI: −0.74 to 0.13; p = 0.14). The subgroup analysis indicated that bitter melon at a dosage ≤ 2000 mg/d compared to the placebo group (WMD: −1.11 kg/m2; 95% CI: −1.72 to −0.51; p < 0.001), and also residing in North America (WMD: −1.43 kg/m2; 95% CI: −2.21 to −0.66; p < 0.001) could potentially reduce the BMI (Table 3).
3.6. Effect of Bitter Melon Consumption on WC
The random-effects model analysis revealed that bitter melon consumption had no significant effect on WC compared to the placebo group (WMD: −0.94 cm; 95% CI: −3.04 to 1.16; p = 0.37) (Figure 4). There was no evidence of heterogeneity among the included studies (I2 = 0.0%, tau2 = < 0.001, p = 0.88). Our findings were unaffected by the Hartung–Knapp adjustment since the analysis did not include enough primary studies (WMD: −0.94 cm; 95% CI: −4.35 to 2.46; p = 0.44).
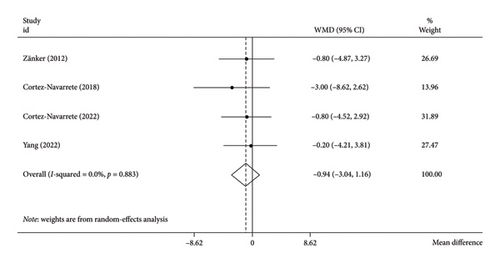
Additionally, the subgroup analyses did not result in any changes to the pooled results (Table 3).
3.7. Effect of Bitter Melon Consumption on PBF
Bitter melon did not significantly affect PBF alteration when compared to the placebo group (WMD: −0.99; 95% CI: −2.33 to 0.35; p = 0.14) (Figure 5), with no degree of heterogeneity (I2 = 13.3%, tau2 = 0.21, p = 0.31).
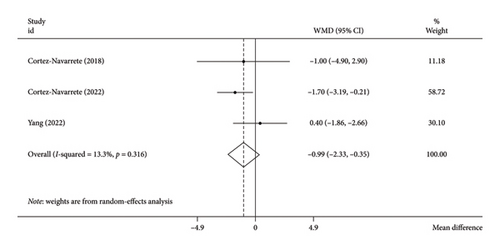
The results were unchanged even after using the Hartung–Knapp correction for the limited number of primary studies included in the study (WMD: −0.92; 95% CI: −4.29 to 2.45; p = 0.36).
3.8. Dose-Response Analysis
We performed a dose-response analysis to examine the effects of bitter melon dosage and intervention duration on the outcomes. This analysis was only significant for weight and BMI.
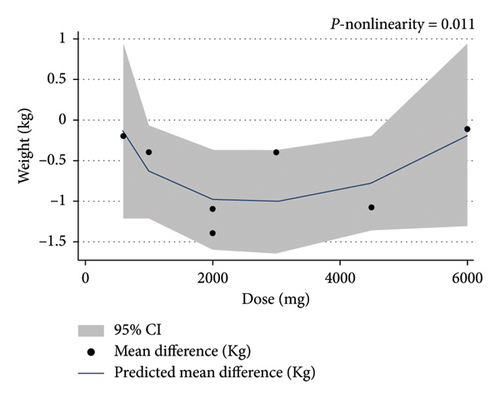
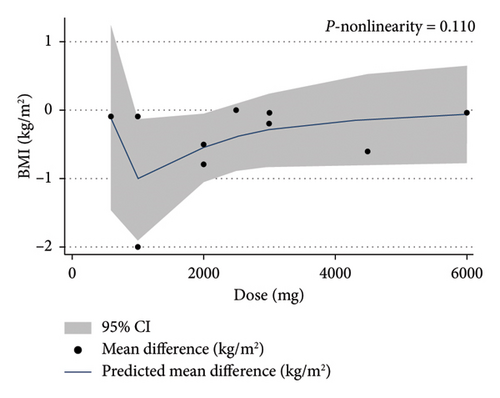
The dose-response analysis revealed a significant nonlinear relationship between bitter melon dosage and weight reduction compared to the placebo group (Pnon−linearity = 0.011). The most pronounced effect on weight loss was observed at doses of 2000–4500 mg (Figure 6). There was also a nonsignificant nonlinear relationship between bitter melon dosage and BMI (Pnon−linearity = 0.11) (Figure 7). Furthermore, a significant nonlinear relationship was found between the duration of bitter melon intervention and BMI (Pnon−linearity = 0.03). Bitter melon consumption decreased the BMI up until the sixth week, and then increased BMI up to the 17th week (Figure 8).
3.9. Sensitivity Analysis
To assess the influence of individual studies, a sensitivity analysis was conducted by sequentially removing each study from the overall analysis. This stepwise removal of studies did not reveal any single study that had a significant impact on the combined effect sizes for weight, BMI, WC, and PBF.
3.10. Publication Bias
Begg’s rank correlation test did not detect any evidence of publication bias for the outcomes of weight (p = 0.88), BMI (p = 0.32), PBF (p = 0.60), and WC (p = 0.17).
3.11. Grading of Evidence
To assess the quality of the evidence for each variable, we used the GRADE criteria. This tool assesses the quality of the included research based on the following criteria: publication bias, indirectness, imprecision, risk of bias, and inconsistency. We determined that the data regarding weight, WC, and PBF were of good quality, and the evidence regarding the BMI was of moderate quality (Table 4).
| Outcomes | Risk of bias | Inconsistency | Indirectness | Imprecision | Publication bias | Quality of evidence |
|---|---|---|---|---|---|---|
| Weight | No serious limitations | No serious limitations | No serious limitations | No serious limitations | No serious limitations |
|
| BMI | No serious limitations | aSerious limitations | No serious limitations | No serious limitations | No serious limitations |
|
| WC | No serious limitations | No serious limitations | No serious limitations | No serious limitations | No serious limitations |
|
| PBF | No serious limitations | No serious limitations | No serious limitations | No serious limitations | No serious limitations |
|
- 1We are moderately confident in the effect estimate: The true effect is likely to be close to the estimate of the effect, but there is a possibility that it is substantially different.
- aRated as serious limitation, based on I2 ranged between 30% and 60% representing moderate heterogeneity.
4. Discussion
We conducted a systematic review and meta-analysis of 10 studies to analyze the impact of bitter melon on several anthropometric parameters including body weight, BMI, WC, and PBF in adults. Our results indicate that bitter melon supplementation effects on the anthropometric metrics are various depending on the dosage and duration of consumption.
Being overweight and obesity are among the major factors leading to chronic diseases, with alarmingly increasing rates around the world [33]. Along with diets, the use of herbal medicines for weight management has been growing due to their affordability and accessibility [34–36]. In line with our findings, intake of an herbal product from the leaves and vines of bitter melon for 8 weeks did not significantly affect the BMI in a group of subjects with secondary dyslipidemia [37]. Another study among healthy overweight men showed that a single-dose administration of freeze-dried bitter melon did not affect energy expenditure and appetite [38]. Results of a randomized trial indicated that two different doses of bitter melon supplementation could not significantly reduce body weight among a group of patients with T2D [39]. In addition, a study conducted by Mohammadmoradi et al. [40] revealed that bitter melon had no effect on body weight in mice fed with a saturated fat–enriched diet. In contrast to our findings, in a previous meta-analysis, Phimarn et al. [24] found a significant reduction in body weight as a result of bitter melon supplementation. This meta-analysis only included three published studies about the effects of better melon consumption on body weight, while we included all the published eligible studies relevant to anthropometric parameters in the current meta-analysis. Furthermore, a significant reduction of WC was detected after 3 months of intervention among participants with metabolic syndrome in an uncontrolled clinical trial [41]. In vivo studies have demonstrated the bitter melon’s favorable effects on reducing fat tissue and weight loss. Bai et al. [42]reported that subcutaneous and perirenal fat decreased in obese rats fed a high-fat diet and bitter melon. Additionally, despite eating the same amount of food as the control group, they did not gain weight [42]. Bitter melon reduced adipose tissue mass and prevented fat aggregation in rats after 9 weeks, according to another animal study [43].
The possible link between polyphenols and obesity has been documented in an increasing amount of studies [44–47]. Flavonoids and phenolic chemicals found in bitter melon have been shown in animal experiments to have antiobesity properties [48]. Uncoupling Proteins (UCP) 1 and 3 can also be expressed more when bitter melon is consumed [18]. Elevated expression of UCP1 in brown adipose tissue (BAT) affects thermogenesis and energy expenditure [49], and UCP3 upregulation is associated with fatty acid oxidation [50]. Another suggested mechanism is that bitter melon supplementation can decrease the mRNA expression of two transcription factors: peroxisome proliferator–activated receptor γ (PPAR) and sterol regulatory element-binding protein 1c (SREBP-1c) and lead to lower adipocyte differentiation and lipogenesis [16]. Another theory for how bitter melon can reduce diet-induced obesity is by reducing the expression of lipogenic genes, such as fatty acid synthase (FAS), lipoprotein lipase (LPL), acetyl-CoA carboxylase-1 (ACC-1), and adipocyte fatty acid–binding protein (aP2), in adipose tissue [43].
The results of our analyses indicated that bitter melon supplementation significantly reduced the BMI when administered in low doses. It should be noted that the discrepancies among the results of the studies might be due to different study designs, sample sizes, participant gender, intervention dosages, forms of bitter melon supplementation (powder, fruit pulp, juice, and extract), and processing procedures. For instance, it can improve the physical properties and bioaccessibility of bitter melon phenolic chemicals [51]. Fermentation is also able to biotransform the bitter melon polysaccharides and thus improves its antiobesity effect [52]. Even the harvest season of bitter melon fruit can be a determining factor in the acquired results. Kolawole et al. [53] reported that the active components of bitter melon accountable for its antidiabetic and hypolipidemic properties differ between seasons of the year.
The current study is a complete, up-to-date systematic review and meta-analysis of the previous research on the impact of bitter melon on body composition metrics. We included all the eligible RCTs published until 2023. We also conducted the subgroup and dose-response analyses in order to find the sources of heterogeneity among studies on the effect of bitter melon on the BMI. Our investigations did not reveal any indication of publication bias based on statistical examinations. Nevertheless, due to the small number of included studies on WC and PBF, the results should be interpreted cautiously. In addition, including clinical trials in our analysis with different forms of bitter melon makes it difficult to investigate which form is more favorable.
5. Conclusion
In conclusion, the present study revealed no significant effect of bitter melon on anthropometric measures, except for studies on the BMI with lower doses of bitter melon supplementation. Further trials using different doses and forms of bitter melon are required to confirm these findings.
Conflicts of Interest
The authors declare no conflicts of interest.
Author Contributions
Mohammad Reza Amini: data curation, formal analysis, and methodology. Sanaz Pourreza: writing – original draft. Camellia Akhgarjand: methodology and writing – original draft. Fatemeh Sheikhhossein: methodology and writing – original draft. Gholamreza Askari: reviewing and editing and formal analysis. Azita Hekmatdoost: supervision and writing – review and editing.
Funding
This study is related to the project No. 1401/59464 from the Student Research Committee, Shahid Beheshti University of Medical Sciences, Tehran, Iran. We also appreciate the “Student Research Committee” and “Research and Technology Chancellor” in Shahid Beheshti University of Medical Sciences for their financial support of this study.
Supporting Information
Additional supporting information can be found online in the Supporting Information section.
Open Research
Data Availability Statement
The corresponding author will provide the data supporting study’s conclusions upon request.


