Hepatoprotective Effects of Fermented Laminaria japonica in Oleic Acid–Induced HepG2 Cells and in a High-Fat Diet–Induced NAFLD Mice Model via Activating the SIRT1 Signaling Pathway
Abstract
Laminaria japonica is a kind of brown algal with good nutritional and medicinal value. Our previous studies demonstrated that the phytochemical components and bioactivities of Laminaria japonica were markedly enhanced by fermentation. However, the specific activity and underlying mechanism of fermented Laminaria japonica (FLJ) against NAFLD remain poorly understood. For this study, Laminaria japonica was fermented using S. cerevisiae and Lactiplantibacillus. In vitro assays were employed to evaluate the efficacy of FLJ in regulating cholesterol reduction and fat binding. In addition, the hepatoprotective effects and underlying mechanisms of FLJ in the treatment of NAFLD were evaluated using oleic acid (OA)–induced HepG2 cells and NAFLD mice. Our data revealed that FLJ significantly promoted fat-binding and cholesterol-reducing activity in vitro. Moreover, FLJ alleviated hepatic lipid accumulation, oxidative stress, and the inflammatory response in high-fat diet (HFD)–induced NAFLD mice and in OA–induced HepG2 cells. The underlying protective mechanisms of FLJ against NAFLD may be attributed to the activation of the SIRT1 signaling pathway. These observations suggested that FLJ could be developed as a functional food supplement for the prevention or improvement of NAFLD.
1. Introduction
Nonalcoholic fatty liver disease (NAFLD) is the most prevalent liver disorder globally, accounting for approximately 30% of the cases worldwide [1]. Individuals with NAFLD exhibit an abnormal accumulation of fats in the liver, which occurs independently of alcohol consumption or lipid metabolism irregularities. This condition can progress to nonalcoholic steatohepatitis (NASH), liver fibrosis, cirrhosis, and ultimately liver cancer [2]. The liver plays a crucial role in regulating lipid metabolism by maintaining a dynamic equilibrium of fatty acids through their utilization, synthesis, and export [3]. The causative factors of NAFLD can be defined as the liver’s capacity to process essential metabolic energy substrates, such as carbohydrates and fatty acids, becoming overwhelmed, leading to the accumulation of toxic lipid forms [4]. It is widely recognized that oxidative stress significantly contributes to the development of NAFLD [5]. The excessive production of reactive oxygen species (ROS) results in lipid peroxidation and damage to liver cells, accompanied by the nuclear factor-κB (NF-κB)–mediated release of inflammatory cytokines [6]. Recent research suggests that the activation of the hepatic inflammasome may represent a critical link between initial metabolic stress and the subsequent induction of hepatic cell mortality and fibrosis in individuals with NASH [7]. Consequently, inhibiting inflammasome activation may emerge as an attractive therapeutic target for NASH.
The pathogenesis of NAFLD is complex and involves many factors leading to disease progression. Currently, there are no drugs approved to treat NAFLD, so dietary restriction and weight control are important components of treatment [8]. Nutraceuticals are food-derived products that provide additional health benefits in addition to basic nutritional value and play an important role in the treatment of metabolic diseases such as NAFLD [9]. Numerous nutraceuticals can trigger anti-inflammatory and antioxidant effects through the activation of the AMP–activated protein kinase (AMPK) pathway [10, 11]. The phosphorylation of AMPK promotes the activation of nuclear factor erythroid 2–related factor 2 (Nrf2), which aids in reducing oxidative stress by inducing the transcription of antioxidant genes [12]. Silent information regulator T1 (SIRT1), an NAD+-dependent enzyme, can influence AMPK activity [13]. Various research studies have demonstrated that enhancing SIRT1 expression can activate the AMPK pathway [14, 15]. Active AMPK inhibits acetyl-CoA carboxylase 1 (ACC1), a key enzyme involved in fatty acid synthesis [16]. In addition, AMPK regulates sterol regulatory element–binding protein-1c (SREBP-1c), a protein responsible for controlling the expression of lipogenic enzymes, including fatty acid synthase (FAS) [17]. The activation of AMPK leads to a reduction in lipogenesis and lipid accumulation, making it a promising target for the management of NAFLD.
Laminaria japonica (LJ) is a brown edible seaweed widely consumed in Asian countries. It contains a variety of bioactive compounds, including polysaccharides, polyphenols, and fatty acids [18], which contribute to its functional food status. In addition, LJ exhibits antioxidant, anti-inflammatory, hypolipidemic, and hypoglycemic properties [19]. Moreover, LJ consumption has been shown to prevent high-fat diet (HFD)–induced NAFLD associated with hyperlipidemia [20]. Fermentation can induce favorable changes in the food structure, increasing the bioavailability of nutrients through microbial activities. According to our previous research, fermented LJ (FLJ), particularly when fermented with S. cerevisiae and Lactiplantibacillus, presents superior hypolipidemic effects on HFD mice compared to non-FLJ[21]. Nevertheless, the precise impacts and mechanisms of FLJ on HFD–induced NAFLD are not well understood.
In the present study, FLJ was prepared by step fermentation by S. cerevisiae and Lactiplantibacillus and its potential was subsequently investigated in mitigating NAFLD. The hepatoprotective effects of FLJ were evaluated in oleic acid (OA)–induced HepG2 cells (in vitro) and in a HFD–induced NAFLD mice model (in vivo). Furthermore, our study focused on elucidating how FLJ helps in alleviating NAFLD.
2. Materials and Methods
2.1. Chemicals and Materials
LJ was purchased from Tulip Crown Foods Co., Ltd. (Fuzhou, China). Fetal bovine serum (FBS) was obtained from Sigma-Aldrich (St. Louis, Missouri, United States of America), and Dulbecco’s Modified Eagle Medium (DMEM) was obtained from Gibco BRL (Grand Island, New York, United States of America). Sodium taurocholate and OA were obtained from Shanghai Maclin Biochemical Technology Co., Ltd. 3-(4,5-dimethylthiazol-2-yl)-2,5-diphenyl tetrazolium bromide (MTT) and dimethyl sulfoxide (DMSO) were obtained from Beijing Solar Science & Technology Co., Ltd. Peanut oil was obtained from Jiali Oil Co., Ltd. (Qingdao, China). Cholesterol, fenofibrate (FEN), and DCFH-DA were obtained from Sigma-Aldrich (St. Louis, Missouri, United States of America). Sodium chloride, sodium phosphate, chloroform, isopropyl alcohol, and petroleum ether were purchased from Sinopharm Chemical Reagent Co., Ltd.
2.2. Strains and Growth Conditions
Saccharomyces cerevisiae (AMnb091), Lactiplantibacillus plantarum (LP1406), and Lactiplantibacillus rhamnosus (F-B4-1) were isolated in the laboratory, and the culture preservation numbers were as follows: CCTCC NO: M20211499, CCTCC NO: M20211500, and CCTCC M20221626, respectively. Inoculation cultures were prepared as previously reported [21]. Yeast strains were grown in YPD medium at 30°C and 180 rpm for 24 h with continuous shaking. The two lactic acid bacteria were cultured in MRS medium at 37°C for 24 h.
2.3. Preparation and Determination of Nutrient Contents in FLJ
FLJ was prepared as described previously [22]. In brief, LJ was washed, dried, ground, and passed through a 40-mesh screen. The powder was dissolved in distilled water at a ratio of 1:30 (w/v). After that, the pH was adjusted to 4.8, and Celluclast and pectinase were added at dry weights of 2.5% and 0.26%, respectively. The reaction solution was stirred at 50°C for 2 h. Subsequently, the pH was adjusted to 8.0, and then alkaline pectinase (0.3%) was added, and the sample was incubated at 60°C for another 1.5 h. Afterward, the reaction products were collected, sterilized, and used as fermentation media. Two-step fermentation, namely, fermentation with S. cerevisiae and Lactiplantibacillus, was performed to prepare FLJ. First, a culture of S. cerevisiae was inoculated at a concentration of 3% (v/v) and incubated at 30°C for 48 h with constant shaking. Second, the fermentation broth was sterilized at 121°C for 20 min. Subsequently, L. plantarum and L. rhamnosus were inoculated at a concentration of 3% (v/v) and incubated at 37°C for another 48 h. FLJ was obtained by centrifugal separation and lyophilization.
The moisture content was measured by weighing the samples before and after they were dried overnight at 105°C in an oven (DHG-9240A, Shanghai Jinghong Experimental Equipment Co., Ltd., China). The ash content was measured by weighing the samples before and after ashing at 550°C for 4 h in a muffle furnace (YTH-5-12A, Shanghai Suoyu Test Equipment Co., Ltd., China). Carbohydrate content was determined using the phenol–sulfuric acid method using a UV–vis spectrophotometer (Hitachi U 2910) [23]. Protein concentrations were analyzed using the Bradford method [24]. The total titratable acidity was measured according to the International Organization for Standardization (ISO) 750:1998 (1998). The content of soluble dietary fiber was analyzed by using an enzymatic–gravimetric method (AOAC, 991.43). The Folin–Ciocalteu method was used to determine the total phenolic content [25]. Fat content was determined according to the standard method (AOAC, 996.06).
2.4. Cholesterol-Reducing Activity of FLJ In Vitro
2.5. In Vitro Fat-Binding Capacity
The fat-binding capacity of FLJ and UFLJ were assessed as described previously with some modifications [27]. In brief, 20 mg of FLJ or UFLJ was dissolved in 2 mL of distilled water. Then, 1 mL of peanut oil was added to the solution, and the mixture was incubated at 37°C for 2 h. Thereafter, the mixtures were centrifuged at 6000 × g for 20 min, after which the supernatant (considered to be the unbound oil) was removed. The bound oil was extracted with petroleum ether three times. Subsequently, the extracts were combined and dried under vacuum at 40°C. The fat-binding capacity is expressed in milligrams of bound oil per 10 mg of sample (mg/10 mg). Cellulose was used as the positive control.
2.6. Cell Cultures
HepG2 cells were acquired from the Cell Bank of the Chinese Academy of Sciences. The cells were cultured in DMEM supplemented with 10% FBS, penicillin G (100 U/mL), and streptomycin (100 μg/mL) and were maintained at 37°C with a CO2 concentration of 5%.
2.7. Cell Viability Assay
Cell viability was measured by MTT assay. The cells were seeded into 96-well plates at a density of 2 × 10⁴ cells/well and cultured for 24 h. Subsequently, the cells were treated with different concentrations of FLJ (0.1, 0.2, 0.4, 0.6, and 0.8 μg/mL) for 24 h. Cells in the normal group were treated with culture media. After incubation, 20 μL of the MTT solution (5 mg/mL) was added to each well, and the plates were incubated for another 4 h. The absorbance was measured at 570 nm using a microplate reader (MD SpectraMax i3x; San Jose, California, United States of America). The relative cell viability was expressed as the proportion compared to that of the normal group. All the experiments were conducted in triplicate.
2.8. Oil Red O Staining
OA–treated HepG2 cells were employed as an in vitro model of steatosis according to the literature [28]. OA was dissolved at a concentration of 10 mM in PBS (pH 7.4) that contained 10% fatty acid–free bovine serum albumin, and diluted to the proper concentration with DMSO. Cells were seeded into 24-well plates at a density of 2 × 10⁴ cells/well. Upon reaching 70%-80% confluence, the HepG2 cells were incubated for 24 h as follows: (1) normal group: pretreated with an equivalent volume of DMSO (0.05%) without OA for 24 h, and then cultured in the medium for 24 h; (2) OA group: pretreated with 0.5 mM OA for 24 h, and then cultured in the medium for 24 h; (3) OA + FEN group: pretreated with 0.5 mM OA for 24 h, and then incubated with 100 μM of FEN for 24 h; and (4) OA + FLJ group: pretreated with 0.5 mM OA for 24 h, and then incubated with FLJ (0.6 μg/mL) for 24 h. After the intervention, Oil Red O staining was performed according to the instructions of the Oil Red O staining kit (Beijing Solar Science & Technology Co., Ltd. Beijing, China). Lipid droplets were imaged using Nikon DS-Fi2 fluorescence microscopy. Lipid droplets were eluted with isopropanol, and the absorbance was measured at 510 nm.
2.9. Determination of TC and TG in HepG2 Cells
HepG2 cells were inoculated in 6-well plates (5 × 10⁵ cells/well) and treated with FLJ or the control for 24 h. The TC and intracellular triglyceride (TG) levels were measured by commercial assay kits according to the manufacturer’s instructions (Nanjing Jiancheng Bioengineering Institute, Nanjing, China).
2.10. Measurement of ROS
HepG2 cells were inoculated in 6-well plates and treated following the above method for 24 h. The probe DCFH-DA (20 μM) was added and incubated in the dark at 37°C for 20 min. After washing with PBS 3 times, the cells were observed under a fluorescence microscope (Nikon Ci-L, Japan).
2.11. Animal Treatment
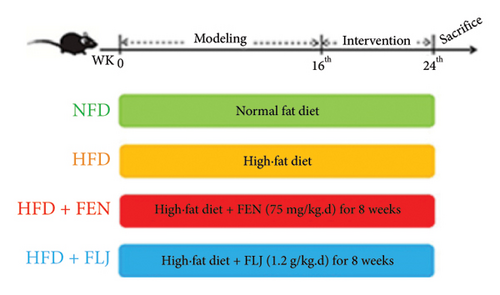
Twenty-eight male C57BL/6J mice (6 weeks old) were obtained from Beijing Vital River Laboratory Animal Technology Co., Ltd. (Beijing, China). The mice were maintained at standard humidity and room temperature with a 12 h dark/light cycle. After one week of acclimation, the mice were randomly divided into three groups: (1) fed a normal fat diet (NFD) for 24 weeks (n = 7), (2) fed a HFD (D12492, Ruidi Biotechnology Co., Ltd., Shenzhen, China) supplemented with 60 kcal% fat for 24 weeks (HFD group; n = 7), (3) fed a HFD + FEN (75 mg/kg body weight/day) (HFD + FEN group; n = 7), and (4) fed a HFD + fermented LJ (1.2 g/kg body weight/day) (HFD + FLJ group; n = 7). The diet composition of HFD is shown in Supporting Table S1. After being fed a HFD for 16 weeks, the mice in the FLJ group were gavaged with FLJ every day for 8 consecutive weeks. Mice in the NFD group and HFD group were orally gavaged with distilled water accordingly. The body weights of the mice were recorded weekly. At the end of the experiment, all the mice were anesthetized and sacrificed by cervical dislocation, and blood samples were immediately collected from an eye socket vein and centrifuged to obtain the serum. The liver tissues were also quickly harvested, weighed, and stored at −80°C for histological analysis. The experimental procedures were performed under the Guidance of the National Research Council’s Guide for the Care and Use of Laboratory Animals and approved by the Animal Ethics Committee of Qilu University of Technology (Shandong Academy of Sciences) (No. SWS20230303).
2.12. Real-Time PCR
Total RNA was extracted from liver tissues and HepG2 cells with TRIzol reagent (BioFlux, Hangzhou, China) according to the manufacturer’s protocol. In brief, 1 mL of TRIzol was added to 50 mg of liver tissue or HepG2 cells (1 × 10⁶ cells/well), mixed vigorously, and centrifuged at 12,000 rpm for 10 min at 4°C. The supernatant was collected and then methyl chloride, isopropanol, 75% alcohol, and DEPC water were added, and the RNA concentration was measured. Reverse transcription was performed using a reverse transcription kit (ABclonal, Wuhan, China). Quantitative RT–PCR was performed using SYBR Green Fast Q-PCR (ABclonal, Wuhan, China) according to the manufacturer’s instructions. The primer sequences are shown in Table 1. The β-actin housekeeping gene was used as a reference. The relative quantification of the mRNA level was determined using the 2−ΔΔCt method.
| Gene | Forward primer (5′-3′) | Reverse primer (5′-3′) |
|---|---|---|
| Human | ||
| SIRT1 | F: AGGCTGTAAGGGCTTCTTTC | R: GCATTTGTTCCGGTTCTTCTTC |
| AMPK | F: TCCTGGTGGGCTACAAATTAC | R: ACAGCAGATCCATGGCATAATA |
| SREBP-1c | F: CCGCTATGATGGGAATGTGTAT | R: GTGACTTCAGGTGCTTGTAAGA |
| FAS | F: CCTGCAGAATGGAGGAGATAAG | R: GCCTTCCTTATCCTTGTAGGTG |
| Nrf2 | F: TTCTTTCAGCAGCATCCTCTCCAC | R: ACAGCCTTCAATAGTCCCGTCCAG |
| β-Actin | F: CCTTCCTGGGCATGGAGTCCTG | R: GGAGCAATGATCTTGATCTTC |
| Mouse | ||
| SIRT1 | F: GACGCTGTGGCAGATTGTTA | R: GGAATCCCACAGGAGACAGA |
| AMPK | F: GGCACCCTCCCATTTGATG | R: ACACCCCCTCGGATCTTCTT |
| SREBP-1c | F: CGCAAGGCCATCGACTACATCCG | R: CCTCCACTGCCACAAGCTGACAC |
| FAS | F: TTGCTGGCACTACAGAATGC | R: AACAGCCTCAGAGCGACAAT |
| Nrf2 | F: CAGCATAGAGCAGGACATGGAG | R: GAACAGCGGTAGTATCAGCCAG |
| β-Actin | F: ACATCCGTAAAGACCTCTATGCC | R: TACTCCTGCTTGCTGATCCAC |
2.13. Western Blot Analysis
100 mg of each liver tissue or HepG2 cells (1 × 10⁶ cells/well) were lysed in 5 × RIPA cleavage buffer supplemented with 1 mM PMSF. The total protein was extracted, mixed vigorously, and centrifuged at 10,000 rpm at 4°C for 15 min to collect the supernatant. The protein concentration was determined with a BCA protein assay kit (Beyotime Biotechnology, Jiangsu, China). Fifteen micrograms of protein from the different groups were separated via 12% sodium dodecyl sulfate–polyacrylamide gel electrophoresis (SDS-PAGE) and subsequently transferred to polyvinylidene fluoride (PVDF) membranes (Millipore, Massachusetts, United States of America). The PVDF membranes were blocked with 5% nonfat dry milk at room temperature for 1 h and then incubated with primary antibodies at 4°C overnight. The membranes were washed three times with Tris-buffered saline (TBST) (with 0.1% Tween 20) before they were incubated with the HRP–conjugated secondary antibody (1: 7500 dilution) (ABclonal, Wuhan, China) at room temperature for 1 h. β-Actin was used as the reference protein. The protein bands were detected by using Basis ECL Prime (ABclonal, Wuhan, China), and the optical density was calculated via ImageJ software. The relative expression of the protein was standardized to the gray value of β-actin.
2.14. Biochemical Parameter Analysis
The levels of TC, TG, low-density lipoprotein cholesterol (LDL–C), high-density lipoprotein cholesterol (HDL–C), alanine transaminase (ALT), and aspartate transaminase (AST) in the serum were measured using commercial kits (Nanjing Jiancheng Bioengineering Institute, Nanjing, China). The hepatic TG and TC levels were also analyzed according to the manufacturer’s protocol. Malondialdehyde (MDA) is an indicator of lipid peroxidation. MDA was determined by the thiobarbituric acid (TBA) method using the MDA reagent kit (Elabscience, Wuhan, China). The results are expressed as nmol of lipid hydroperoxides per milligram of protein.
2.15. Enzyme-Linked Immunosorbent Assay (ELISA)
The levels of inflammatory cytokines, including IL-6, INFγ, and TNF-α, in the serum were tested and calculated via mouse ELISA kits (Jing Mei Biotechnology, Jiangsu, China) according to the manufacturer’s instructions.
2.16. Histological Analysis
Liver tissue samples were fixed in 4% paraformaldehyde and embedded in paraffin. The 4 μm thick sections were then stained with hematoxylin and eosin (H&E) for histopathological analysis. Histopathological changes in the liver tissues were observed under a light microscope (Olympus BX53, Japan). The NAFLD activity score (NAS) was calculated as the sum of the steatosis, hepatocellular ballooning, and lobular inflammation scores [29]. NAS grading was performed in a blinded manner by two independent pathologists. The severity of steatosis was graded from 0 to 3 based on the percentage of lipid droplet cells (0, < 5%; 1, 5%–33%; 2, 34%–66%; 3, > 66%). Balloon degeneration of hepatocytes was calculated as 0 (none), 1 (few balloon cells), and 2 (many balloon cells or obvious balloon cells). The degree of lobular inflammation was divided into Grade 0 (none), Grade 1 (< 2 lesions), Grade 2 (2–4 lesions), and Grade 3 (> 4 lesions). An average of three tissue sections per animal were used for histopathological evaluation.
2.17. Statistical Analysis
The data are expressed as mean ± SD. Statistical comparisons between groups were analyzed by one-way ANOVA and Duncan’s multiple-comparison test using the SPSS software program (Version 26). A value of p < 0.05 was considered to indicate statistical significance.
3. Results
3.1. Nutrient Profiles in FLJ
As shown in Table 2, the results indicated that FLJ contained moisture (3.75% ± 0.02%), ash (1.8% ± 0.01%), carbohydrates (32.77% ± 0.005%), protein (27.90% ± 0.02%), titratable acidity (19.80% ± 0.21%), soluble dietary fiber (6.30% ± 0.001%), total phenolics (1.25% ± 0.003%), and fat (0.72% ± 0.001%). In our previous study, we characterized unfermented seaweed extracts [21]. Under the fermentation conditions of this study, the protein content, titratable acidity, soluble dietary fiber, and total phenolic content of the FLJ group were significantly higher than those of the nonfermentation group.
| Component (%) | FLJ |
|---|---|
| Moisture | 3.75 ± 0.02 |
| Ash | 1.80 ± 0.01 |
| Carbohydrate | 32.77 ± 0.005 |
| Protein | 27.90 ± 0.02 |
| Titratable acidity | 23.80 ± 0.21 |
| Soluble dietary fiber | 6.30 ± 0.001 |
| Total phenolic | 1.25 ± 0.003 |
| Fat | 0.72 ± 0.001 |
- Note: The data are expressed as mean ± SD from the three replicates.
3.2. In Vitro Experiment
3.2.1. Effects of Cholesterol-Reducing Activity of FLJ
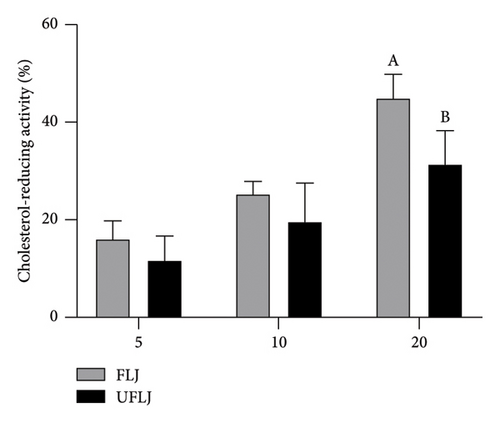
As shown in Figure 1(a), the cholesterol-lowering effect of FLJ and UFLJ increased with increasing concentration. In addition, FLJ exhibited higher cholesterol-lowering ability than the unfermented samples. At a concentration of 20 mg/mL, the FLJ reduced cholesterol by up to 45.08%. The results indicated that LJ has a promising cholesterol-reducing activity after fermentation.

3.2.2. Effects of the Fat-Binding Capacity of FLJ
Fat-binding capacity has a great influence on biological activities, such as hypolipidemic and antiobesity effects [27]. In the present study, the fat-binding abilities of FLJ and UFLJ were detected. As shown in Figure 1(b), the fat-binding ability of FLJ was 12.65 ± 0.69 mg/10 mg, indicating a significant (p < 0.05) increase in fat-binding capacity compared to the positive control group and UFLJ group. The results showed that LJ has a promising fat-binding ability after fermentation.
3.2.3. Effects of FLJ on Lipid Accumulation and ROS Production in OA–Induced HepG2 Cells
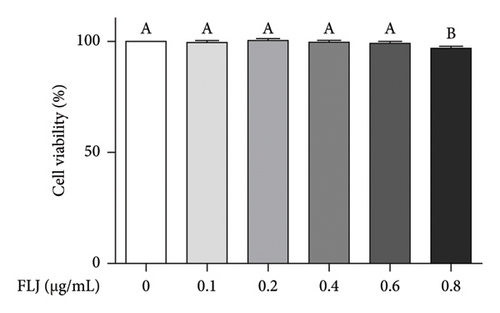
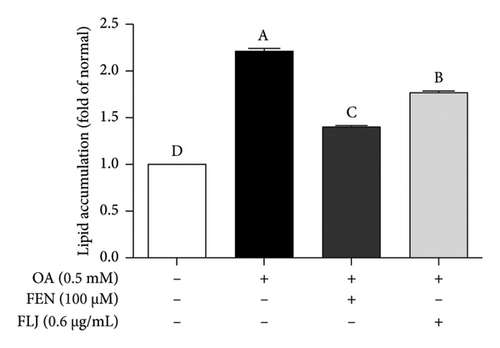
The MTT assay was used to detect the cytotoxicity of FLJ on HepG2 cells. As shown in Figure 2(a), a concentration less than 0.6 μg/mL did not affect cell viability, but 0.8 μg/mL had a toxic effect. Therefore, 0.6 μg/mL was the experimental concentration used in subsequent cell experiments. Compared to the normal group, OA treatment significantly promoted lipid droplet aggregation, while FLJ and FEN ameliorated lipid accumulation (Figures 2(b) and 2(c)). As shown in Figure 2(d), incubation with 0.5 mM OA for 24 h induced excessive ROS production in HepG2 cells. Both FLJ and FEN interventions can significantly reduce ROS levels in HepG2 cells.


3.2.4. Effects of FLJ on the Contents of TC and TG in OA–Induced HepG2 Cells
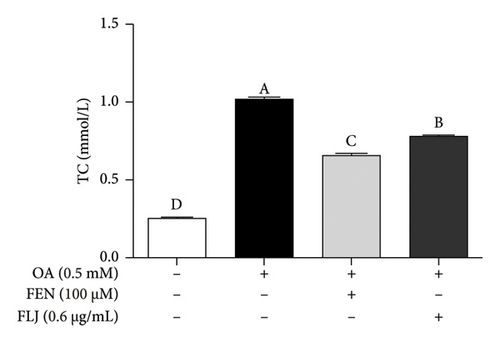
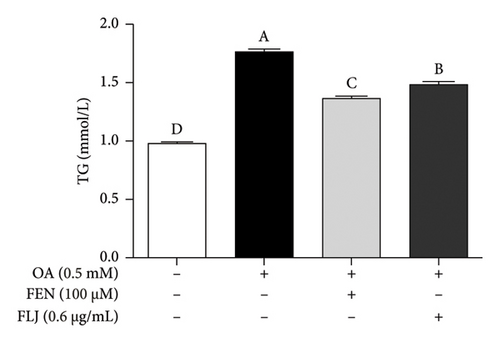
The contents of TC and TG were detected to determine the effects of FLJ on the intracellular lipid level in OA–induced HepG2 cells. Compared to those in the normal group, the levels of TC and TG in the OA group were significantly greater after 24 h of incubation, and these changes were significantly alleviated by FLJ treatment. As shown in Figures 2(e) and 2(f), the TC content decreased by 28.65% and 34.78%, respectively, in the FLJ and FEN treatment groups compared to that in the OA group, while the TG content decreased by 17.45% and 23.17%, respectively, in the OA + FLJ and OA + FEN groups.
3.2.5. Effects of FLJ on the Expression of Genes Related to Lipid Metabolism in OA–Induced HepG2 Cells
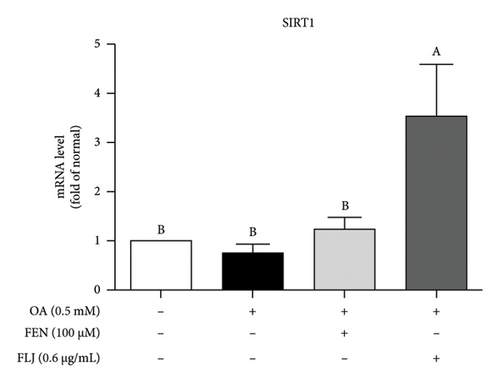
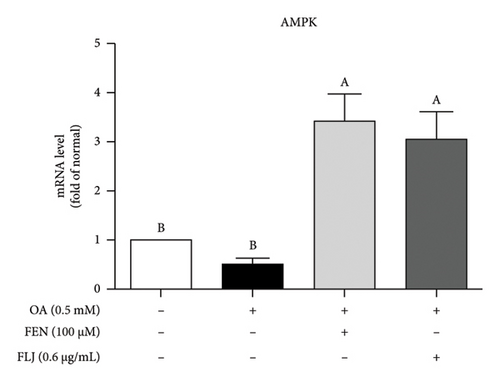
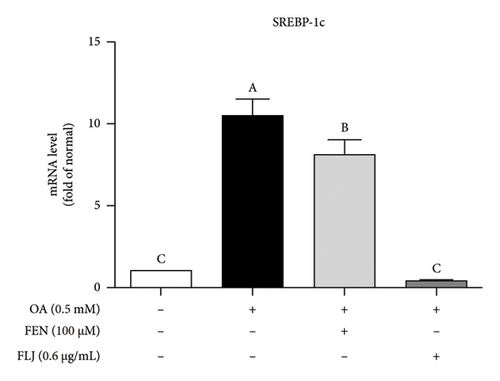
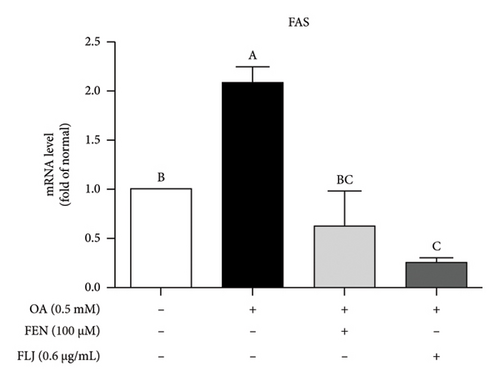
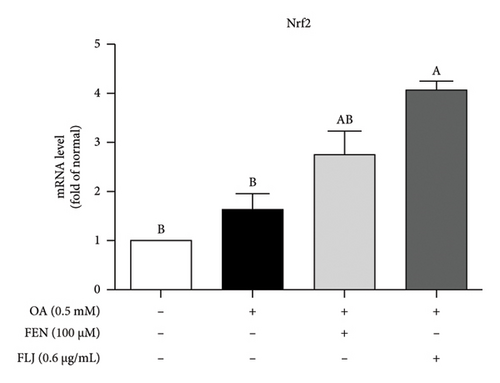
To further explore the possible mechanism involved in the antisteatotic effect of FLJ, the expression of selected genes was detected via qRT–PCR. The results showed that FLJ treatment effectively promoted the expression of SIRT1, AMPK, and Nrf2 and inhibited the mRNA expression of the TG-related synthases FAS and SREBP-1c (Figure 3). The findings suggest that FLJ may ameliorate OA–induced steatosis by controlling lipogenesis and lipid accumulation via the AMPK–SREBP-1c–FAS pathway. Conversely, the group treated with FEN showed decreased SIRT1 expression and increased SREBP-1c expression compared to the OA + FLJ group.
3.2.6. Effects of FLJ on the Expression of Proteins Related to Lipid Metabolism in OA–Induced HepG2 Cells
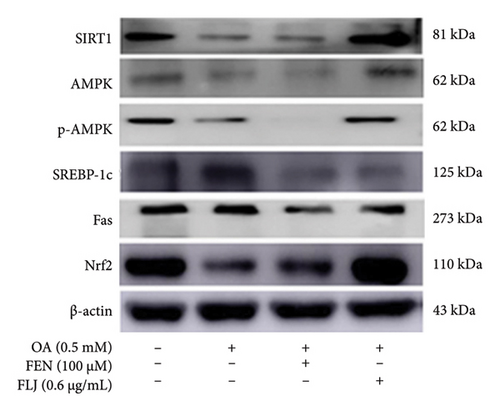
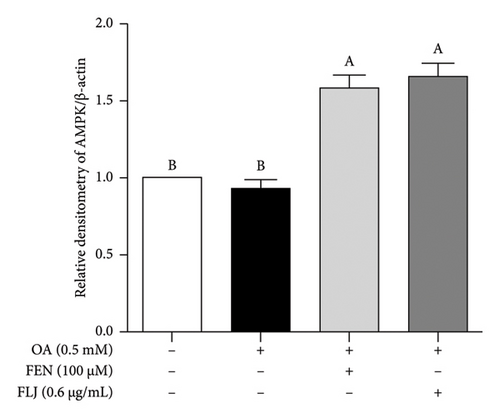
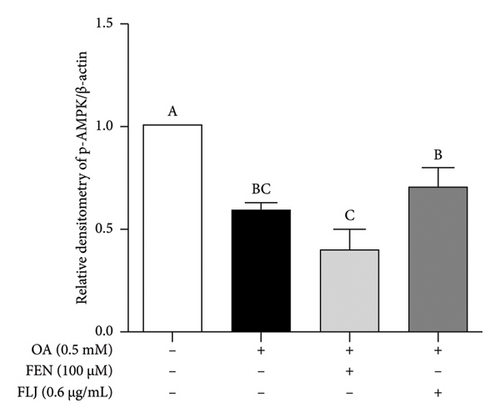
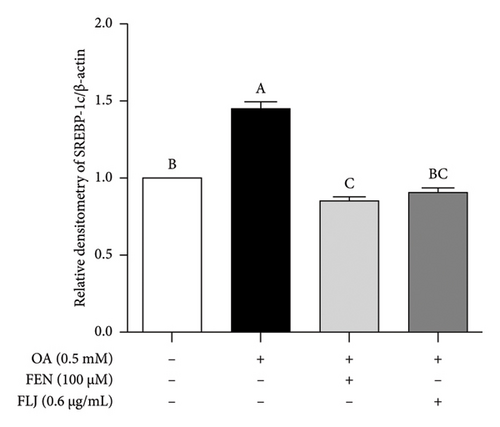
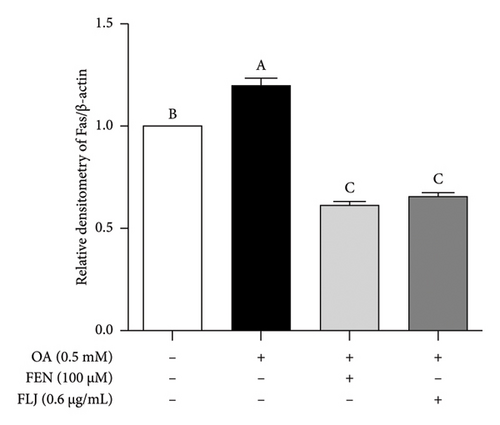
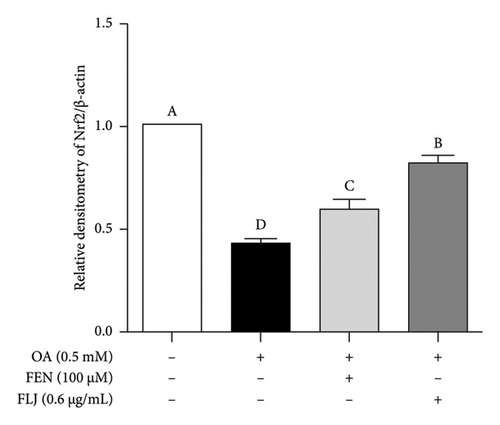
To further investigate the protective mechanisms of FLJ against NAFLD, we investigated the expression levels of proteins (SIRT1, AMPK, p-AMPK, SREBP-1c, and FAS) related to lipid metabolism. In addition, the effect of FLJ on OA–induced oxidative stress imbalance in HepG2 cells was also evaluated. In the HepG2 cell model group, a decrease in SIRT1, AMPK, and Nrf2 and an increase in SREBP-1c and FAS were observed in comparison to those in the normal group, while these abnormal protein expression levels returned to normal after FLJ treatment (Figure 4). In addition, the expression levels of SIRT1 and Nrf2 in the OA + FEN group were significantly lower than the OA + FLJ group. These results were consistent with the mRNA levels investigated by RT–qPCR.

3.3. In Vivo Experiment
3.3.1. Effect of FLJ on the Body Weight and Hepatic Index of HFD–Fed Mice
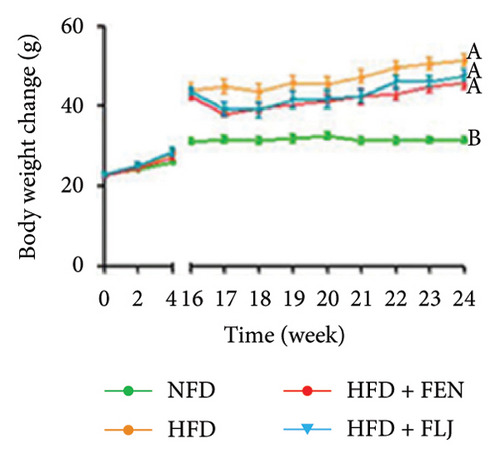
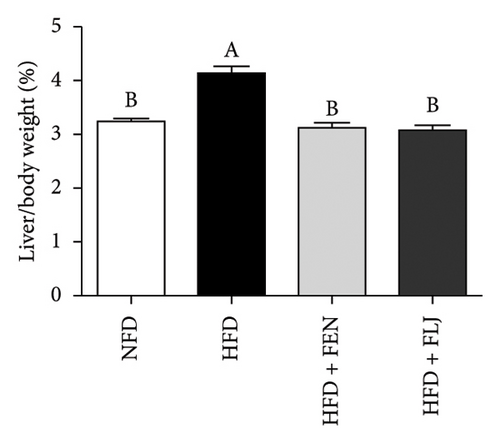
The details of the animal experimental design are displayed in Figure 5(a). Before gavage, the body weights of the mice fed a HFD were apparently greater than those of the mice in the NFD group after the 16-week feeding trial (Figure 5(b)). After gavage with FLJ for 8 weeks, the HFD + FLJ group exhibited lower body weights than mice in the HFD group. However, no marked difference in body weight was detected among the groups. As shown in Figure 5(c), the liver weight of mice in the HFD group was greater than that of the NFD group, while the liver index of mice in the HFD + FEN and HFD + FLJ groups was significantly lower than that of the NFD group.


3.3.2. Effects of FLJ on Liver Tissue Pathology in HFD–Fed Mice
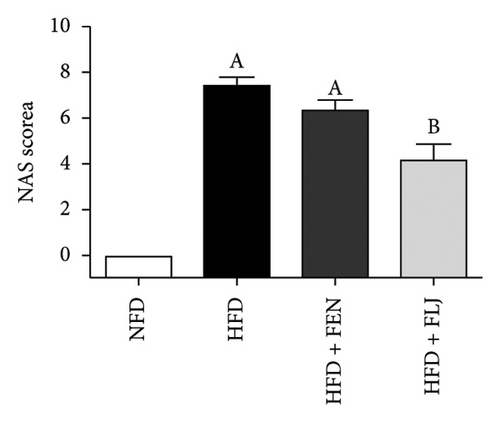
As shown in the morphological image of the liver (Figure 5(d)), the liver morphology of the HFD group was greater than that of the NFD group, indicating the characteristics of fatty liver. After FEN and FLJ treatment, the color of the HFD + FEN group and HFD + FLJ group was significantly improved. Compared to those in the NFD group, H&E staining revealed more infiltrated inflammatory cells and lipid droplet vacuoles, with considerable intercellular spaces in the HFD group (Figure 5(e)). However, fat vacuoles in the liver tissue were considerably reduced, and hepatocytes were more tightly interconnected in the HFD + FLJ group. Furthermore, NAS was significantly reduced in the HFD + FLJ group compared to the HFD + FEN group, which was mainly due to the significant reduction in balloon cells and steatosis (Figure 5(f) and Supporting Figure S1).
3.3.3. Effects of FLJ on the Lipid Profile and Liver Function
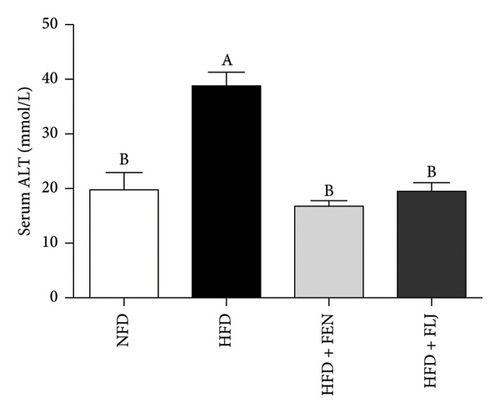
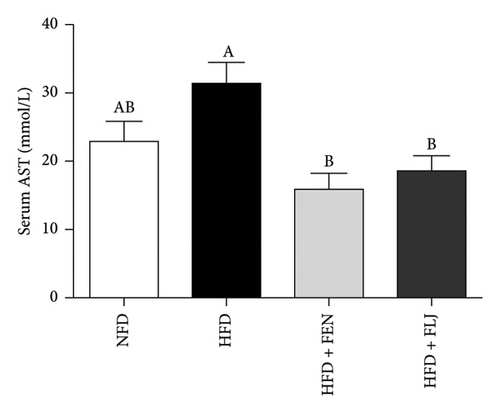
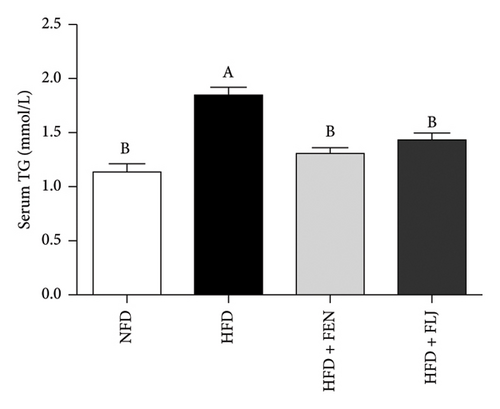
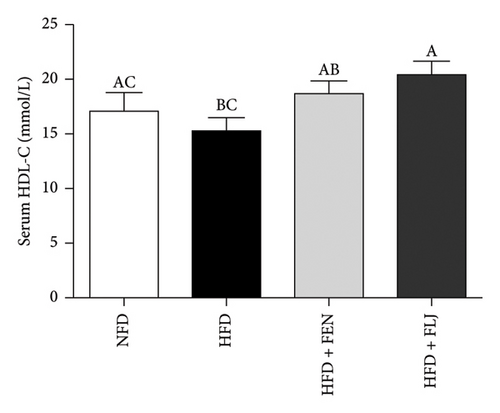
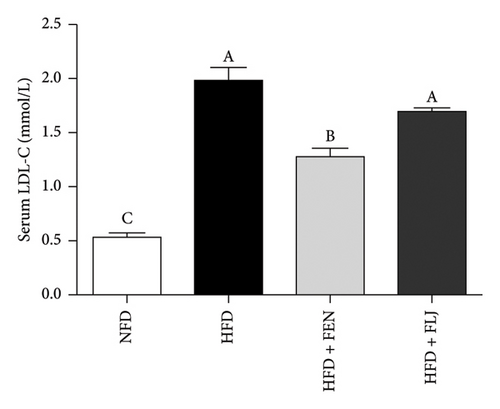
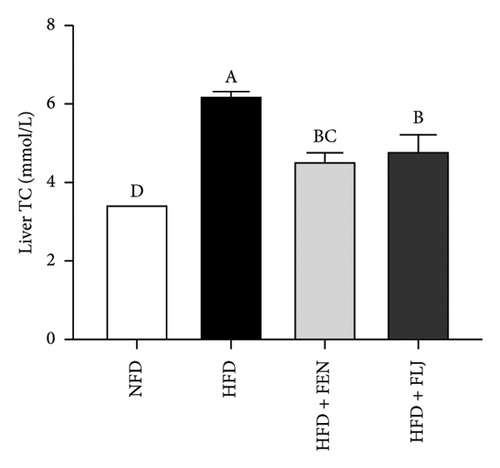
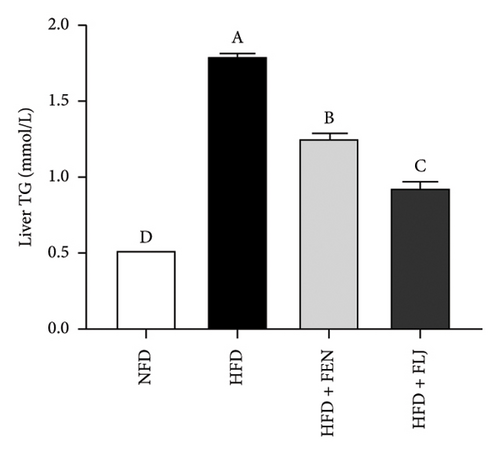
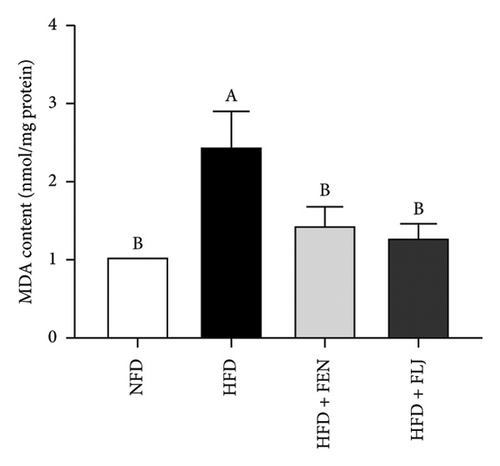
The levels of serum TC, TG, LDL–C, HDL–C, ALT, and AST in the four groups were measured at the end of the 24-week trial. The common indicators of HFD–induced NAFLD in mice include elevated ALT, AST, TC, TG, and LDL–C levels and decreased HDL–C levels. In the present study, compared to those in the NFD group, the mice in the HFD group had significantly greater serum ALT, AST, TC, TG, and LDL–C levels (Figures 6(a), 6(b), 6(c), 6(d), and 6(f)), along with decreased HDL–C level (Figure 6(e)). FLJ treatment significantly reduced HFD–mediated increases in the serum ALT, AST, TC, TG, and LDL–C levels but had no significant effect on the HDL–C level. Compared to the HFD + FLJ group, TC was significantly increased and LDL–C was significantly decreased in the HFD + FEN group (Figures 6(c), 6(f)) Similar results were observed for TC and TG levels in the liver (Figures 7(a), 7(b)). As shown in Figure 7(c), compared to the control group, liver MDA levels in the HFD group were significantly increased by 65%. However, FLJ–treated groups showed a significant reduction in MDA levels than the HFD group.

3.3.4. Effects of FLJ on the Expression of Genes Related to Lipid Metabolism in HFD–Fed Mice
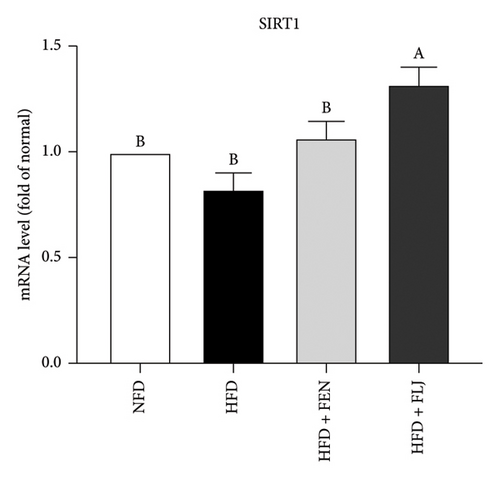
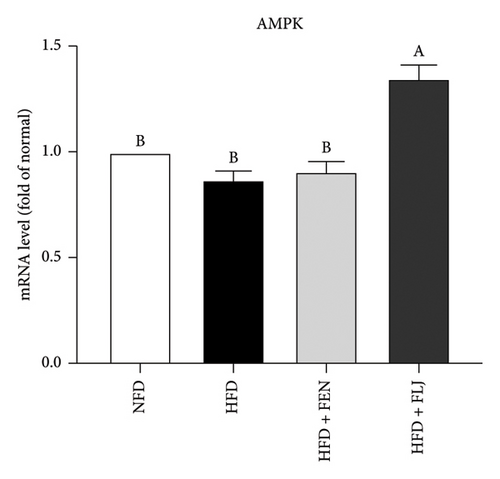
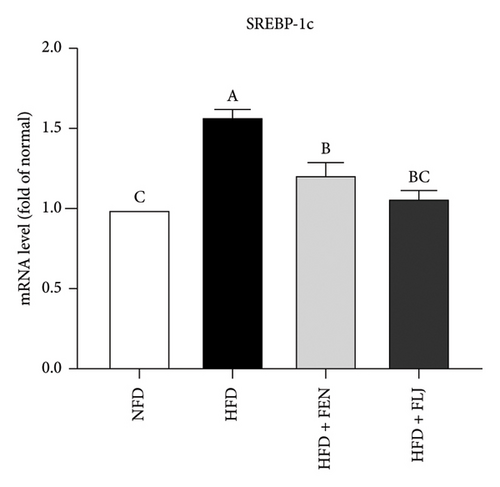
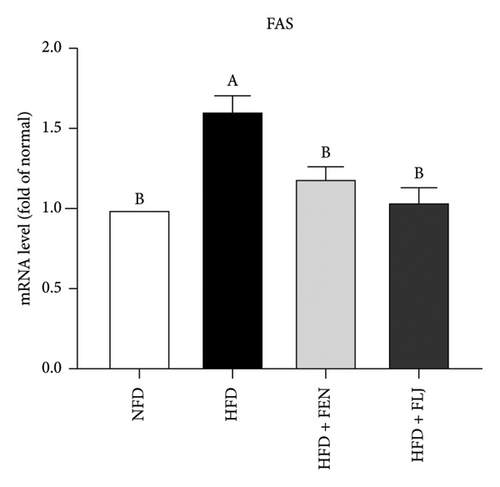
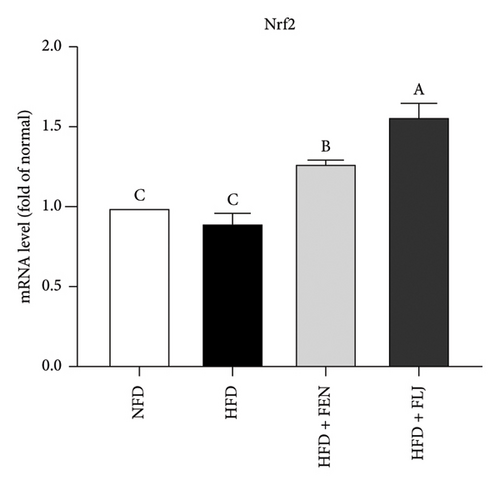
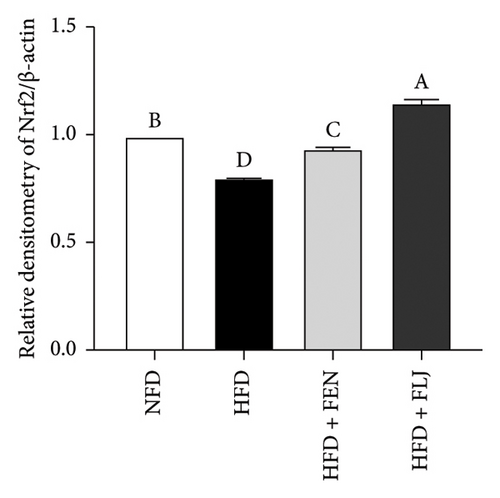
To further investigate the possible mechanisms of the antisteatosis effect of FLJ in vivo, we examined the expression of selected genes in liver tissue. Similarly, FLJ treatment effectively promoted the expression of SIRT1, AMPK, and Nrf2, and inhibited the mRNA expression of FAS and SREBP-1c (Figure 8). These results confirmed that FLJ could ameliorate steatosis by regulating lipogenesis and lipid accumulation through the AMPK–SREBP-1c–FAS pathway. The expression of SIRT1, AMPK, and Nr2 was lower in the FEN treatment group compared to the HFD + FLJ group.
3.3.5. Effects of FLJ on the Expression of Proteins Related to Lipid Metabolism in HFD–Fed Mice
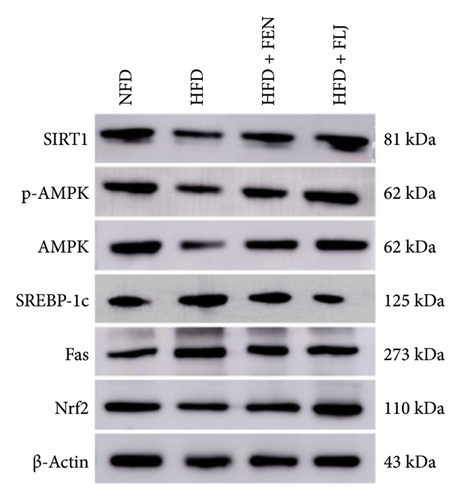
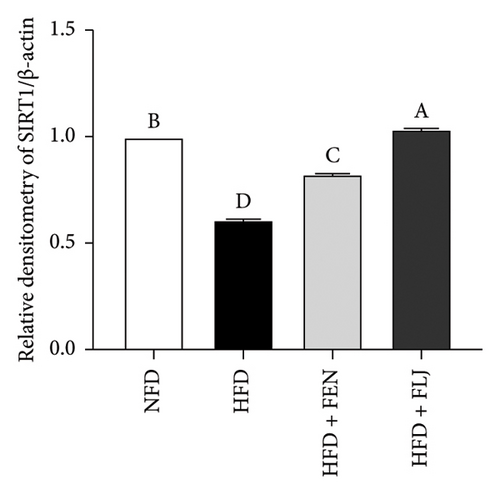
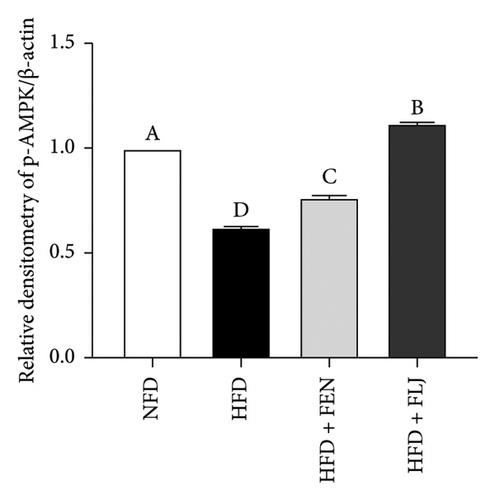
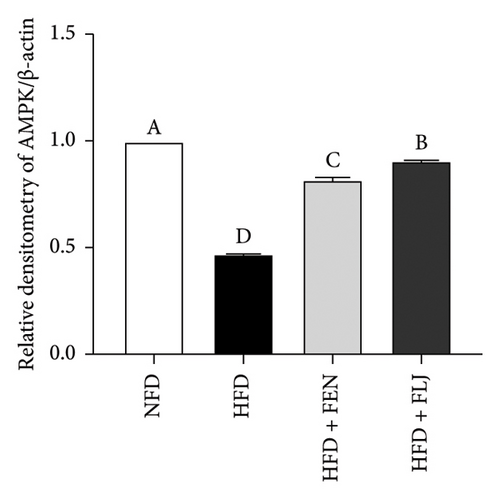
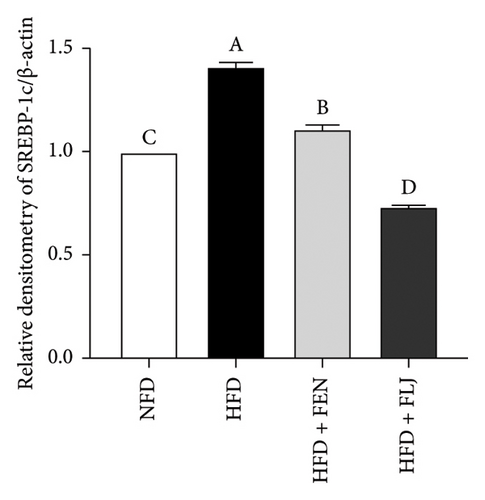
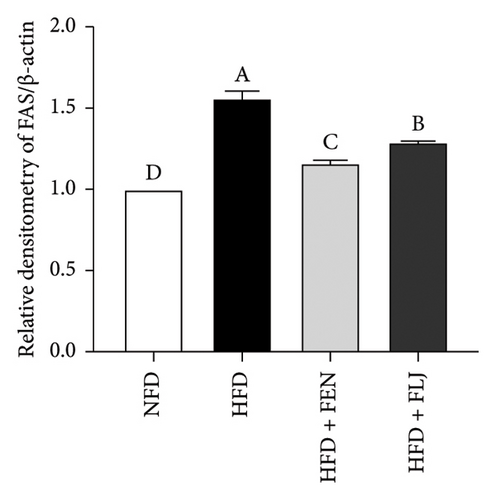
To further study the protective mechanism of FLJ against NAFLD, we detected the expression levels of lipid metabolism and oxidative stress-related proteins in liver tissue. As shown in Figure 9, Compared with the normal group, SIRT1, p-AMPK, AMPK, and Nrf2 were decreased, while SREBP-1c and FAS were increased in the HFD model group. The expression levels of these abnormal proteins returned to normal after FLJ treatment. In addition, the expression levels of SIRT1, p-AMPK, AMPK, and Nrf2 in the HFD + FEN group were significantly lower than those in the HFD + FLJ group, while the expression level of SREBP-1c was higher.
3.3.6. Effects of FLJ on Inflammatory Cytokines in HFD–Fed Mice
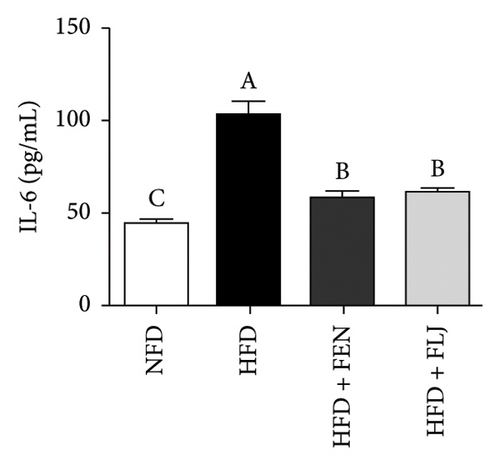
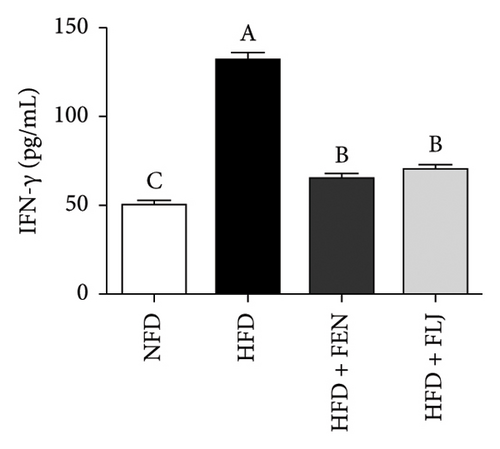
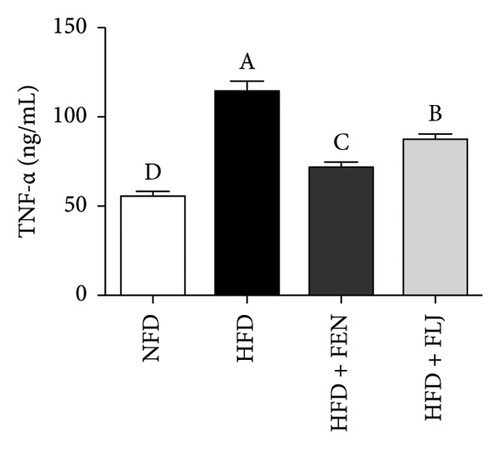
HFD feeding leads to liver tissue inflammation, which plays a key role in the pathogenesis of NAFLD. The inflammatory cytokine levels of IL-6, IFN-γ, and TNF-α were detected in this study. As shown in Figure 10, the levels of IL-6, IFN-γ, and TNF-α were significantly greater in the HFD group than in the NFD group. Notably, both FEN and FLJ treatment significantly reduced the expression of inflammatory factors in HFD–fed mice.
4. Discussion
NAFLD is a prevalent chronic liver condition worldwide, with an increasing incidence rate. Although specific pharmacological treatment guidelines for NAFLD are lacking, the primary management strategies focus on weight management and dietary modifications. Emerging research indicates that natural ingredients found in dietary supplements may provide promising therapeutic benefits for individuals with NAFLD [30–32]. The defining characteristic of NAFLD is the accumulation of neutral lipids in the liver, which results from an imbalance between lipid availability and disposal, ultimately leading to oxidative stress and liver injury [33]. This study utilized HepG2 cells induced with OA and mice with NAFLD induced by a HFD to investigate the effects of FLJ on lipid accumulation and metabolism.
It is recognized that the cholesterol-reducing and fat-binding capacities play a significant role in various biological activities, including hypocholesterolemic, hypolipidemic, and antiobesity effects [27, 34]. Consequently, the cholesterol-reducing activity and fat-binding ability of FLJ were evaluated to ascertain its lipid-decreasing and hepatoprotective effects in vitro. The results showed that FLJ exhibited a stronger fat-binding effect compared to the negative control, with its cholesterol-reducing activity demonstrating a concentration-dependent relationship, peaking at 20 mg/mL. These findings suggest that FLJ holds promising potential for the prevention of hypercholesterolemia and hyperlipidemia.
The liver plays a crucial role in the metabolism of fatty acids, and disorders in lipid metabolism can lead to the accumulation of TG, resulting in liver damage and the development of NAFLD. Research conducted in vitro has demonstrated that treatment with FLJ significantly increases the levels of TC and TG in OA–induced HepG2 cells. In addition, a marked increase in TC, TG, ALT, AST, and LDL–C levels was observed, accompanied by a decrease in HDL–C and MDA levels in the NAFLD mice model. These findings suggest that FLJ can modulate lipid metabolism, thereby alleviating HFD–induced obesity and liver damage in mice.
SIRT1, an NAD+-dependent deacetylase, has been identified as a potential target for treating metabolic disorders [16]. Recent research suggests that nutraceuticals such as resveratrol [11] and apple polyphenol [15] exert lipid-lowering effects through the SIRT1/AMPK signaling pathway. Our study observed an induction of FLJ in a similar manner. In OA–induced HepG2 cells, SIRT1 and AMPK were downregulated; however, FLJ treatment reversed these effects. Zheng et al. explored the therapeutic potential of a low-molecular–weight (LMW) polysaccharide derived from LJ for the treatment of NAFLD, highlighting its modulation of the SIRT1/AMPK/PGC1α signaling pathway [35]. Fermentation has been shown to increase the phenolic content, with degradation yielding LMW polysaccharides [22]. The hepatoprotective effects of FLJ may be attributed to the synergistic effects of metabolites, including LMW polysaccharides, polyphenols, and unsaturated fatty acids, resulting from probiotic fermentation. SREBP-1, a transcription factor involved in lipid synthesis, regulates the transcription of downstream fat synthesis genes, such as FAS and ACC [36]. FAS, a key enzyme in fatty acid synthesis, plays a crucial role in liver fatty acid metabolism. Activation of AMPK has been shown to inhibit SREBP-1c expression, leading to a decrease in ACC and FAS expression [37]. In our study, FLJ treatment downregulated the expression of SREBP-1 and FAS, thereby reducing lipid accumulation in the liver and alleviating NAFLD (Figure 11). These results suggest that FLJ can modulate hepatic lipogenesis through the AMPK–SREBP-1c–FAS pathway.
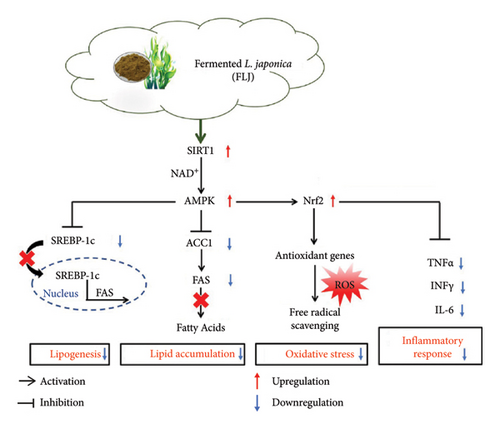
Oxidative stress is a critical factor associated with NAFLD, characterized by the overproduction of ROS [38]. Research has demonstrated that HepG2 cells accumulated elevated levels of ROS when exposed to OA, but this production is significantly diminished with FLJ treatment. Histological analysis diminished that FLJ reduced inflammatory cell infiltration and liver damage induced by a high-fat diet. Furthermore, FLJ significantly lowered the levels of inflammatory cytokines IL-6, IFN-γ, and TNF-α in HFD–fed mice. Various studies have shown that natural products can exert therapeutic effects on NAFLD by activating the AMPK/Nrf2 signaling pathway, which leads to anti-inflammatory and antioxidant effects [11, 39]. The proposed mechanism by which FLJ alleviates NAFLD involves the activation of AMPK, upregulation of Nrf2 expression, and subsequent enhancement of antioxidative enzyme expression to counteract ROS. In addition, the NF-κB signaling pathway plays a crucial role in promoting the release of proinflammatory factors [40]. Moreover, AMPK activation inhibits NF-κB expression, thereby reducing the levels of inflammatory cytokines in the HFD + FLJ group.
5. Conclusion
Collectively, these findings demonstrate the hepatoprotective effect of FLJ by inhibiting lipid accumulation and alleviating oxidative damage and the inflammatory response in OA–induced HepG2 cells in vitro, as well as in HFD–induced NAFLD models in vivo. The potential mechanism underlying this protective effect involves FLJ’s modulation of SIRT1 signaling, which inhibits lipogenesis and lipid accumulation through the AMPK–SREBP-1c–FAS pathway, while also exerting antioxidant effects by activating the Nrf2 signaling pathway. These observations provide new insights and implications for the potential use of FLJ in the management of NAFLD.
Nomenclature
-
- LJ
-
- Laminaria japonica
-
- FLJ
-
- Fermented Laminaria japonica
-
- NFD
-
- Normal fat diet
-
- HFD
-
- High-fat diet
-
- H&E
-
- Hematoxylin and eosin staining
-
- TG
-
- Total triglycerides
-
- TC
-
- Total cholesterol
-
- ALT
-
- Alanine aminotransferase
-
- AST
-
- Aspartate aminotransferase
-
- NAFLD
-
- Nonalcoholic fatty liver disease
-
- SIRT1
-
- Silent information regulator T1
-
- AMPK
-
- AMP–activated protein kinase
-
- SREBP-1c
-
- Sterol regulatory element–binding protein-1c
-
- Nrf2
-
- Nuclear factor erythroid 2–related factor 2
-
- ROS
-
- Reactive oxygen species
-
- NF-κB
-
- Nuclear factor-κB
-
- ACC1
-
- Acetyl-CoA carboxylase 1
-
- FBS
-
- Fetal bovine serum
-
- DMEM
-
- Dulbecco’s Modified Eagle Medium
-
- MTT
-
- 3-(4,5-dimethylthiazol-2-yl)-2,5-diphenyl tetrazolium bromide
-
- DMSO
-
- Dimethyl sulfoxide
-
- OA
-
- Oleic acid
-
- FEN
-
- Fenofibrate
-
- ELISA
-
- Enzyme-linked immunosorbent assay
-
- LDL–C
-
- Low-density lipoprotein cholesterol
-
- HDL–C
-
- High-density lipoprotein cholesterol
-
- FAS
-
- Fatty acid synthase
Conflicts of Interest
The authors declare no conflicts of interest.
Author Contributions
Qiulin Yue: conceptualization, writing–original draft, and investigation. Xianwei Wang: investigation, formal analysis, and data curation. Yongxuan Liu: investigation and formal analysis. Mengrui Cai: investigation and formal analysis. Shousen Guo: investigation and formal analysis. Le Su: methodology. Song Zhang: data curation. Baojun Li: data curation. Chen Zhao: conceptualization, writing, reviewing, editing, and funding acquisition. Lin Zhao: project administration and funding acquisition. Kunlun Li: project administration and funding acquisition.
Funding
This work was supported by the Key Technology Research and Development Program of Shandong Province (Competitive Provincial Innovation Platform Project) (Grant no. 2023CXPT037), the Innovation Capability Improvement Project for SMEs of Shandong Province (Grant no. 2022TSGC1076), the Scientific and Technological Project in Jinan (Grant no. 202131004), and the XPCC Financial Science and Technology Project in 2022 (Grant no. 2022AB002).
Supporting Information
Additional supporting information can be found online in the Supporting Information section.
Supporting data to this article can be found for the formula of HFD and histological quantitative scores.
Open Research
Data Availability Statement
The datasets used and/or analyzed during the current study are available from the corresponding author upon reasonable request.


