Appropriate Fat Supplementation in High-Starch Diets Involved in the Modification of Fatty Acids Profile, Amino Acids Composition, and Antioxidant Capacity of Adult Nile Tilapia (Oreochromis niloticus) Muscle
Abstract
Tilapia industry has faced great challenges due to the replacement of high-quality protein sources by a high proportion of starch. Meanwhile, the level of dietary fat is gradually reduced with the increase of oil price. High starch diets have been proved to have negative effects on flesh quality in previous studies, but the effects of fat remain unclear. The objective of the present study was to ascertain whether fat level is a requisite factor in the flesh quality of adult fish under conditions of high-starch diet feeding. The study involved adult Nile tilapia (Oreochromis niloticus) with an initial body weight (IBW) of 168.58 ± 2.01 g, which were fed a standard (CON) diet, a high-starch-low-fat (HSLF) diet, and a high-starch-moderate-fat (HSMF) diet for 10 weeks. The results demonstrated that the high starch diets significantly decreased the hardness, chewiness, springiness, and gumminess of muscle. HSLF diet led to a significant reduction in the weight gain rate (WGR), accompanied by an increase in crude fat content and a decrease in glycogen content in the muscle. The HSLF diet resulted in a reduction in the levels of polyunsaturated fatty acids (PUFAs), essential amino acids (EAAs), and flavor amino acids (FAAs) in the muscle tissue. Furthermore, it influenced muscle texture by reducing collagen content, fiber density, and sarcomere length. The muscle antioxidant capacity was diminished by affecting the total antioxidant capacity (T-AOC), catalase (CAT) activity, and superoxide dismutase (SOD) activity, as well as the expression levels of related genes (SOD, CAT, and nuclear factor erythroid 2 like 2 (nrf2)). In contrast, the HSMF diet did not have a detrimental impact on growth performance, yet it did result in a significant increase in glycogen content, hydroxyproline (Hyp), PUFAs, EAA, and FAA in muscle tissue. Moreover, the HSMF diet was observed to markedly elevate the antioxidant capacity of the muscle. It can be concluded that high-starch diet can significantly affect flesh quality by affecting the texture and muscle nutrients, as well as decreasing antioxidant capacity. Nevertheless, the inclusion of an adequate quantity of fat may prove an effective means of counteracting these unfavorable outcomes.
1. Introduction
Aquaculture, as the fastest growing sector in global food production, has been improving the nutritional levels of farmed species to meet the demand for high quality seafood in recent years [1]. Nile tilapia (Oreochromis niloticus) is one of the most widely farmed species in the world which has partially solved the problem of food shortage in developing countries [2, 3]. However, with the rapid development of aquaculture industry and the depletion of fishery resources, there is an increasing strain on high-quality feed ingredients [4]. The current situation faced by tilapia industry is to minimize the inclusion of protein and lipid sources in feed formulations to reduce costs. Carbohydrates are economic energy source that could spare protein for growth, and therefore, have been progressively adopted [5]. Starch are typical energy-providing carbohydrate elements. The glycosidic bond of amylose and amylopectin can be hydrolyzed by amylase to produce glucose for use [6]. Corn starch and wheat flour are frequently-used materials that are added directly or supplemented after gelatinization [7–9]. In tilapia, the representative species of omnivorous fish, dietary starch levels have surged to 30% and continued to rise in recent years [10–12]. High starch diets have achieved remarkable results in saving formulation cost. However, the persistent intake poses threat to the growth and health [13].
As energy storage tissue and edible part, the texture of fish muscle is closely associated with the growth state and fish nutritional status and is also greatly affected by dietary starch levels [14–16]. Studies on blunt snout bream (Megalobrama amblycephala) and grass carp (Ctenopharyngodon idellus) have revealed that high starch diet had a significant impact on amino acid composition and fatty acid composition [17]. A high starch diet may cause lower protein efficiency rate and lead to abnormal lipid accumulation that eventually influence the deposition of nutrients in muscle tissue [18].
Although the evidence that excessive starch intake may contribute to the increase of fat synthesis, the essential fatty acids can only be obtained through external supplementation [19]. However, dietary fat has been continued to decrease in recent years to saving costs, which influenced the sensory quality of muscle [20, 21]. Low fat diets also reduce the contents of essential omega-3 polyunsaturated fatty acids (n−3 PUFAs) and the absorption of fat-soluble vitamins which affect the growth of muscle tissue [19, 22]. Besides, the absence of fat can reduce antioxidant substances and increase the risk of muscle oxidation [23]. Therefore, the appropriate dietary fat level is crucial for ensuring the flesh quality. Previous studies have indicated that moderate fat level (76.6–87.9 g/kg) could alleviate the liver and intestinal damage of tilapia caused by high starch diet [24–26]. However, whether moderate fat levels could improve the flesh quality under high starch condition and the underlying mechanisms remain unclear. In the present study, tilapia were fed standard (CON) diet, high-starch-low-fat (HSLF) diet, and high-starch-moderate-fat (HSMF) diet, respectively, to explore the diet effects on flesh quality. The aim of the present study was to provide valuable insights for enhancing the muscle quality of cultured adult Nile tilapia and improve the scientific feed formulation to reduce costs and increase efficiency.
2. Materials and Methods
2.1. Animal Ethics
Fish management and sampling protocols were authorized by the Animal Experimental Ethical Inspection of Laboratory Animal Centre, Yangtze River Fisheries Research Institute, Chinese Academy of Fishery Sciences. The protocol number is YFI20200801.
2.2. Experimental Diets
The optimal starch and fat requirements for tilapia are 300–360 g/kg and 70–100 g/kg, respectively [27]. In the present study we used a CON diet containing 350 g/kg corn starch and 80 g/kg oil. Two high starch diets were prepared, including the HSLF diet (550 g/kg corn starch and 30 g/kg oil) and the HSMF diet (550 g/kg corn starch and 80 g/kg oil). Diet formulation of each group is presented in Table 1. Ingredients were manufactured into feeds with the length of 3 mm and the diameter of 2 mm after grinding, sieving, mixing, pelleting, and drying. The prepared pellet feeds were stored at −20°C for further use. The method for preparing the diet has been fully explained in our previous published research paper [28].
| Ingredient (g/kg) | Diets | ||
|---|---|---|---|
| CON | HSLF | HSMF | |
| Casein | 260.00 | 260.00 | 260.00 |
| Gelatin | 65.00 | 65.00 | 65.00 |
| Fish oil | 40.00 | 0.00 | 40.00 |
| Soybean oil | 40.00 | 30.00 | 40.00 |
| Corn starch | 350.00 | 550.00 | 550.00 |
| Micro-cellulose | 150.00 | 50.00 | 0.00 |
| Bentonite | 50.00 | 0.00 | 0.00 |
| Vitamin premixa | 10.00 | 10.00 | 10.00 |
| Mineral premixb | 10.00 | 10.00 | 10.00 |
| Ca(H2PO4)2 | 20.00 | 20.00 | 20.00 |
| Choline chloride | 2.50 | 2.50 | 2.50 |
| Vitamin C | 2.50 | 2.50 | 2.50 |
| Analyzed nutrients composition (dry matter basis) | |||
| Crude protein (g/kg) | 323.07 | 318.07 | 317.46 |
| Crude lipid (g/kg) | 78.61 | 28.42 | 78.17 |
| Ash (g/kg) | 78.31 | 28.15 | 28.09 |
| Starch (g/kg) | 360.47 | 554.11 | 563.49 |
| Gross energy (MJ/kg) | 19.86 | 20.42 | 19.42 |
- Abbreviations: HSLF, high-starch-low-fat; HSMF, high-starch-moderate-fat.
- aComposition of vitamin premix: vitamin A, 0.8 g; vitamin D3, 0.08 g; vitamin E, 20 g; vitamin K3, 18.3 g; vitamin B1, 10 g; vitamin B2, 12.5 g; vitamin B6, 8 g; nicotinic acid, 12 g; biotin, 3 g; calcium pantothenate, 20 g; folic acid, 3.2 g; inositol, 406 g. All ingredients were diluted with micro-cellulose to 1 kg.
- bComposition of mineral premix: C6H10CaO6 50 g, FeSO4 20 g, MgSO4 100 g, NaH2PO4 100 g, NaCl 20 g, AlCl3 0.6 g, KIO3 0.6 g, KCl 40 g, CuSO4 2 g, MnSO4 4 g, ZnSO4 20 g, CoCl2 2 g. All ingredients were diluted with micro-cellulose to 1 kg.
2.3. Experimental Fish and Procedure
Experimental adult tilapia were purchased from National Tilapia Fish Hatchery (Guangxi province, China) and temporarily cultured with CON diet for 2 weeks after disinfection. The feeding trial was conducted in recirculating aquaculture system of Yangtze River Fisheries Research Institute. There were three experimental groups with three replicates each group to feed the CON diet, the HSMF diet, and the HSLF diet. After 24 h starvation, 90 experimental adult tilapia from the same batch were randomly distributed to nine tanks (300 L water volume) with 10 fish per tank. During the experimental period, the water temperature was 25–28°C, the water pH was 8.1–8.3, the dissolved oxygen was greater than 5 mg/L, and the ammonia nitrogen was less than 0.05 mg/L. Experimental fish were hand-fed to satiation three times daily at 8:30 to 9:00, 12:30 to 13:00 and 17:00 to 17:30. The water volume was renewed about 30% daily and residual feeds were collected to calculate feed conversion ratio (FCR) and removed to maintain water quality.
2.4. Sampling
The initial body weight (IBW) were measured before the feeding trial. At the end of the feeding trial, all experimental fish were starved for 24 h and the final body weight (FBW), weight gain rate (WGR), and condition factor (CF) were measured and calculated. After anesthetization, the axial muscle above the lateral line of six adult tilapia per tank were dissected with different sizes. A total of 18 muscle samples per tank were collected. Six 1.0 cm × 1.0 cm × 0.5 cm muscle samples were used for the detection of texture. Six 0.5 cm × 0.5 cm × 0.5 cm muscle samples were preserved in 4% polyformaldehyde for paraffin section and six 0.2 cm × 0.2 cm × 0.2 cm muscle samples were preserved in 2.5% glutaraldehyde for ultrathin section. The muscle of remaining adult tilapia per tank were dissected and immediately frozen into liquid nitrogen for the determination of contents of amino acids and fatty acids, enzyme activities, and gene expression. Liver, mesenteric fat, and visceral mass were separated and weighed to calculate hepatosomatic index (HSI) and mesenteric fat index (MFI), and viscerosomatic index (VSI).
2.5. Analytical Methods
2.5.1. Proximate Composition Analysis
Moisture of diets was determined by the loss on drying method (GB/T 5009.3-2016). Moisture of muscle was determined using vacuum freeze dryer (CHRIST, Germany). Crude protein, crude fat, and ash were determined by the Kjeldahl method (GB/T 5009.5-2016), the Soxhlet method (GB/T 5009.6-2016), and the muffle furnace method (GB/T 5009.4-2016), respectively. Dietary carbohydrate level was determined by spectrophotometric method (DB12/T 847-2018). Dietary gross energy was determined using an oxygen bomb calorimeter (SDC311, Hunan Sundy Science and Technology Co., Ltd., Changsha, Hunan province, China).
2.5.2. Muscle Texture Detection
Muscle hardness, chewiness, springiness, gumminess, and resilience were evaluated using texture profile analysis method by TVT-300XP texture analyzer (Perten Instruments, Beijing, China). Hardness is indicator of taste which directly affects chewiness, springiness, and gumminess in texture profile analysis. Chewiness was defined as adhesiveness plus springiness that can be interpreted as the energy required to chew solid food. Springiness is the height at which food can be recovered between the end of the first bite and the beginning of the second. Gumminess is defined as hardness plus cohesiveness which can describe the taste of semisolid foods. Resilience is defined as the ratio of the area before the deformation target to the area after the deformation target during the first pressing down. The detection was performed with a cylindrical probe P-cy5s with pretest speed of 2 mm/s, post-test speed of 2 mm/s, test speed of 1 mm/s, interval time of 5 s, compression ratio of 60%, and data acquisition rate of 200 pps. The water holding capacity is the ability of proteins to absorb and retain water in protein tissues, which was detected according to previous publications [29].
2.5.3. Muscle Hydroxyproline (Hyp) Content Determination
The Hyp content of three muscle samples per tank were determined according to published paper [30]. Briefly, the 1 g muscle was accurately weighed and homogenized with 9 mL precooled distilled water. Then the precooled NaOH (0.2 M) was added into the homogenate and oscillated at 4°C for 4 h, followed by centrifugation under 10000 × g for 30 min at 4°C. The supernatant was separated to obtain alkaline-soluble Hyp. The sediment (alkaline-insoluble Hyp) was transferred into 3 mL hydrochloric acid (6 M) in ampoule and hydrolyzed at 110°C for 20 h.
2.5.4. Antioxidant Capacity Evaluation
The supernatant used for testing were obtained by homogenization (0.5 g muscle tissue and 4.5 mL deionized water) and centrifugation (3000 × g, 10 min, 4°C). The follow indices were measured with commercial kits (Nanjing Jiancheng Bio-Engineering Institute, Nangjing, China).
The total protein (TP) content was determined by the TP quantitative assay with coomassie brilliant blue method and calculated by measuring theabsorbance of solution at 595 nm.
Total antioxidant capacity (T-AOC) was quantified measured using Trolox as standard and T-AOC can be expressed in terms of the amount of Trolox.
Catalase (CAT) activity was determined using the ammonium molybbate method. The decomposition of H2O2 by CAT can be quickly stopped by the addition of ammonium molybbate and the remaining H2O2 reacted with ammonium molybbate to form a pale yellow complex. The content of the complex was determined at 405 nm.
Superoxide dismutase (SOD) activity was assayed with hydroxylamine method. Superoxide anion free radicals produced by the reaction system of xanthine and xanthine oxidase oxidize hydroxylamine to form nitrite and demonstrate purple and red. The absorbance values were measured at 550 nm.
2.5.5. Histological Analysis
The paraffin section and hematoxylin and eosin staining were carried out according to the methods of previous study using the 0.5 cm × 0.5 cm × 0.5 cm muscle samples [31]. The stained sections were observed with optical microscope (Olympus BX53, Tokyo, Japan). Ultrathin sections prepared with 0.2 cm × 0.2 cm × 0.2 cm muscle samples were prepared and observed with transmission electron microscope (HT7800, Tokyo, Japan) in Wuhan Servicebio Technology Co., Ltd. The fiber diameters, fiber density, sarcomere length, I band length, and A band length were measured with Image-J software. Fiber density was calculated according to the number of muscle fibers of unit area. Fiber diameters, sarcomere length, I band length, and A band length were measured, as shown in Figure 1.


2.5.6. Fatty Acid Composition Determination
The 0.4 g freeze-dried muscle was weighed, vortexed, and mixed with 4 mL isooctane for 30 s, and shaken at 25°C overnight for extraction. The extracted solution was mixed with 8 mL 2% sodium hydroxide solution in methanol and slightly boiled for 40 min, mixed with 7 mL 15% trifluoro (methanol) boron and slightly boiled for 20 min, and mixed with 20 mL n-heptane and slightly boiled for 1 min, successively. Saturated sodium chloride solution was then added and stood to layering. A 5 mL of the upper n-heptane extraction solution was separated and mixed with 5 g anhydrous sodium sulfate. The mixture was shaken for 1 min and stood for 5 min. The supernatant was then extracted into loading bottle. Fatty acid contents were determined with gas chromatograph (Agilent 7890 A, Beijing, China). Polydicyanpropyl siloxane capillary column with strong polar stationary phase was used with 1 μL of injection volume and 270°C and 280°C with the injection and detection port temperatures. The temperature was set up as follows: first 13 min at 100°C, and then the temperature was increased to 180°C at a rate of 10°C per min and maintained for 6 min. Then, the temperature was increased to 200°C at a rate of 1°C per min and stayed there for 20 min. After reaching 230°C at a rate of 4°C per min, the temperature was maintained for 10.5 min. The carrier was nitrogen gas, and the split ratio was 100:1. The fatty acid content was calculated according to the ratio of the peak area of different fatty acids to the peak area of the internal standard (C11:0) [32].
2.5.7. Amino Acid Composition Determination
Bound amino acid contents were determined as follows method: The 0.1 g freeze-dried muscle was accurately weighed and transferred into 12 mL hydrochloric acid (6 M) in ampoule and hydrolyzed at 110°C for 24 h. After cooling, the hydrolysate was filled to 100 mL with ultrapure water, and 2 mL was placed in a vial and dried in a vacuum dryer at 60°C for 24 h. After complete evaporation, 2 mL distilled water was added and returned to the vacuum dryer for 24 h. The precipitate was dissolved in 8 mL hydrochloric acid (0.1 M), filtered through a 0.22 μm aqueous phase filter membrane into amino acid loading bottle, and detected with an amino acid analyzer (HITICHI L-8900, Tokyo, Japan) [32].
Free amino acids were determined as follows method: The 0.1 g muscle was accurately weighed and added into 3 mL sulfosalicylic acid (10%) for homogenization. The 400 μL serum was added into 1.2 mL sulfosalicylic acid (10%) for homogenization and centrifugation (13000 × g, 15 min, 4°C). The supernatant was extracted, filtered through a 0.22 μm aqueous phase filter membrane into amino acid loading bottle and detected with an amino acid analyzer (HITICHI L-8900, Tokyo, Japan) [32].
2.5.8. cDNA Synthesis and RT-qPCR
Muscle samples were immediately transferred from −80°C to liquid nitrogen for grinding. The procedure of total RNA extraction was conducted using TRIzol (Life Technologies, Carlsbad, CA, USA) under the guidance of instruction book. After integrity and concentration testing, RNA was reverse transcribed to cDNA using PrimeScript RT kit (Takara, Dalian, Liaoning province, China) under the guidance of instruction book. In this study, qPCR experiments were performed using at least three biological replicates. The RT-qPCR was carried out using the SYBR Premix Ex Taq kit (Takara, Dalian, Liaoning province, China). The 20 μL reaction system was prepared with 10 μL SYBR Premix Ex Taq, 0.8 μL forward primer (10 μM), 0.8 μL reverse primer (10 μM), 0.4 μL 50 × ROX Reference Dye Ⅱ, 6 μL DEPC water, and 2 μL cDNA template. The RT-qPCR program was set up as follow: 95°C for 5 min, followed by 40 cycles of 95°C for 30 s, 58°C for 30 s, and 72°C for 30 s. Then 72°C for 5 min. A standard curve was constructed using six tenfold gradient dilutions of cDNA. After the qPCR reaction, the log value of the serial dilution of the template was used as the X-axis, and the corresponding Ct value was used as the Y-axis to plot the standard curve. Primer sequences used in the present study was designed and synthesized by Sangon Biotech (Shanghai, China) according to the to the corresponding sequences in GenBank. The mRNA expression levels of myogenic differentiation 1 (myod), located on the complementary strand between positions 3,598,005 and 3,600,314, myogenin (myog), located between positions 25,640,809 and 25,643,049, myogenic factor 5 (myf5), located between positions 15,815,227 and 15,818,324, and myogenic factor 6 (myf6), located between positions 15,824,384 and 15,838,147, were determined to assess the development of myofibers. Additionally, the mRNA expressions of nuclear factor erythroid 2 like 2 (nrf2), located between positions 17,007,276 and 17,013,930, CAT (cat), located between positions 45,270,104 and 45,279,554, and SOD 1 (sod), were detected to evaluate the antioxidant capacity of muscle (Table 2). The 2−ΔΔCt method was applied to normalize fluorescence data to β-actin [33]. Briefly, The Ct values of target genes were normalized to those of β-actin, and relative expression levels were calculated using the ΔΔCt method. Specifically, ΔCt was calculated as Ct (target) − Ct (β-actin), and ΔΔCt was determined as ΔCt (experimental) − ΔCt (control), with relative expression quantified as 2−ΔΔCT.
| Primers | Accession number | Primer sequence | Product length (bp) | Tm (°C) |
Correlation efficiency (%) | |
|---|---|---|---|---|---|---|
| β-Actin | XM_003443127.5 | Forward | TCGTGCGTGACATCAAGGAGAAG | 180 | 60 | 99.7 |
| Reverse | CAAGGAAGGAAGGCTGGAAGAGG | |||||
| myod | NM_001279720.1 | Forward | CCTCCTCTTCATCCTCATCCTCC | 181 | 60 | 96.5 |
| Reverse | GCGTTGGTCGTCTTCCTCTTG | |||||
| myog | NM_001279526.1 | Forward | GAGGAGCACGCTGATGAACC | 185 | 59 | 98.5 |
| Reverse | CGCTTGACGACGACACTCTG | |||||
| myf5 | XM_005456634.3 | Forward | GGCGGCTGAAGAAGGTGAAC | 121 | 58 | 97.8 |
| Reverse | AGGCTCTCGATGTACTGGATGG | |||||
| myf6 | NM_001282891.1 | Forward | CCTCCGCTGACCATTCCACTT | 116 | 60 | 98.6 |
| Reverse | GCTGTCGTTGGTGATGCTGTC | |||||
| nrf2 | XM_003447296.5 | Forward | GCTGGACTCGCTGAAGGAAGA | 184 | 58 | 99.2 |
| Reverse | GCCATCCGTTGACTGCTGAAG | |||||
| cat | XM_003447521.5 | Forward | CCCATCCTTCGTTCATTCCCAGAA | 175 | 58 | 97.8 |
| Reverse | GGTGTGAGAGCCGTAGCCATTC | |||||
| sod | XM_003446807.4 | Forward | GCCCACACTTCAATCCCTACAA | 219 | 56 | 96.7 |
| Reverse | GGCTCTCTTCATTTCCTCCTTT | |||||
- Abbreviations: cat, catalase; myf5, myogenic factor 5; myf6, myogenic factor 6; myod, myogenic differentiation 1; myog, myogenin; nrf2, nuclear factor erythroid 2 like 2; sod, superoxide dismutase 1.
2.6. Calculations and Statistical Analysis
Statistical analysis was carried out with IBM SPSS Statistics 23.0 (SPSS Inc., USA). Data were subjected to one-way analysis of variance (ANOVA) followed by Tukey’s test. p < 0.05 was applied to show statistically significant differences. Results were presented as mean ± standard deviation (SD).
3. Results
3.1. Growth Performance
Growth performance of tilapia is shown in Table 3. The HSLF diet resulted in a significant decrease in FBW and WGR and significant increase in FCR, MFI, and VSI (p < 0.05). HSMF diet did not have a negative effect on WGR and FCR compared to the CON group (p > 0.05), but also induced significant enhancement of HSI, MFI, and VSI (p < 0.05). The CF was significantly higher when fish were fed the HSMF diet (p < 0.05).
| Parameters2 | Diets | ||
|---|---|---|---|
| CON | HSLF | HSMF | |
| IBW (g)3 | 168.63 ± 2.86 | 168.63 ± 2.75 | 168.47 ± 1.55 |
| FBW (g)3 | 502.03 ± 27.68b | 396.55 ± 9.68a | 497.19 ± 17.71b |
| WGR (%)3 | 197.62 ± 12.97b | 135.19 ± 6.69a | 195.17 ± 12.03b |
| FCR3 | 1.12 ± 0.04a | 1.55 ± 0.04b | 1.16 ± 0.08a |
| HSI (%)3 | 1.82 ± 0.03a | 1.96 ± 0.09ab | 2.02 ± 0.04b |
| MFI (%)3 | 2.14 ± 0.18a | 2.78 ± 0.07b | 2.52 ± 0.11b |
| VSI (%)3 | 8.05 ± 0.60a | 8.90 ± 0.58b | 9.25 ± 0.80b |
| CF (g/cm3) | 3.89 ± 0.07a | 3.78 ± 0.01a | 4.10 ± 0.03b |
- Abbreviations: HSLF, high-starch-low-fat; HSMF, high-starch-moderate-fat; SD, standard deviation.
- 1Data are presented as mean ± SD (n = 3). Different superscript letters (a and b) within the same row indicate significant differences (p < 0.05). Each row sharing the same superscript letter or absence of superscript are not significantly different (p > 0.05).
- 2IBW, initial body weight; FBW, final body weight; WGR, weight gain rate; CF, condition factor; FCR, feed conversion ratio; HSI, Hepatosomatic index, MFI, mesenteric fat index; VSI, viscerosomatic index.
- 3Data are originated from our preliminary findings [34] (https://doi.org/10.1016/j.aqrep.2025.102639).
3.2. Muscle Proximate Composition
As shown in Table 4, neither HSLF nor HSMF diets had significant effects on the moisture, crude protein, or ash (p > 0.05). Compared with the CON group, HSLF diet significantly increased crude fat and decreased the glycogen content, while HSMF diet significantly increased the glycogen content (p < 0.05).
| Parameters (g/kg) | Diets | ||
|---|---|---|---|
| CON | HSLF | HSMF | |
| Crude protein | 177.03 ± 5.34 | 179.97 ± 3.45 | 176.15 ± 3.69 |
| Crude fat | 24.67 ± 2.83a | 32.87 ± 3.93b | 24.03 ± 2.59a |
| Moisture | 769.89 ± 6.45 | 762.00 ± 8.31 | 769.4 ± 7.68 |
| Ash | 12.18 ± 0.70 | 12.37 ± 0.87 | 12.32 ± 0.57 |
| Glycogen | 0.99 ± 0.14b | 0.66 ± 0.09a | 1.46 ± 0.24c |
- Abbreviations: HSLF, high-starch-low-fat; HSMF, high-starch-moderate-fat; SD, standard deviation.
- 1Data are presented as mean ± SD (n = 3). Different superscript letters (a, b, and c) within the same row indicate significant differences (p < 0.05). Each row sharing the same superscript letter or absence of superscript are not significantly different (p > 0.05).
3.3. Muscle Texture
Results of indices related to muscle texture are presented in Table 5. Both HSLF and HSMF diets significantly decreased the hardness, chewiness, springiness, and gumminess of muscle compared to the CON group (p < 0.05). Only HSLF diet remarkably decreased the resilience of muscle (p < 0.05).
| Parameters | Diets | ||
|---|---|---|---|
| CON | HSLF | HSMF | |
| Hardness (gf) | 2361.70 ± 113.44b | 2147.60 ± 89.42a | 2157.20 ± 108.03a |
| Chewiness (gf) | 403.88 ± 10.45b | 372.12 ± 7.86a | 370.76 ± 9.87a |
| Springiness | 0.55 ± 0.03b | 0.48 ± 0.04a | 0.51 ± 0.04a |
| Gumminess | 721.96 ± 43.16b | 650.70 ± 29.02a | 635.05 ± 24.43a |
| Resilience | 0.36 ± 0.05b | 0.29 ± 0.03a | 0.33 ± 0.06b |
| Water holding capacity (%) | 87.21 ± 1.18 | 86.48 ± 0.75 | 86.80 ± 0.81 |
- Abbreviations: HSLF, high-starch-low-fat; HSMF, high-starch-moderate-fat; SD, standard deviation.
- 1Data are presented as mean ± SD (n = 3). Different superscript letters (a and b) within the same row indicate significant differences (p < 0.05). Each row sharing the same superscript letter or absence of superscript are not significantly different (p > 0.05).
3.4. Muscle Hyp Content
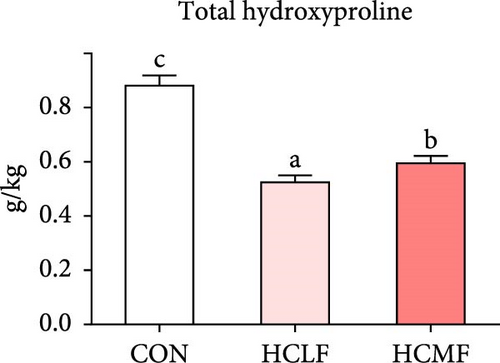
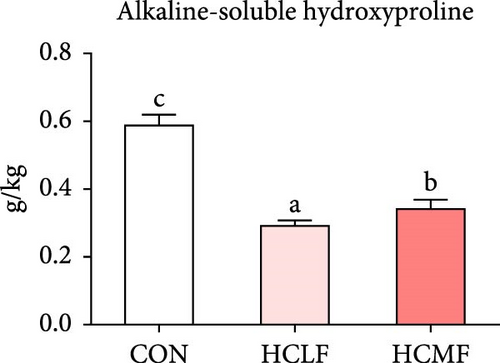
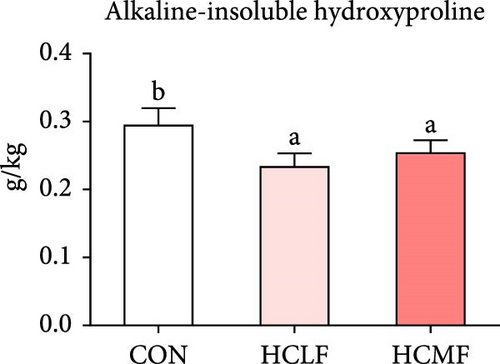
Hyp contents are exhibited in Figure 2. Compared with the CON group, both HSLF and HSMF diets significantly decreased the contents of total Hyp, alkaline-soluble Hyp, and alkaline-insoluble Hyp (p < 0.05). Compared with the HSLF group, the contents of total Hyp and alkaline-soluble Hyp were remarkably higher in HSMF group (p < 0.05).
3.5. Muscle Histology and Related Gene Expression
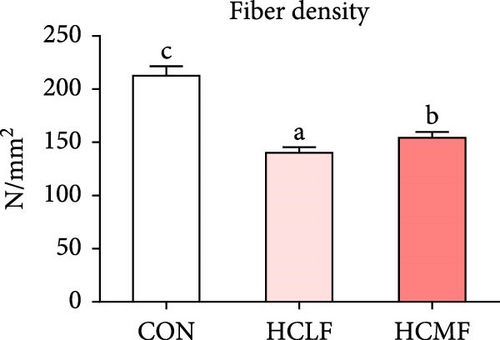
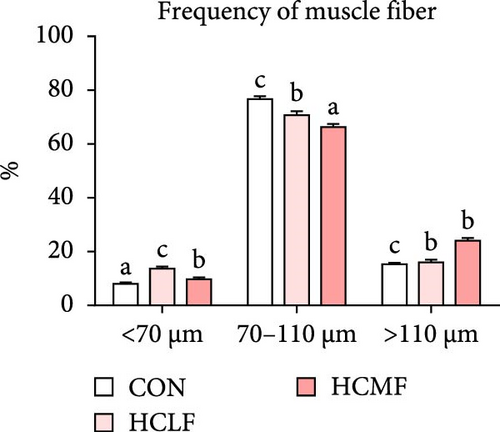
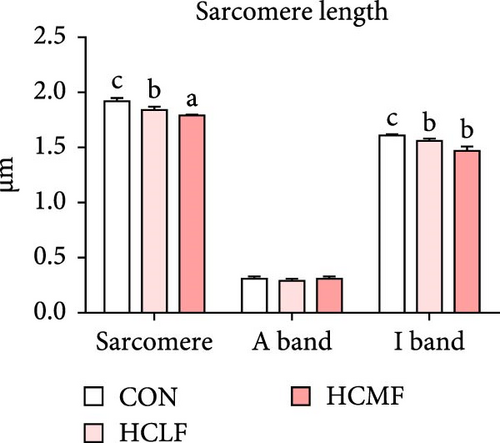
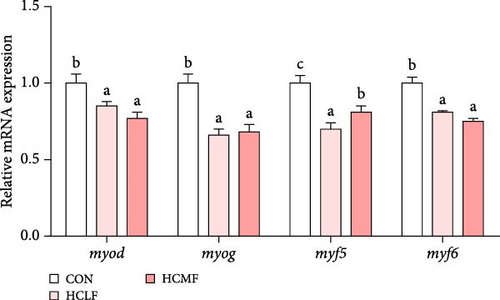
Both HSLF and HSMF diets significantly influenced the histology and development of muscle tissue of tilapia (Figure 1). Compared with the CON group, HSLF and HSMF diets significantly reduced the fiber density of muscle (p < 0.05; Figure 3A). The proportion of fiber with diameters ranged from 70–100 μm was significantly decreased while the proportion of fiber with diameters less than 70 μm was remarkably increased (p < 0.05; Figure 3B). The sarcomere length and A band length were significantly lower (p < 0.05; Figure 3C). Furthermore, HSLF and HSMF diets significantly downregulated the mRNA expression levels of myod, myog, myf5, and myf6 (p < 0.05). The level of myf5 was higher in HSMF group compared to HSLF group (p < 0.05; Figure 3D).
3.6. Muscle Fatty Acids Composition
A total of 24 fatty acids were detected in the present study, including eight saturated fatty acids (SFAs), seven monounsaturated fatty acids (MUFAs), and nine PUFAs (Table 6). Compared with the CON group, HSLF diet remarkably increased the contents of SFAs and MUFAs, but decreased the content of PUFAs, especially n−3 PUFAs represented by C20 : 5n−3 (EPA) and C22 : 6n−3 (DHA; p < 0.05). HSMF diet also significantly decreased the contents of PUFAs, however, compared with the HSLF group, the contents of n−3 PUFAs and DHA were remarkably higher (p < 0.05). Moreover, the ratio of n−3 PUFAs to n−6 PUFAs and PUFAs to SFAs were remarkably lower in HSLF group compared to other groups (p < 0.05).
| Parameters (mg/kg) | Diets | ||
|---|---|---|---|
| CON | HSLF | HSMF | |
| C12:0 | 0.031 ± 0.00 | 0.035 ± 0.01 | 0.036 ± 0.01 |
| C14:0 | 0.62 ± 0.03a | 1.07 ± 0.04c | 0.84 ± 0.04b |
| C15:0 | 0.103 ± 0.00b | 0.06 ± 0.01a | 0.089 ± 0.01b |
| C16:0 | 6.76 ± 0.51a | 9.73 ± 1.08b | 5.93 ± 0.58a |
| C17:0 | 0.105 ± 0.0c | 0.074 ± 0.00a | 0.098 ± 0.00b |
| C18:0 | 1.94 ± 0.06b | 2.89 ± 0.04c | 1.72 ± 0.03a |
| C20:0 | 0.093 ± 0.00b | 0.095 ± 0.00b | 0.082 ± 0.01a |
| C22:0 | 0.064 ± 0.01 | 0.055 ± 0.01 | 0.055 ± 0.00 |
| SFAs | 9.68 ± 0.53a | 14.01 ± 1.59b | 8.85 ± 0.63a |
| C14:1n−5 | 0.046 ± 0.00 | 0.044 ± 0.01 | 0.041 ± 0.01 |
| C16:1n−7 | 1.38 ± 0.18a,b | 1.77 ± 0.22b | 1.23 ± 0.16a |
| C17:1n−7 | 0.054 ± 0.01 | 0.056 ± 0.01 | 0.054 ± 0.00 |
| C18:1n−9 | 7.94 ± 0.89a | 12.12 ± 1.66b | 6.96 ± 0.50a |
| C20:1n−9 | 0.42 ± 0.04a | 0.63 ± 0.08b | 0.36 ± 0.02a |
| C22:1n−9 | 0.102 ± 0.01b | 0.111 ± 0.00b | 0.072 ± 0.01a |
| C24:1n−9 | 0.084 ± 0.01b | 0.062 ± 0.01a | 0.064 ± 0.01a |
| MUFAs | 10.02 ± 1.11a | 14.79 ± 1.99b | 8.78 ± 0.65a |
| C18:2n−6 | 4.10 ± 0.39 | 3.77 ± 0.25 | 3.45 ± 0.23 |
| C18:3n−6 | 0.16 ± 0.00b | 0.25 ± 0.01c | 0.13 ± 0.00a |
| C20:2n−6 | 0.20 ± 0.02 | 0.19 ± 0.01 | 0.18 ± 0.01 |
| C20:3n−6 | 0.23 ± 0.03a,b | 0.30 ± 0.01b | 0.21 ± 0.04a |
| C20:4n−6 | 0.52 ± 0.01b | 0.69 ± 0.04c | 0.45 ± 0.00a |
| n−6 PUFAs | 5.21 ± 0.26 | 5.19 ± 0.16 | 4.42 ± 0.12 |
| C18:3n−3 | 0.39 ± 0.04b | 0.30 ± 0.03a | 0.32 ± 0.01a,b |
| C20:3n−3 | 0.083 ± 0.01 | 0.079 ± 0.02 | 0.071 ± 0.01 |
| C20:5n−3 | 0.17 ± 0.01b | 0.13 ± 0.01a | 0.14 ± 0.01a,b |
| C22:6n−3 | 2.07 ± 0.10c | 0.58 ± 0.04a | 1.81 ± 0.03b |
| n−3 PUFAs | 2.71 ± 0.05c | 1.09 ± 0.06a | 2.34 ± 0.01b |
| PUFAs | 7.92 ± 0.44b | 6.28 ± 0.38a | 6.77 ± 0.19a |
| n−3 PUFAs/n−6 PUFAs | 0.52 ± 0.03b | 0.21 ± 0.01a | 0.53 ± 0.01b |
| PUFAs/SFAs | 0.82 ± 0.03b | 0.45 ± 0.01a | 0.77 ± 0.04b |
- Abbreviations: HSLF, high-starch-low-fat; HSMF, high-starch-moderate-fat; MUFA, monounsaturated fatty acid; PUFA, polyunsaturated fatty acid; SD, standard deviation; SFA, saturated fatty acid.
- 1Data are presented as mean ± SD (n = 3). Different superscript letters (a, b, and c) within the same row indicate significant differences (p < 0.05). Each row sharing the same superscript letter or absence of superscript are not significantly different (p > 0.05).
3.7. Muscle Bound Amino Acids Composition
A total of 17 bound amino acids were detected (Table S1). There were no significant differences between three groups on level of individual amino acid. However, compared with the CON group, HSLF diet significantly decreased essential amino acids (EAAs) levels, while the level of non-EAAs (NEAAs) was enhanced (p < 0.05; Figure S1). HSMF also increased NEAA level, but had no significant impact on EAA level (Figure S1).
3.8. Muscle Free Amino Acids Composition
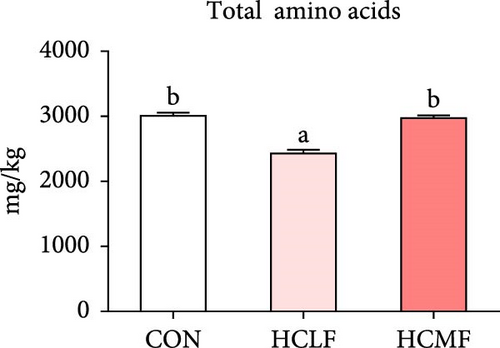
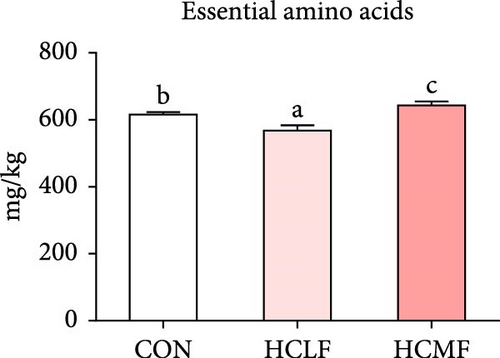
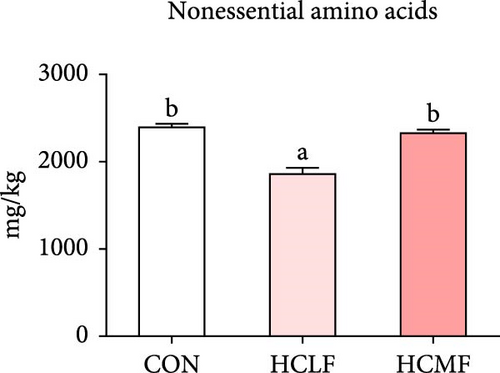
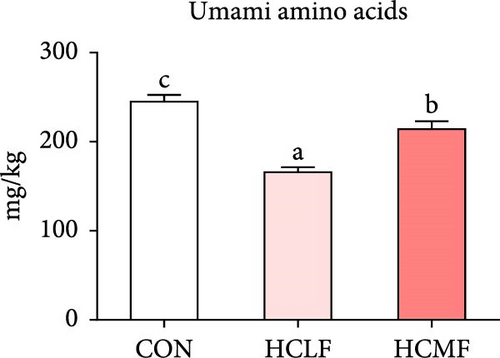
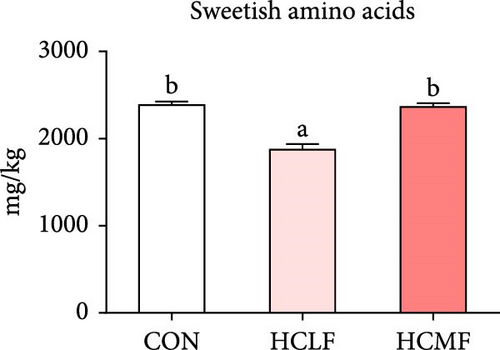
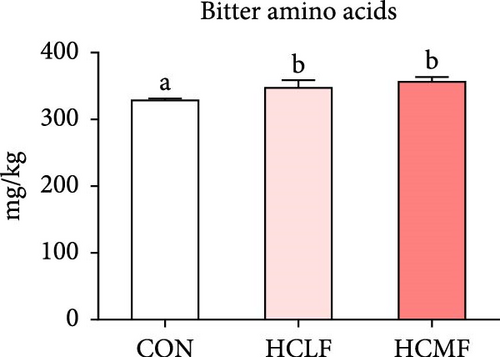
A total of 16 free amino acids were detected (Table 7). Compared with the CON group, HSLF diet significantly decreased levels of total amino acids (TAA), EAA, and NEAA (p < 0.05; Figure 4). Isoleucine, lysine, methionine, threonine, threonine, alanine, glutamate, proline, and tyrosine levels were significantly lower, while arginine, histidine, glycine, and serine levels were significantly enhanced (p < 0.05; Table 7). HSMF diet significantly increased the level of NEAA (p < 0.05). Isoleucine, threonine, glutamate, serine, and tyrosine levels were significantly lower, while arginine, histidine, leucine, lysine, alanine, aspartate, and glycine levels were significantly higher (p < 0.05). Compared with the HSLF group, the levels of TAAs and EAAs were remarkably higher when fish fed with HSMF diet (p < 0.05; Figure 4). Furthermore, high starch diets influenced the muscle flavor amino acids (FAAs). Compared with the CON group, HSLF diet significantly decreased the levels of umami amino acids and sweetish amino acids while increased the level of bitter amino acids (p < 0.05; Figure 4). HSMF diet had same effects on the levels of umami and bitter amino acids as HSLF diet (p < 0.05; Figure 4). However, the sweetish amino acids returned to CON levels in HSMF group (p < 0.05; Figure 4).
| Parameters (mg/kg) | Diets | ||
|---|---|---|---|
| CON | HSLF | HSMF | |
| EAAs | |||
| Arginine | 12.07 ± 1.47a | 16.49 ± 0.82b | 16.59 ± 0.95b |
| Histidine | 211.00 ± 2.81a | 247.04 ± 9.72c | 228.58 ± 9.66b |
| Isoleucine | 25.73 ± 0.77c | 14.48 ± 0.36a | 20.40 ± 1.08b |
| Leucine | 25.88 ± 1.04a | 25.41 ± 1.11a | 33.78 ± 0.54b |
| Lysine | 122.34 ± 3.36b | 79.39 ± 3.35a | 147.80 ± 3.20c |
| Methionine | 19.75 ± 0.59b | 14.57 ± 1.08a | 21.03 ± 1.07b |
| Phenylalanine | 20.30 ± 1.58 | 18.82 ± 0.77 | 18.69 ± 1.14 |
| Threonine | 144.60 ± 7.07b | 122.26 ± 6.11a | 120.66 ± 6.57a |
| Valine | 34.23 ± 1.46b | 29.12 ± 1.49a | 35.80 ± 1.10b |
| NEAA | |||
| Alanine | 287.79 ± 5.06b | 89.69 ± 3.69a | 304.02 ± 6.31c |
| Aspartate | 75.56 ± 5.33a | 73.81 ± 5.11a | 86.06 ± 4.53b |
| Glycine | 396.73 ± 11.26a | 502.43 ± 8.69c | 431.07 ± 19.77b |
| Glutamate | 169.50 ± 4.80c | 92.18 ± 3.40a | 128.06 ± 6.22b |
| Proline | 1292.18 ± 34.88b | 789.61 ± 72.91a | 1242.58 ± 46.76b |
| Serine | 143.83 ± 8.14b | 290.21 ± 12.72c | 118.15 ± 7.94a |
| Tyrosine | 28.27 ± 0.94c | 21.96 ± 1.12b | 18.59 ± 0.91a |
- Abbreviations: EAA, essential amino acid; HSLF, high-starch-low-fat; HSMF, high-starch-moderate-fat; NEAA, non-EAA; SD, standard deviation.
- 1Data are presented as mean ± SD (n = 3). Different superscript letters (a, b, and c) within the same row indicate significant differences (p < 0.05). Each row sharing the same superscript letter or absence of superscript are not significantly different (p > 0.05).
3.9. Muscle Antioxidant Capacity
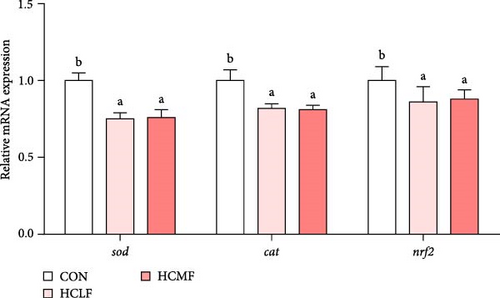
Both HSLF and HSMF diets significantly reduced the T-AOC, activity of CAT, and activity of SOD (p < 0.05; Table 8). The mRNA expression of sod, cat, and nrf2 were also downregulated (p < 0.05; Figure 5). Compared to the HSLF group, the T-AOC and the activity of SOD was significantly higher when fish fed with HSMF diet (p < 0.05; Table 8).
| Parameters2 | Diets | ||
|---|---|---|---|
| CON | HSLF | HSMF | |
| T-AOC (mmol/mgprot) | 0.31 ± 0.031c | 0.19 ± 0.03a | 0.26 ± 0.03b |
| CAT (U/mgprot) | 12.63 ± 1.55c | 8.56 ± 1.01b | 6.23 ± 0.99a |
| SOD (U/mgprot) | 19.18 ± 0.51c | 16.61 ± 0.39a | 18.3 ± 0.44b |
- Abbreviations: HSLF, high-starch-low-fat; HSMF, high-starch-moderate-fat; SD, standard deviation.
- 1Data are presented as mean ± SD (n = 3). Different superscript letters (a, b, and c) within the same row indicate significant differences (p < 0.05). Each row sharing the same superscript letter or absence of superscript are not significantly different (p > 0.05).
- 2T-AOC, total antioxidant capacity; CAT, catalase; SOD, superoxide dismutase.
4. Discussion
4.1. Growth Performance
Lipids are indispensable nutrients for growth and metabolic processes. The rise in the price of feed oil has resulted in a deficiency of lipids in fish feed. In the present study, we used a HSLF diet containing 554 g/kg starch and 28 g/kg fat to simulate the starch and lipid level of commercial feed used in practical production. Results showed that HSLF diet delayed the weight gain of adult tilapia during natural development. A deficiency in dietary fat may result in a deficiency of EFAs, which can affect the absorption and metabolism of other nutrients, potentially leading to the growth retardation [35]. After feeding HSMF diet, the WGR of tilapia reached a level comparable to that observed the CON group. The CF of fish were also increased which may be resulted by the increase of HSI. Under the condition of a certain dietary protein level, the moderate fat supplementation may facilitate a synergistic effect in the utilization of starch and lipids, thus, improving growth performance [36].
Besides, the HSLF diet significantly enhanced the crude fat in muscle. Fish has limited ability to utilize starch. The excessive starch will be converted into fat and transported to other tissues for storage and energy providing when the dietary fat level was insufficient [24]. Studies have found that the muscle glycogen content of tilapia increases with the increase of dietary starch content [37]. However, muscle glycogen content was reduced in tilapia of HSLF group. Tilapia tend to preferentially use lipids to provide energy compared to starch [38]. The lack of dietary fat may have caused glycogenolysis to provide energy and thus contributed to the decline in muscle glycogen content [35].
4.2. Flesh Quality of Tilapia
Flesh quality directly affect the preference and acceptance of consumers for aquatic products [39]. In the present study, the flesh quality of tilapia was evaluated from perspectives of texture, nutritional value, flavor, and antioxidant capacity.
4.2.1. Muscle Texture
In the present study, high starch diets caused a decline in hardness, chewiness, springiness, gumminess, and resilience, which was consistent with study on M. amblycephala [40]. Since muscle texture is closely related to myofiber [41, 42], muscle histology was further investigated. Results showed high starch diets decreased the myofiber density and sarcomere length which was positive correlated with the hardness and chewiness of muscle [43]. Furthermore, the expression of MRFs family gene were detected. The myod, myog, myf5, and myf6 play important role in myofiber differentiation, myofiber proliferation, and myogenesis and are involved in the regulation of muscle texture [41]. Similar to previous reports in rainbow trout (Oncorhynchus mykiss) and grass carp (Ctenopharyngodon idellus), the high starch diets significantly downregulated the expression level of these genes and inhibit the formation of myofiber and myocyte [44, 45]. Moderate fat supplementation also showed improvement in this regard with increased myofiber density and mRNA expression of myf5 compared to the HSLF diet. Previous studies have shown that the expression levels of MRFs were positive correlated with contents of methionine, cystine, and lysine [46, 47]. HSLF diet, instead of HSMF diet, caused a decrease in amino acids level mentioned above, which may be the reason for the inhibition of MRFs gene expression.
As the main component of connective tissue, collagen protein directly affects muscle hardness. The content of collagen protein was usually expressed by Hyp content [42]. In the present study, both HSLF and HSMF diets decreased the contents of total Hyp, alkaline-soluble Hyp and alkaline-insoluble Hyp. Previous studies on mouse have demonstrated that high carbohydrate could inhibit the type 1 and type 2 procollagen protein of desmocyte, downregulate mRNA expression of timp2, and upregulate mRNA expression of mmp2 [48]. High starch diets might reduce collagen protein synthesis in the way described above. Moreover, HSMF had positive effect on improving the content of total Hyp and alkaline-soluble Hyp compared to HSLF diet. Similar results can be found in study on grass carp that indicated moderate fat level can promote the transcription and translation of collagen protein [45]. The above results suggested excessive starch diets influenced the muscle texture of adult tilapia and moderate fat supplementation promoted the development of myofiber and collagen synthesis.
4.2.2. Nutritional Value
Nutritional value of muscle is mainly determined by the fatty acids and amino acids profiles [49, 50]. Fatty acid composition of muscle is influenced by dietary fat level [51]. Studies have been conducted in a variety of fish, but the results vary due to species and developmental stages [52–54]. In the present study, HSLF diet significantly reduced the contents of n−3 PUFAs, especially the contents of EPA and DHA, representing a decline in food quality and unhealthy fatty acid distribution [55, 56]. The biosynthesis of PUFAs in fish, including DHA and EPA, is related to the elongation and desaturation of fatty acids mediated by fatty acid elongase (ELO) and fatty acid desaturation (FAD) enzyme. The activities of ELO and FAD enzymes vary with the potential variation of fatty acid composition caused by increased or reductive dietary fat [57]. Therefore, the significant reduction of PUFAs in the HSLF group may also be due to the inadequate fish oil ingestion which caused deficiency in some fatty acids. Moreover, the contents of SFAs and MUFAs were increased in HSLF group. The high contents of SFAs and MUFAs may lead to fat accumulation and affect muscle texture and taste [17]. The ratio of PUFAs to SFAs and n−3 PUFAs to n−6 PUFAs, indicators reflecting the nutritional value of dietary foods were significantly lower when fish fed with HSLF diet [58, 59]. Normal PUFAs/SFAs ranges from 0.51−0.56, and ratios of n−6/n−3 ranges from 0.25−1.00 [60]. Apparently, the original fatty acid balance was disturbed by the HSLF diet due to the lack of fish oil. When tilapia feeding the HSMF diet, the above indices were closer to those of the control group.
The higher proportion of bound EAAs to total bound amino acids in muscle means the higher nutritional value [26]. In the present study, high starch diets did not affect the level of individual amino acid, while total bound EAA were significantly lower when fish feeding the HSLF diet. Meanwhile, tilapia feeding the HSMF diet showed no significant effect on bound EAA compared to the CON group. These results indicated that the moderate fat supplementation is beneficial to the construction of healthier bound amino acid profile, which improved the edibleness of flesh.
4.2.3. Flavor
Flavor of food is produced by the cumulative effect of existing substances [61]. Flesh flavor was explored in terms of fatty acids and amino acids in this study. The proportion for unsaturated fatty acids strongly affect flavor formation, especially fatty acids with more than two double bonds [62]. In the present study, high starch diets reduced levels of PUFAs and n−3 PUFAs, while enhanced the level of myristic acid (C14:0), another flavor fatty acid used as flavoring agent in food items [63]. These results suggested that muscle of tilapia feeding high starch diets might form unique flavor unlike CON group. Such difference also existed between HSLF group and HSMF group because of differences in fatty acids levels. Similar results were found in studies on yellow catfish (Pelteobagrus fulvidraco) and swimming crab (Portunus trituberculatus) [64, 65].
Free amino acids are also important factors of seafood flavor [66]. In the present study, total free EAAs were significantly lower when fish feeding the HSLF diet, while HSMF diet increased the level compared to the CON group, which was consistent with the results of bound amino acids. In addition, the levels of umami amino acids, primarily glutamic acid, as well as sweet amino acids, primarily alanine, lysine, and proline, were significantly decreased when fish fed with the HSLF diet, while the bitter associated amino acids, primarily arginine and histidine were increased [67–69]. After appropriate fat addition, the umami amino acids and sweetish acids returned to normal level. However, there was no such change in bitter amino acids, which indicated that HSMF diet played role in enhancing umami and sweetish taste while also increasing the bitterness of fish muscle. The above results suggested that high starch diets influenced the muscle flavor and nutritional value, and moderate fat supplementation contributed to the formation of healthy fatty acids and amino acids profile.
4.2.4. Antioxidant Capacity
Excessive carbohydrate intake can cause oxidative stress and reduced antioxidant capacity in fish [70, 71]. Fish muscle tissue contains high level of PUFAs, which is one of the reasons that muscle is prone to lipid peroxidation, which cannot only lead to the production of bad odors, but also produce harmful substances that cause protein damage [72]. Oxidative stress can also restrain the synthesis of new collagen mediated by myofibroblasts [73]. Therefore, the decline in antioxidant capacity seriously threatens the flesh quality. In the present study, fish fed with high starch diets also showed significantly lower T-AOC, CAT activity, SOD activity, and expression level of nrf2, which was similar to the results of studies on Siberian sturgeon (Acipenser baerii) and M. amblycephala [74, 75]. HSMF diet increased the T-AOC and SOD activity compared to the HSLF diet. The reason may attribute to inappropriate starch caused abnormal lipid deposition in muscle tissue and enhanced the susceptibility to oxidative stress [76]. Above all, HSLF diets reduced the muscle antioxidant capacity, and moderate fat supplementation could partly alleviate the antioxidant decline.
5. Conclusion
HSLF diet could reduce flesh quality by affecting the muscle texture, downregulating the contents of PUFAs, EAAs, and FAAs, and decreasing antioxidant capacity. Moderate fat supplementation could partly alleviate the negative effects caused by HSLF diet specifically by improving the sensory quality and nutritional value of adult tilapia muscle. Further studies are needed to elucidate the behind mechanism and substances that play key role in the regulation of muscle development and nutrients deposition.
Disclosure
This study was based on the preliminary findings of Xie et al. [34] which explored the growth performance of Nile tilapia fed the same diet as in the present study.
Conflicts of Interest
The authors declare no conflicts of interest.
Funding
This study was supported by the National Key Research and Development Program of China (2023YFD2400600) and the China Agriculture Research System (CARS-46).
Acknowledgments
This study was supported by the National Key Research and Development Program of China (2023YFD2400600) and the China Agriculture Research System (CARS-46).
Supporting Information
Additional supporting information can be found online in the Supporting Information section.
Open Research
Data Availability Statement
The data that support the findings of this study are available on request from the corresponding author. The data are not publicly available due to privacy or ethical restrictions.


