Characteristic Flavor Analysis of Inner Mongolia Air-Dried Meat and the Impact of Vacuum Tumbling Curing on Flavor
Abstract
Air-dried beef is a traditional specialty dried meat product that has a rich history in Inner Mongolia. In-depth understanding of the characteristic flavor substances of air-dried meat in different regions can help branding of traditional air-dried meat products and sustainable development of the air-dried meat industry in Inner Mongolia. This study aims to investigate the characteristic flavors of air-dried beef from various regions of Inner Mongolia (Ordos, Xinlingol, and Chifeng) by using electronic nose and GC-MS combined with ROAV value and explore the impact of the vacuum tumbling curing process on the flavor of air-dried meat. The samples from each region were found to contain characteristic flavor substances such as alcohols, aldehydes, hydrocarbons, and oxygenates. There are five characteristic flavor substances unique to the Ordos region: 3-dodecanol (5.938), 4-methyl-5-decanol (32.686), 2,4-dimethyl-2-pentanol (4.139), methylheptenone (67.445), and 3-ethyl-2,5-dimethylpyrazine (4.256); three characteristic flavor substances unique to the Xilingol region: isovaleraldehyde (68.917), ethyl phenylacetate (3.746), and thymol (2.091); and two characteristic flavor substances unique to the Chifeng region: 2-heptanol (3.984) and 6-methyl-2-heptanone (6.191). Vacuum tumbling curing not only improved the pH (6.35) and L∗ value (33.74) of air-dried meat but also increased the variety of flavor substances characteristic of air-dried meat, including trans-2-decenol (2.989), isopentanol (0.585), trans-2-nonenal (2.937), methyl decyl ketone (4.836), phenylacetic acid (4.262), and benzoic acid (0.554). In conclusion, the addition of vacuum tumbling curing process in the industrial production of air-dried beef products can increase the curing efficiency and improve the flavor of air-dried beef products.
1. Introduction
The continued growth in meat consumption will rely more on population growth and an increased demand for higher quality meat [1]. Beef is popular among consumers due to its high protein and low-fat characteristics [2, 3]. Inner Mongolia air-dried beef is a popular delicacy among the Inner Mongolian people. Air-dried meat exhibits various regional characteristics due to its wide distribution, long history, and diverse varieties.
Flavor is an important indicator of the overall quality of meat products [4, 5]. The difference in flavor largely determines whether the product can meet the diverse and varying demands of people for meat food [6]. There are many factors that affect the flavor of meat products, including the type and freshness of raw materials, the type and number of seasonings added, and changes in the production process. Flavor in meat can be divided into two components: taste and aroma [7]. Taste refers to the sensation experienced on the tongue, while aroma is the result of volatile flavor substances that are released when the meat is cooked [8]. The flavor substances in Inner Mongolia traditional air-dried meat primarily originate from the fat, muscle glycogen, and protein present in fresh beef. These substances undergo various biochemical reactions to develop the distinct taste [9]. The main products of these biochemical reactions are simple compounds, including hydrocarbons, alcohols, aldehydes, ketones, acids, and esters. Additionally, heterocyclic compounds containing O, S, and N atoms, such as furans and pyrazines, are also formed [10]. Flavor formation is influenced by multiple factors, including raw meat quality, environment, and production process [11, 12]. The key role in this process is played by various biochemical reactions, such as protein-lipid degradation, microbial metabolism of carbohydrates and aroma precursors, Strecker degradation, the melodic reaction, and thermothiamine degradation [13, 14]. Microbial sources or endogenous proteases break down proteins into peptides, which are then hydrolyzed to low-molecular-weight peptides and free amino acids by enzymes such as peptidases and aminopeptidases in muscle tissue [15, 16]. This is the main component of the nonprotein nitrogen portion of meat. The flavor formation of air-dried meat is influenced by the production of ketones and aldehydes, which are generated through the secondary metabolism of amino acids derived from protein breakdown [17, 18].
Curing is a crucial step in the production process of air-dried meat. Its main objective is to decrease the water content and water activity in the tissues while also inhibiting the growth of harmful microorganisms. This process is essential to prevent the product from spoiling and deteriorating. Curing can also enhance the flavor and improve the quality of meat products. Various curing techniques will result in varying curing outcomes [19]. The principle of the tumbling method is to use the centrifugal force generated by the rotating roller to allow the salt to continuously penetrate into the muscle tissue from the surface, thereby accelerating the maturing effect of the meat [20]. The method can reduce the loss of moisture, cooking loss, increasing the tenderness of meat, and improving the flavor [21]. Meat in the tumbling process with the help of physical impact reduces the mechanical strength of muscle fibers, destroying the cell structure, which can promote the diffusion of salt, increase protein solubility, and improve the stability of meat. Vacuum conditions not only inhibit microbial growth and fat oxidation but also prevent myoglobin oxidation, which facilitates the coloration of meat products.
Air-dried beef, the production process is simple and easy to operate, is traditional fermented meat product. The steps of preparation are usually trimming the ingredients, curing, and air-drying. To promote the development of the air-dried beef industry in Inner Mongolia, this study aimed to analyze the characteristic flavors of 18 air-dried beef samples from three regions in Inner Mongolia. Additionally, the study aimed to investigate the effect of the vacuum tumbling curing method on the flavors of air-dried beef.
2. Materials and Methods
2.1. Sample Collection
Eighteen air-dried beef samples were collected from pastoral areas in Inner Mongolia, including Ordos, Xilingol, and Chifeng regions. The samples were quick-frozen in liquid nitrogen and transported back to the laboratory. They were then stored at −80°C. The collection period lasted for one month (Table 1). All air-dried meat was handmade by herdsmen, all meat used was from herd-raised cattle, and all samples were centrally collected in December 2022. The raw meat for the vacuum tumbling curing method was purchased from Inner Mongolia Dumeng Food Co., and other supplementary materials were purchased from Hohhot Carrefour Supermarket.
| Number | Areas | Main seasonings |
|---|---|---|
| E1 | Jungar Banner (Ordos, 39°52′N, 111°14′E) | Salt, sugar, soy sauce, pepper, onion, ginger, cooking oil, MSG |
| E2 | OtogFront Banner (Ordos, 38°11′N, 107°29′E) | |
| E3 | Otog Banner (Ordos, 39°05′N, 107°58′E) | |
| E4 | WuShen County (Ordos, 38°35′N, 108°51′E) | |
| E5 | Dalad Banner (Ordos, 40°24′N, 110°02′E) | |
| E6 | WuShen County (Ordos, 38°35′N, 108°51′E) | |
| X1 | Sonid Left Banner (Xilingol, 43°51′N, 113°40′E) | Salt, sugar, soy sauce, pepper, onion, ginger, cooking oil |
| X2 | Lan County (Xilingol, 42°14′N, 115°59′E) | |
| X3 | Sonid Right Banner (Xilingol, 42°44′N, 112°39′E) | |
| X4 | Duolun County (Xilingol, 42°11′N, 116°28′E) | |
| X5 | Sonid Lift Banner (Xilingol, 43°51′N, 113°40′E) | |
| X6 | Taibus Banner (Xilingol, 41°52′N, 115°16′E) | |
| C1 | Keshiketeng Banner (Chifeng, 43°16′N, 117°28′E) | Salt, sugar, pepper, onion, ginger, cooking oil |
| C2 | Bairin Left Banner (Chifeng, 43°57′N, 119°21′E) | |
| C3 | Aohan Banner (Chifeng, 42°17′N, 119°55′E) | |
| C4 | Ongnood Banner (Chifeng, 42°56′N, 119°02′E) | |
| C5 | Ongnood Banner (Chifeng, 42°56′N, 119°02′E) | |
| C6 | Ningcheng County (Chifeng, 41°35′N, 119°21′E) | |
2.2. Determination of Water Content and Water Activity
- (a)
The glass weighing flasks were dried in a desiccator at 105°C for 2 hours, and then, glass weighing flasks removed and weighed after cooling in a desiccator. This process was repeated until the difference between two consecutive weights did not exceed 2 mg (steady weight).
- (b)
Approximately 5.0000 g of the already sheared sample is weighed in a drying weighing flask and dry to a steady weight.
- (c)
Calculation formula is as follows:
(1)where X: water content (g/100 g), m1: mass of weighing bottle and sample (g), m2: mass of weighing bottle and sample after drying (g), m3: mass of weighing bottle (g), and 100: conversion factor.
The water activity of a food is related to the stability of the food. During the production of air-dried meat, the water activity of the meat decreases continuously. Low water activity can inhibit biochemical reactions in the food, thus affecting the flavor formation of air-dried meat. The air-dried beef sample was chopped and laid flat on the bottom of the water activity sample dish and measured by a water activity analyzer.
2.3. Determination of pH, Nitrite Content, and Color Difference
We carefully measure out 5.000 g of finely ground samples and place them in a conical flask. Next, we add 45 mL of saline solution with a concentration of 0.85% to the flask. We use a magnetic stirrer to stir and shake the mixture for a duration of 15 minutes. After the stirring is complete, we measure the pH value of the mixture using a pH meter (Mettler Toledo, Shanghai, China).
Nitrite content is an important indicator for evaluating the safety of meat products. Nitrosamines, which are converted from nitrites, are carcinogenic to humans. However, nitrite plays a role of coloring in meat products and can improve the color of meat products. Measurement of nitrite in samples was performed using Sun′s method [23]. 5 g of chopped sample was taken and boiled in borax solution, and then, potassium ferricyanide solution and zinc acetate solution were added to precipitate the proteins. Aminobenzenesulfonic acid solution and naphthalene ethylenediamine hydrochloride solution were added to the supernatant, and the absorbance at 538 nm was measured after standing for 15 minutes.
Color can be used not only to characterize the freshness of raw meat but also to evaluate the quality of meat products. Better quality air-dried meat has a bright, rose-red color. The brightness (L∗), redness (a∗), and yellowness (b∗) values of air-dried meat were determined using an automatic colorimeter (Konica Minolta CR-410, Osaka, Japan) that was calibrated with a standard white plate.
2.4. Determination of Flavor Substances
2.4.1. Electronic Nose (E-Nose) Measurement
The electronic nose is a device that mimics an animal’s olfactory organs, allowing it to recognize complex odors and obtain results that are consistent with human sensory tasting. E-nose is commonly used in product quality testing, including food, tobacco, fermented foods, and spices. Pulverized samples weighing 5.000 g were placed in a 15 mL special injection bottle for electronic nose (Oykimi Optoelectronics Co. TCP2, Beijing, China). The samples were subsequently immersed in a 60°C water bath for 40 minutes, followed by a resting period of 10 minutes before measurement. The electronic nose measurement conditions included an initial injection flow rate of 300 μL/min, a sampling interval time of 5 s, a cleaning time of 60 s, a detection time of 180 s, and a zero trimming time of 1 s [24]. Sensor performance is described in Table 2.
| Array serial number | Sensor name | Performance description |
|---|---|---|
| 1 | W1C | Aromatic, benzene compounds |
| 2 | W5S | Nitrogen and oxygen compounds |
| 3 | W3C | Aromatics, ammonia compounds |
| 4 | W6S | Hydride |
| 5 | W5C | Short-chained alkane aromatic compounds |
| 6 | W1S | Methyl compounds |
| 7 | W1W | Sulphide compound |
| 8 | W2S | Alcohols, aldehydes, and ketones |
| 9 | W2W | Aromatic, organic sulphide compounds |
| 10 | W3S | Long-chain alkane compounds |
2.4.2. Measurement of Volatile Flavor Substances
Solid phase microextraction (SPME) overcomes the shortcomings of traditional sample pretreatment techniques and accelerates the speed of analysis and detection. Solid phase microextraction in tandem with gas chromatography and mass spectrometry (SPME-GC-MS) can accurately detect volatile substances in food. Volatile flavor compounds in samples were determined by SPME-GC-MS (Thermo Fisher Scientific, Trace 300, USA) [25]. We weigh 5.000 g of crushed sample in a 20 mL headspace vial. Then, the cap be pressed, and the SPME extraction head be inserted into the headspace of the injection vial. The adsorption and extraction process be carried out at a temperature of 60°C for a duration of 40 min. After that, the extraction head inserted into the injection port of the gas chromatography instrument. The analysis conducted at a temperature of 250°C for a duration of 3 min. Each peak in the total ion flow chromatogram was searched qualitatively against mass spectrometry data for known substances in the NIST, WILEY, and MENALIB databases, with identifications based on matches greater than 800, and quantitatively expressed as a relative percent content.
2.4.3. Experimental Design of Vacuum Tumbling Method
In the process of meat tumbling and curing, keeping the vacuum in the tumbling drum can change the gap of muscle fibers, so that the seasoning can enter the meat quickly, thus reducing the marinating time and improving the efficiency of marinating. To study the effect of vacuum tumbling on the flavor of air-dried beef, the following experiment was designed (Table 3). The hind leg’s surface fascia removed before cutting the beef into strips. In the direction of the muscle fibers, the beef is cut into strips, about 15 cm long, 4 cm wide, and 3 cm thickness. The curing process carried out according to the experimental conditions specified in Table 3. The cure is salt (g/kg), sugar (g/kg), and soy sauce (mL/kg).
| Group A | Group B | |
|---|---|---|
| Standing curing | 4°C, 12.0 h | — |
| Vacuum tumbling curing | — | 0.04 MPa, 4.0 h |
| Low temperature drying | 20°C, 18.0 h | 20°C, 18.0 h |
| High temperature drying | 60°C, 1.5 h | 60°C, 1.5 h |
- “—” means there is no such step.
2.4.4. Experimental Design for Sensory Analysis of Air-Dried Meat Produced by Vacuum Tumbling
Sensory analysis tests were designed to better characterize the flavor enhancements achieved through vacuum tumbling. The sensory analysis panel consists of 10 healthy food professionals, who possess good communication skills and some experience in food sensory analysis. The panel includes 5 males and 5 females, ensuring a balanced gender distribution. This composition aims to ensure the reliability and validity of the analysis results. The sensory analysis tests were conducted in a quiet environment free from strong interfering factors. Between consecutive analyses, participants rinsed their mouths with purified water. The sensory analysis evaluation standards are shown in Table 4.
| Attribute | Sensory analysis standards | Score |
|---|---|---|
| Color (25 points) | Brownish or yellowish-brown, with noticeable color | 17–25 |
| Color is not very uniform, poor luster | 7–16 | |
| Dark black, uneven color, no luster | 1–6 | |
| Texture (25 points) | Delicate texture, moderate hardness, good chewiness | 17–25 |
| Somewhat dry and hard, coarse texture | 7–16 | |
| Dry and hard, poor palatability | 1–6 | |
| Flavor (25 points) | Distinct beef flavor, no off-flavors | 17–25 |
| Beef flavor not prominent, moderate saltiness | 7–16 | |
| No beef flavor or presence of off-flavors | 1–6 | |
| Appearance (25 points) | Smooth and even texture, uniform size, no fat, no skin, no tendons | 17–25 |
| Not very smooth, uneven size, some skin, fat, or tendons | 7–16 | |
| Loose and uneven texture, fragmented pieces, surface has skin, fat, tendons | 1–6 | |
2.5. Statistics and Analysis of Data
All results are expressed as mean ± standard deviation. Analysis of variance and significance were analyzed using SPSS 26.0 software. Plotting was done using Origin 2018 software, and principal component analysis was done using SIMCA 14.1 software. Different letters in the graphs indicate significant differences, p < 0.05.
3. Results
3.1. Analysis of Physical and Chemical Indicators
3.1.1. Water Content and Water Activity
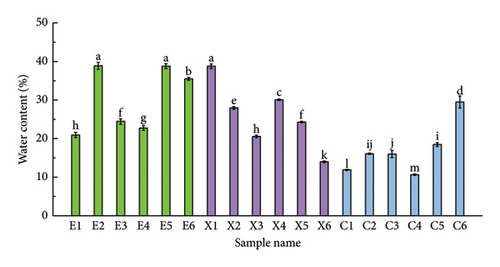
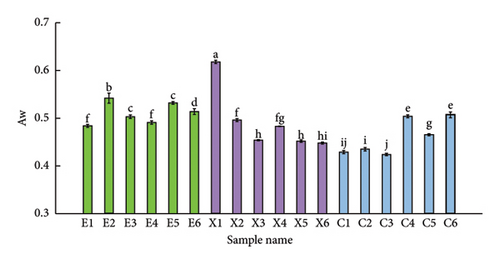
Water content is an important factor affecting the properties of food materials, production processes, storage conditions, and preservations periods [27]. Low water content inhibits the growth of harmful microorganisms and extends shelf life [28]. Water activity (Aw) is considered a significant standard by the International Organization for Standardization (ISO) for inspecting and controlling the quality and safety of food [29]. Meat products with lower Aw values have lower free water content that lead to a harder texture because of decrease water retention in the protein colloid structure. Additionally, lower water activity levels effectively inhibit the growth of harmful microorganisms and the formation of biogenic amines.
The water content and water activity of the samples were measured and compared. As shown in Figures 1(a) and 1(b), sample E2 had the highest water content (38.863%), while sample C4 had the lowest water content (10.640%). Additionally, sample X1 had the highest water activity (0.618), and sample C3 had the lowest water activity (0.424). These findings align with the regulations set by the U.S. Food and Drug Administration for jerky foods, which stated that the water activity should be less than 0.7 (Aw < 0.7). The water content and water activity of the samples collected from the eastern part (Chifeng) of Inner Mongolia were generally lower than those of the samples collected from the central and western parts (Xilingol and Ordos) of Inner Mongolia. The variations in the drying environment, the type of raw meat, and the production cycle of air-dried meat may account for the differences observed in different regions.
3.1.2. pH Value
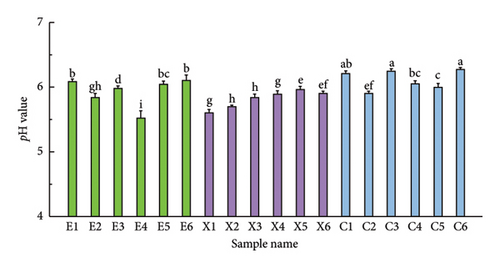
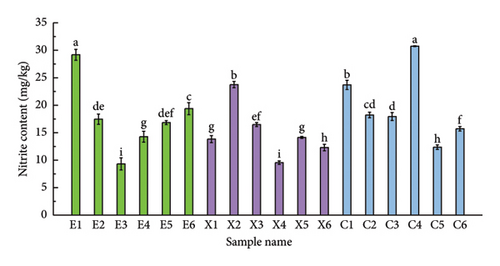
The pH value not only influences the shelf life of food but also has an impact on the formation of flavor substances and the overall quality of air-dried meat products [30]. As shown in Figure 1(c), the pH values of the samples collected from the eastern region of Inner Mongolia were relatively higher compared to those from the central and western regions. Sample C6 had the highest pH value (6.277), while sample E4 had the lowest pH value (5.517). Nitrites are important coloring and bacteriostatic agents in meat products, and its level is related to the quality of meat products [31]. Nitrite not only maintains the rose-red color of meat products but also inhibits the growth of spoilage microorganisms [32]. From Figure 1(d), nitrite levels in air-dried meat samples were significantly higher in the eastern region of Inner Mongolia than in the western region (p < 0.05). This may be the result of inconsistent cure additions when producing air-dried meats in different regions. The microbial activity promotes the breakdown of proteins in the tissues, resulting in the formation of organic acids. Air-dried meat from Chifeng region has high nitrite content and low water activity, which makes it difficult for microorganisms to survive and then produces fewer organic acids, so the pH is higher compared to samples from other regions.
3.1.3. Color
Color serves as the primary sensory factor influencing consumers’ selection of meat products, allowing for a rapid assessment of air-dried meat quality. It is crucial to recognize that minor variations in color within an acceptable range do not affect the nutritional value of the meat [33]. The color difference of the samples from different regions showed a significant variation in this study (p < 0.05). Higher value of a∗ indicates that the color of air-dried meat tends to be rose-red, and higher value of b∗ indicates that the surface color of air-dried meat is darker. In this study (Table 5), compare with Chifeng region samples (a∗-value mean = 11.843), Ordos region samples had lower a∗-value (mean = 10.936). And the samples from the Ordos region showed a higher b∗-value (mean = 13.690) than the samples from the Chifeng region (b∗-value mean = 10.729). Samples from the Xilingol region had higher L∗-value compared to the other two regions. The experimental results indicate that air-dried meat samples from the eastern region of Inner Mongolia exhibit a more pronounced rose-red color, which may potentially enhance their appeal among consumers. These findings are consistent with the experimental results regarding the nitrite content.
| Region | Sample | L∗ | a∗ | b∗ |
|---|---|---|---|---|
| Ordos | E1 | 28.387 ± 0.222n | 8.693 ± 0.075j | 11.120 ± 0.017cde |
| E2 | 43.573 ± 0.476ef | 9.187 ± 0.070i | 19.613 ± 0.064a | |
| E3 | 52.960 ± 0.142c | 16.360 ± 0.365a | 12.457 ± 0.143bcd | |
| E4 | 30.883 ± 0.342l | 12.133 ± 0.021e | 13.823 ± 5.779bc | |
| E5 | 40.853 ± 0.086g | 9.143 ± 0.025i | 10.120 ± 0.098def | |
| E6 | 60.183 ± 0.326b | 10.100 ± 0.040h | 15.057 ± 0.006b | |
| Xilingol | X1 | 44.240 ± 0.934e | 8.560 ± 0.026j | 10.077 ± 0.133def |
| X2 | 33.747 ± 0.163k | 11.340 ± 0.046f | 14.837 ± 0.012b | |
| X3 | 35.423 ± 0.291i | 11.373 ± 0.025f | 18.777 ± 0.025a | |
| X4 | 63.430 ± 0.483a | 14.637 ± 0.015b | 7.720 ± 0.185f | |
| X5 | 37.250 ± 0.017h | 13.380 ± 0.046c | 9.900 ± 0.087def | |
| X6 | 34.743 ± 1.026j | 10.483 ± 0.029g | 11.423 ± 0.370cde | |
| Chifeng | C1 | 29.443 ± 0.687m | 8.750 ± 0.118j | 12.967 ± 0.029bc |
| C2 | 43.797 ± 0.336ef | 12.220 ± 0.062e | 11.363 ± 0.268cde | |
| C3 | 36.197 ± 0.045i | 11.230 ± 0.046f | 7.483 ± 0.035f | |
| C4 | 30.510 ± 0.703l | 9.967 ± 0.040h | 14.340 ± 0.013b | |
| C5 | 43.070 ± 0.220f | 16.207 ± 0.029a | 9.490 ± 0.275ef | |
| C6 | 46.087 ± 0.222d | 12.683 ± 0.112d | 8.730 ± 0.171ef | |
- Different letters represent significant difference (p < 0.05), and the same below. We repeat the test three times for each sample and take the average value.
3.2. Analysis of Flavor Substances of Traditional Air-Dried Beef in Inner Mongolia
3.2.1. Analysis of Odor Differences of Traditional Air-Dried Meat in Inner Mongolia
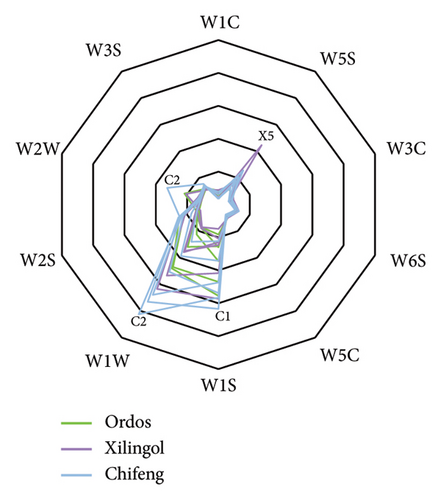
The odors were detected using an electronic nose, and subsequently, a radar chart was generated based on the intensity of the odors. Principal component analysis (PCA) was performed. As depicted in Figure 2(a), the intensity of sensor response of air-dried meat samples to the electronic nose varied significantly. Specifically, the intensity of odor response of sensors W2W, W2S, W1W, W1S, and W5S differed significantly among different samples (p < 0.05). Conversely, the intensities of the samples to sensors W1C, W3C, W3S, and W6S overlapped, indicating similarity in aromatic fractions among these samples with no significant difference (p > 0.05). Furthermore, the response intensity of C2 to sensors W1W and W2W was notably higher than that of other samples, suggesting that C2 samples may contain a higher concentration of aromatic compounds and sulfides (p < 0.05). Similarly, the response intensity of X5 to sensor W5S was significantly higher than that of other samples, indicating a potentially higher concentration of nitrogenous and oxygenated compounds in X5 (p < 0.05). These findings preliminarily suggest that air-dried meat in Chifeng is richer in aroma compared to the other two regions, which may be attributed to local dietary habits. Additionally, the elevated response of the sensor to nitrogenous and oxygenated compounds in X5 may be attributed to the breakdown of proteins and lipids in the meat due to the extended air-drying time of X5.
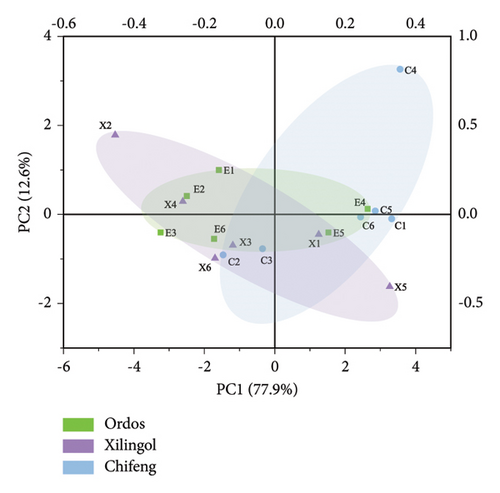
Principal component analysis (PCA) was conducted using the results of e-nose measurements. PC1 and PC2 contributed 77.9% and 12.6%, respectively, yielding a total contribution of over 85%. This indicates that these two principal components can effectively explain most of the samples. As depicted in Figure 2(b), sample points are distributed across each of the three regions and partially overlap, suggesting discernible differences in the odor profiles of air-dried meat among the three regions of Inner Mongolia (p < 0.05).
3.2.2. Analysis of Characteristic Flavor of Traditional Air-Dried Beef in Inner Mongolia
The volatile flavor substances identified in each sample were predominantly alcohols, aldehydes, and hydrocarbons, collectively constituting an average of 76.49% of the overall flavor of each sample, as depicted in Figure 3(a). In total, 111 volatile flavor substances were detected across the 18 air-dried meat samples. These included 29 alcohols, 16 aldehydes, 24 hydrocarbons, 9 ketones, 6 acids, 9 esters, 3 phenols, and 4 ethers. Notably, the types and relative contents of volatile flavor components that contributed more to different air-dried meats exhibited significant differences (p < 0.05). These experimental findings suggest that alcohols, aldehydes, and hydrocarbons may serve as the primary contributors to the characteristic flavor profiles of air-dried beef in various regions. The results of relative quantification of volatile flavor substances in Inner Mongolia air-dried beef are presented in the Supplementary file (Supplementary Table 1).
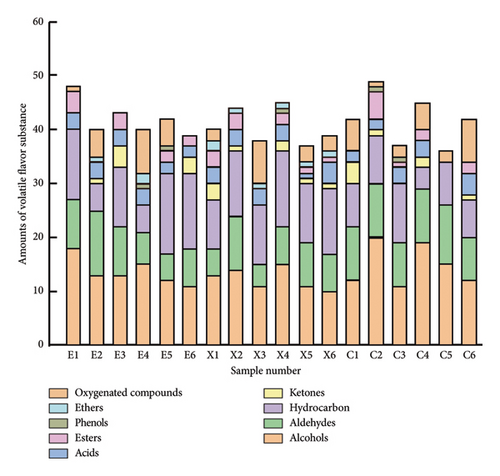
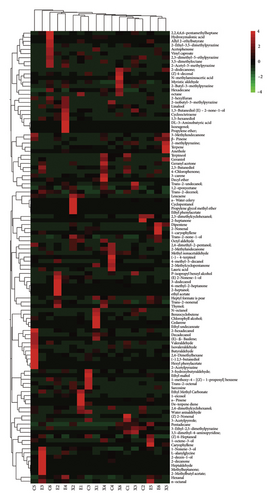
Alcohols primarily arise from fat oxidation, with unsaturated alcohols making a more significant flavor contribution compared to saturated alcohols [34]. In the 18 samples, 29 alcohols were detected (Figures 3(a) and 3(b)). Notably, linalool, known for its jasmine flavor, 4-terpineol, characterized by a peppery aroma, and pinacol, imparting a clove aroma, were more frequently detected in air-dried meat samples from the Xilingol and Chifeng regions [35]. Additionally, bitter-sweet and spicy aroma alcohols such as 1,3-butanediol and p-isopropylbenzyl were identified in samples from the Chifeng area. All these alcohols contribute to the characteristic flavor of air-dried beef. Aldehydes are considered essential aroma components of meat, typically originating from the oxidation of unsaturated fatty acids or the degradation of sugars [36]. Notably, both heptenal and heptanal, belonging to aldehydes, impart Ordos air-dried meat with a distinctive creamy and fruity flavor [37, 38].
Hydrocarbons primarily originate from the rupture of fatty acid alkoxide radicals. Unsaturated hydrocarbons, including olefins and terpenes, contribute to the rich flavor profile of air-dried meats. Moreover, the composition of unsaturated hydrocarbons can serve as a distinguishing factor for air-dried meats from various regions [39]. In general, terpenoids with lower odor presentation thresholds tend to exhibit more intense odor expression, making them significant contributors to the overall flavor profile of the meat [40]. In this experiment, significant differences were observed in the profiles of unsaturated hydrocarbons, including 9 alkanes and 14 olefins, among the air-dried meat samples from different regions (p < 0.05). These differences are likely attributed to variations in the curing methods employed during the preparation of air-dried meat. The addition of seasonings during the curing process emerges as one of the most influential factors impacting the flavor of air-dried meat. Moreover, a higher abundance of esters derived from the breakdown of short-chain fatty acids was detected in the air-dried meat from the Chifeng region. This finding further suggests that air-dried meat from this region exhibits a richer flavor profile. [26, 41, 42].
3.2.3. Multivariate Statistical Analysis Based on ROAV Value Characteristic Flavor Substances
The formation of characteristic flavors in foods by volatile flavor substances is influenced not only by their relative abundance but also by their odor threshold. Therefore, in this study, the ROAV method was employed to identify and analyze characteristic volatile compounds in traditional Inner Mongolian air-dried meat [26]. A total of 32 aroma components, indicative of the key flavors of air-dried meat (ROAV > 1), were calculated and screened out. These included 7 alcohols, 8 aldehydes, 8 ketones, esters, and phenols, and 5 oxygenated compounds.
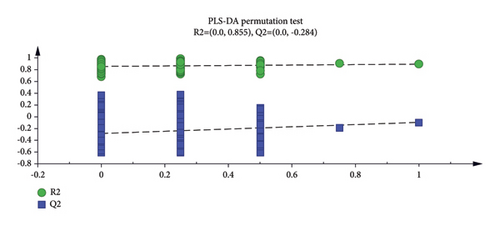
PLS-DA cluster analysis of 18 samples based on ROAV values was conducted. Figure 4(a) illustrates that the 18 sample sites are predominantly distributed across distinct regions according to their regional attributes. The results of the 200-permutation test for this model, depicted in Figure 4(b), affirm the reliability of the PLS-DA clustering outcomes. Notably, among the top 15 important flavor substances identified in the variable importance for the projections, 11 flavor substances (ROAV > 1 or 0 < ROAV ≤ 1) significantly contributed to the establishment of the PLS-DA model. These key flavor substances include 3-dodecanol, (Z)-4-decenal, trans-2-octenal, acacia alkene, hexanal, isovaleraldehyde, geranylace, 2,3-butanediol, β-pinene, (Z)-2-nonenal, and 4-methyl-5-decanol (Figure 4(c)).

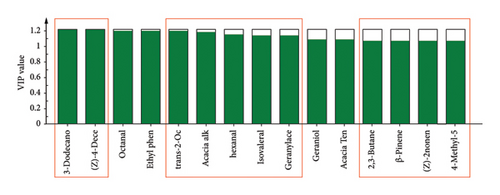
Additionally, as delineated in Table 6, specific characteristic flavor substances were identified in samples from distinct regions. For instance, 3-Dodecanol, 4-methyl-5-decanol, 2,4-Dimethyl-2-pentanol, Methylheptenone, and 3-Ethyl-2,5-dimethylpyrazine were identified as characteristic flavor substances in samples from the Ordos region. Conversely, 2,3-butanediol, isovaleraldehyde, ethyl phenylacetate, and thymol were characteristic flavor substances in samples from the Xilingol region. Notably, the Chifeng region exhibited two unique characteristic flavor substances: 2-heptanol and 6-methyl-2-heptanone. These findings are consistent with the variable importance for the projections analysis.
| Flavor matter | Ordos | Xilingol | Chifeng |
|---|---|---|---|
| 1,3-Butanediol | 2.211 ± 0.000b | — | 9.696 ± 8.002a |
| 3-Dodecanol | 5.938 ± 2.975 | — | — |
| 4-Methyl-5-decanol | 32.686 ± 0.000 | — | — |
| 2,4-Dimethyl-2-pentanol | 4.139 ± 2.766 | — | — |
| 2,3-Butanediol | — | 1.128 ± 2.402 | — |
| (E)-2-nonen-1-ol | 6.902 ± 0.144b | 16.836 ± 17.230a | 1.367 ± 1.852c |
| (Z)-2-nonenal | 57.845 ± 10.622a | 4.715 ± 2.182c | 14.166 ± 12.272b |
| n-Octanol | 6.329 ± 0.000c | 26.106 ± 17.243b | 100.000 ± 0.000a |
| 2-Heptanol | — | — | 3.984 ± 4.111 |
| (Z)-2-nonenal | 21.939 ± 0.256a | 6.249 ± 13.343b | — |
| (Z)-4-heptenal | 1.655 ± 42.155b | 2.848 ± 4.843a | — |
| (Z)-4-decenal | 28.611 ± 0.000b | 56.928 ± 44.760a | 16.348 ± 12.659b |
| Trans-2-octenal | 1.012 ± 1.069c | 28.837 ± 2.471a | 8.727 ± 2.377b |
| Hexanal | 1.438 ± 5.805b | 2.583 ± 5.156a | — |
| Myristyl | 4.012 ± 1.035b | 19.339 ± 7.875a | — |
| Pentanal | — | 100.000 ± 0.000a | 26.457 ± 13.780b |
| Isovaleraldehyde | — | 68.917 ± 0.000 | — |
| (E)-beta-hemocyanin | — | 12.550 ± 19.832b | 32.849 ± 26.581a |
| α-Hydrocotyleine | 2.804 ± 15.526c | 8.305 ± 0.000b | 30.397 ± 24.755a |
| β-Pinene | 36.816 ± 0.000b | 49.352 ± 39.885a | — |
| Acacia alkene | 1.637 ± 6.141c | 10.022 ± 0.000b | 34.826 ± 25.388a |
| 2-Decanone | 22.219 ± 0.000b | 28.376 ± 13.313a | 21.537 ± 19.451b |
| 6-Methyl-2-heptanone | — | — | 6.191 ± 6.329 |
| Ethyl phenyl ketone | 1.187 ± 0.000c | 10.134 ± 10.841a | 2.163 ± 5.144b |
| Methylheptenone | 67.445 ± 4.639 | — | — |
| Ethyl phenylacetate | — | 3.746 ± 2.279 | — |
| Thymol | — | 2.091 ± 0.000 | — |
| Isoeugenol | 1.134 ± 4.563b | — | 18.117 ± 18.480a |
| 3-Ethyl-2,5-dimethylpyrazine | 4.256 ± 0.000 | — | — |
- “—” means not detected or not calculated, the same blew. a,b,cSignificance between the two values labeled with different letters.
In summary, the characteristic flavor substances of air-dried beef across various regions of Inner Mongolia exhibit significant geographic variations. These differences may stem from the diverse techniques employed by inhabitants in different regions for air-dried beef production, as well as variations in temperature and humidity within the production environments.
3.3. Effect of Vacuum Tumbling on Flavor Substances and Quality of Air-Dried Beef
3.3.1. Analysis of Physical and Chemical Indicators
The vacuum tumbling curing method has been demonstrated to enhance curing efficiency. In this experiment, Group A, subjected to static curing, and Group B, subjected to vacuum tumbling curing, were compared to assess the impact of different curing methods on the characteristic flavors of air-dried meat.
As depicted in Table 7, there was no significant difference in water activity between the two groups (p > 0.05). However, the water content was higher in Group B (p < 0.05). The higher pH observed in Group B (6.350) compared to Group A (5.970) can be attributed to two potential factors. Firstly, during the vacuum tumbling curing process, endogenous enzyme activity in raw meat leads to the decomposition of beef protein into numerous alkaline nitrogen-containing substances. Secondly, the vacuum tumbling process accelerates mass transfer between the curing solution and the meat, facilitating greater penetration of the cure, which typically contains alkaline phosphates. These substances contribute to the elevation of pH in air-dried meat.
| Physicochemical indicators | Resting curing (group A) | Vacuum tumbling curing (group B) |
|---|---|---|
| Water content | 29.185 ± 0.022b | 33.684 ± 0.125a |
| Water activity | 0.454 ± 0.011a | 0.476 ± 0.026a |
| pH | 5.970 ± 0.009b | 6.350 ± 0.020a |
| L∗ | 31.420 ± 0.089b | 33.740 ± 0.690a |
| a∗ | 11.030 ± 0.170a | 10.28 ± 0.353b |
| b∗ | 8.816 ± 0.310a | 6.153 ± 0.678b |
- Repeat the test three times for each sample and take the average value. a,bSignificance between the two values labeled with different letters (p < 0.05).
The brightness values (L∗) for the static curing group and vacuum tumbling group were 11.030 and 10.280, respectively, exhibiting significant differences (p < 0.05). This divergence can be attributed, in part, to the degradation of myofibrillar proteins during tumbling, leading to the formation of a viscous matrix. Consequently, a substantial amount of water permeates the muscle cells, altering the reflective properties of the meat and resulting in an increase in brightness. [43]. Furthermore, the oxidation of myoglobin to produce oxygenated myoglobin contributes to an increase in muscle brightness. The redness values (a∗) were 11.030 and 10.280, while the yellowness values (b∗) were 8.816 and 6.153 for the resting group and vacuum tumbling groups, respectively, with significant differences (p < 0.05). Both groups exhibited improved color with a rose-red bias. The vacuum tumbling curing process favored an increase in the L∗ value and a decrease in the a∗ and b∗ values of air-dried meat. This phenomenon can be analyzed for the following reasons. Firstly, the vacuum tumbling treatment accelerates the curing process, diluting myoglobin, and other coloring proteins within the meat, resulting in a decline in the a∗ and b∗ values of the air-dried meat. Concurrently, the extracted salt-soluble proteins produce adhesive substances on the meat surface, effectively enhancing light emission and thereby increasing the L∗ value. Secondly, as the air-dried meat becomes increasingly salty, the myoglobin within the muscle cells undergoes oxidation to form high iron myoglobin, thereby brightening the meat. [44].
3.3.2. Effect of Vacuum Tumbling on the Flavor of Air-Dried Meat
As depicted in Table 8 and Figure 5, a total of 52 flavor compounds were identified in the air-dried meat from both groups, comprising 17 alcohols, 11 aldehydes, 10 hydrocarbons, 2 ketones, 4 esters, 1 oxygenated compound, and other compounds. In the resting group, 43 flavor substances were detected, resembling the flavor compositions of traditional Inner Mongolian air-dried meat. In contrast, the vacuum tumbling group exhibited 47 flavor substances. Notably, compared to the stationary marinated group, the vacuum tumbling marinated group demonstrated an increase in the number of alcohols, ketones, and esters, alongside a decrease in phenolics (Figure 5).
| Thresholds (ug/kg) | Resting curing (group A) | ROAV | Vacuum tumbling curing (group B) | ROAV | |
|---|---|---|---|---|---|
| (-)-4-Terpineol | 3400 | 1.152 ± 0.19a | <0.01 | 0.366 ± 0.00b | <0.01 |
| Linalool | 6 | 2.563 ± 0.09a | 0.147 | 2.261 ± 0.05b | 0.161 |
| (-)2,3-Butanediol | 0.09 | 1.091 ± 0.00b | 0.173 | 1.294 ± 0.03a | 6.139 |
| Xylenol | — | 5.271 ± 0.07a | — | 1.631 ± 0.13b | — |
| Chlorophyllin | — | 1.751 ± 0.00a | — | 0.256 ± 0.02b | — |
| 3-Dodecenol | 0.041 | 5.503 ± 0.40a | 46.196 | 4.127 ± 0.07b | 42.970 |
| Trans-2-decenol | — | — | — | 2.989 ± 0.51 | — |
| 4-Methyl-5-decanol | 0.01 | 2.356 ± 0.14b | 81.096 | 3.717 ± 0.13a | 58.646 |
| 1-Nonen-3-ol | — | 0.760 ± 0.29a | — | 0.266 ± 0.05b | — |
| Dimethylpentanol | 2.4 | 0.767 ± 0.56b | 0.110 | 1.199 ± 0.03a | 0.213 |
| 2,3-Dimethylcyclohexanol | — | 5.424 ± 0.15a | — | 2.287 ± 0.04b | — |
| 1,3-Butanediol | 10 | 1.258 ± 0.16b | 0.043 | 1.616 ± 0.03a | 0.069 |
| (E)-2-nonen-1-ol | 0.13 | 0.238 ± 0.01b | 0.630 | 5.482 ± 0.05a | 17.999 |
| n-Octanol | 0.042 | 3.251 ± 0.06a | 26.640 | 0.406 ± 0.09b | 4.130 |
| 1,5-Hexanediol | 0.97 | 2.518 ± 0.09a | 0.894 | 0.267 ± 0.11b | 0.118 |
| 2-Heptanol | 0.041 | 3.224 ± 0.16a | 27.063 | 1.688 ± 0.05b | 17.577 |
| Isopentanol | — | — | — | 0.585 ± 0.09 | — |
| (Z)-2-nonenal | 0.005 | 0.977 ± 0.12b | 67.296 | 1.646 ± 0.02a | 4.565 |
| (Z)-4-heptenal | 0.087 | 0.959 ± 0.14b | 0.796 | 4.743 ± 0.06a | 23.273 |
| (Z)-4-decenal | 0.004 | 1.306 ± 0.01a | 12.450 | 0.854 ± 0.09b | 91.190 |
| Trans-2-octenal | 0.08 | 1.173 ± 0.17 | 5.050 | — | — |
| Trans-2-nonenal | — | — | — | 2.937 ± 0.23 | — |
| Hexanal | 1 | 0.686 ± 0.05a | 0.236 | 0.585 ± 0.11a | 0.250 |
| Myristyl | 0.053 | 4.043 ± 0.13b | 26.258 | 8.317 ± 0.18a | 66.984 |
| Anisaldehyde | — | 6.270 ± 0.05a | — | 1.104 ± 0.11b | — |
| Pentanal | 0.0027 | 0.784 ± 0.15a | 100.000 | 0.632 ± 0.11a | 100.007 |
| Octanal | — | 1.823 ± 0.12b | — | 2.422 ± 0.12a | — |
| 3-Hydroxybutyraldehyde | — | 0.761 ± 0.14 | — | — | — |
| 1-Caryophyllene | 64 | 0.595 ± 0.00b | 0.003 | 2.082 ± 0.31a | 0.014 |
| 2,4-Dimethylhexane | — | 1.215 ± 0.11b | — | 1.618 ± 0.07a | — |
| 2-Methylundecane | 10 | 0.335 ± 1.22b | 0.012 | 12.11 ± 0.45a | 0.517 |
| 3-Methylundecane | — | 10.31 ± 0.56 | — | — | — |
| β-Pinene | 0.006 | 2.266 ± 1.02a | 30.010 | 0.975 ± 0.09b | 69.366 |
| Cyclooctatetraene | — | 1.463 ± 0.05a | — | 1.100 ± 0.33a | — |
| Hexadecane | 13000 | 1.019 ± 0.26b | <0.01 | 1.564 ± 0.21a | <0.01 |
| Terpinene | 200 | 0.256 ± 0.18 | <0.01 | — | <0.01 |
| Tetradecyl ethylene oxide | — | 1.028 ± 0.11 | — | — | — |
| 2,3-Epoxybutane | — | 0.256 ± 0.02 | — | — | — |
| 6-Methyl-2-heptanone | 0.0081 | 2.068 ± 0.45b | 87.878 | 4.249 ± 0.00a | 23.916 |
| Methyl decyl ketone | — | — | — | 4.836 ± 0.07 | — |
| L-Alanylglycine | — | 5.328 ± 0.43a | — | 1.285 ± 0.10b | — |
| Butyric acid | 0.2 | 3.284 ± 0.08a | 5.652 | 0.769 ± 0.12b | 1.643 |
| 3-Aminobutyric acid | — | 3.364 ± 0.13 | — | — | — |
| Hexanoic acid | — | 1.281 ± 0.12 | — | — | — |
| Phenylacetic acid | — | — | — | 4.262 ± 0.00 | — |
| Benzoic acid | — | — | — | 0.554 ± 0.06 | — |
| Heptyl formate | — | 3.098 ± 0.05a | — | 2.185 ± 0.06b | — |
| Methyl ethyl carbonate | — | 3.850 ± 0.15a | — | 2.259 ± 0.10b | — |
| Ethyl acetate | 0.005 | 1.175 ± 0.59b | 8.896 | 1.543 ± 0.25a | 11.714 |
| Ethyl caprylate | — | 1.141 ± 0.30a | — | 0.255 ± 0.89b | — |
| Thymol; 2-isobutyl-3-methylpyrazine | 0.05 | 1.658 ± 0.00a | 11.415 | 1.627 ± 0.24a | 13.891 |
| 2-Isobutyl-3-methylpyrazine | 0.035 | 1.128 ± 0.14a | 11.101 | 1.070 ± 0.12a | 13.049 |
- a,bSignificance between the two values labeled with different letters (p < 0.05).
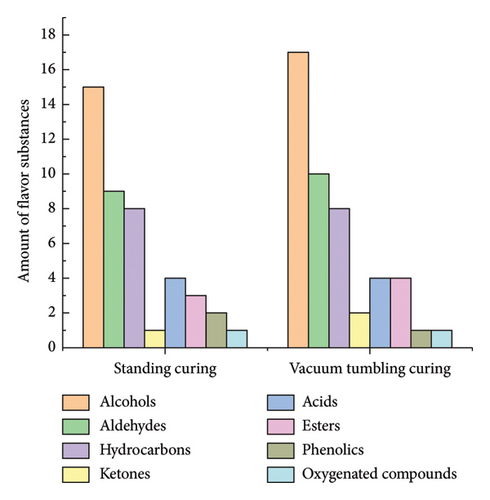
Six novel flavor compounds were identified in the vacuum tumbling group: trans-2-decenol, isopentanol, trans-2-nonenal, methyl decyl ketone, phenylacetic acid, and benzoic acid. These compounds hold particular significance in flavor formation. In the flavor development process of air-dried beef, esters play a pivotal role, imparting a fruity and rose-like aroma to the meat. Esters are formed through the interaction of organic acids and alcohols [45, 46]. During vacuum tumbling curing, valine and leucine undergo biochemical reactions to produce isopentanol, which can undergo esterification with phenylacetic acid. This compound, commonly associated with dairy products, contributes to the unique fruity flavor in air-dried meat [47, 48]. Additionally, natural benzoic acids are synthesized in air-dried meats processed via vacuum tumbling curing. These benzoic acids not only participate in flavor formation through esterification reactions but also exhibit preservative properties, reducing susceptibility to harmful bacterial activity during storage, thereby maintaining flavor integrity [49]. Trans-2-nonenal not only imparts a woody aroma but also catalyzes the oxidation of myoglobin and lipids in the presence of alcohols, further contributing to the formation of flavor compounds [50, 51].
The majority of these newly identified flavor compounds are linked with esters and unsaturated hydrocarbons. Traditional air-dried beef flavor analysis corroborates the significant contribution of unsaturated hydrocarbons to flavor development. Furthermore, flavor compounds generated during curing also influence the microflora structure throughout the subsequent air-drying process, consequently impacting the flavor profile of the final air-dried meat product. [52]. Overall, vacuum tumbling curing enhanced the color and positively influenced the flavor formation of air-dried meat, resulting in a richer flavor profile.
3.3.3. Sensory Analysis Results of Air-Dried Meat Produced by Vacuum Tumbling Curing
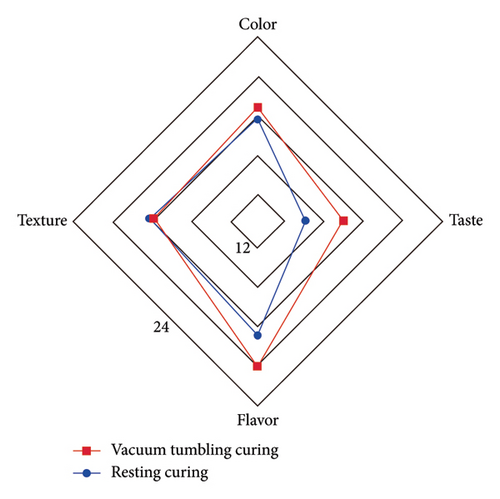
Previous research results showed that vacuum tumbling curing can increase the variety of volatile flavor compounds in air-dried meat, enhancing its flavor. This improvement was confirmed through sensory analysis tests. As shown in Figure 6, there is no significant difference in color and texture between the air-dried meat of the vacuum tumbling curing group and the resting curing group. However, significant differences were observed in flavor and taste (p < 0.05). The sensory flavor scores of the vacuum tumbling curing group were significantly higher than those of the resting curing group. This could also be the fundamental reason for the improved taste in the vacuum tumbling curing group.
4. Conclusion
Geographical variations affect the flavor profile of Inner Mongolia air-dried beef. Vacuum tumbling curing enriches the variety of flavor compounds, including trans-2-decenol, isopentanol, trans-2-nonenal, methyl decyl ketone, phenylacetic acid, and benzoic acid.
The flavor of Inner Mongolia air-dried beef is influenced by various factors. Thus, it is essential to classify air-dried meat based on its regional flavor characteristics. Establishing relevant classification and production standards is crucial for industrializing and standardizing air-dried beef production, thereby cultivating a unique brand identity for air-dried beef products. In the future, integrating the vacuum tumbling curing process into industrial production for air-dried beef with Inner Mongolia brand characteristics should be considered. This approach can expedite curing, enhance efficiency, lower production costs, and enrich the flavor profile of air-dried beef.
To accurately identify regional flavor differences in dried meat, future research should aim to collect a larger number of samples from a wider range of regions. Additionally, nonvolatile flavor substances should not be overlooked. Subsequent experiments should determine nonvolatile flavor substances alongside volatile ones, providing data support for the establishment of relevant production standards.
Conflicts of Interest
The authors declare that they have no known conflicts of interest or personal relationships that could have appeared to influence the work reported in this paper.
Authors’ Contributions
Shiqi Hao investigated the study and wrote the manuscript. Jialu Du involved in experimental design and performed experiments. Xueyin Sun and Guanhua Hu performed experiments. Erke Sun guided the experiment. Xiaotong Li curated the data. Ye jin reviewed and edited the study. Lihua Zhao involved in final approval of the version to be published, funding acquisition, and sample collection. Hao Shiqi and Du Jialu contributed equally to this work.
Acknowledgments
This work was supported by the Research on Flavor Formation Mechanism and Industrialization Key Technology of Traditional Air-dried Meat Products in Erdos (NM-KJCXYD-014), Mechanism of Biogenic Amines-Degrading Ability of Pediococcus Pentosaceus 37X-9 Based on LuxS/AI-2 Quorum Sensing System (2023MS03010), Ministry of Agriculture and Rural Affairs Fresh Beef and Lamb Meat Processing Technology Integration Research Base Capacity Building Project (BR221028), and Research and Demonstration of Targeted Hazardous Substances Control Technology for Steppe Beef and Mutton and Meat Products Processing (2023YFSH0058). The authors gratefully acknowledge Prof. Jin Ye, Fellow of Inner Mongolia Agricultural University, for providing experimental guidance and platforms.
Open Research
Data Availability
The datasets were collected from Kaggle, available at this link: https://www.kaggle.com/datasets/abhranta/brain-tumor-detection-mri.


