Difference Analysis of White, Red, and Grey Sufu: Crosstalk between Metabolomics, Proteomics, and Microbiomics
Abstract
The present study aimed to systematically analyse the differences in metabolites, proteins, and the microbiota among white sufu (WS), red sufu (RS), and grey sufu (GS) by integrating multi-omics detection techniques. First, the various metabolites in sufu were identified through widely targeted metabolomics. Then, differential proteins in sufu were screened, and the principal functions of differential proteins were further mined using proteomic techniques. Finally, the microbiota in the sufu were analysed via 16S rRNA sequencing technology to observe differences in the microbial composition. The results showed that approximately 306 metabolites were present in the three kinds of sufu. Among them, there are 448 differential metabolites in RS and WS, 412 differential metabolites in WS and GS, and 517 differential metabolites in RS and GS. A total of 4663 proteins were identified. Among them, 448 differential proteins were found in RS and WS, 412 differential proteins were identified in WS and GS, and 517 differential proteins were detected in RS and GS. Approximately 77 types of microbes were distributed among three kinds of sufu. The population of WS is mainly distributed with 55.3% of protobacteria and 42.5% of Firmicutes. Proteobacteria and Firmicutes were the dominant microbial phyla common to the three kinds of sufu: the dominant bacteria in WS, RS, and GS were Enterobacter, Pantoea, and Kluyveromyces. The integrative crosstalk of multi-omics analysis illustrated that the metabolites, proteins, and microorganisms in sufu are closely interrelated and together produce unique amino acids in different kinds of sufu.
1. Introduction
Sufu, a traditional Chinese folk food, has the reputation of an “Oriental cheese [1].” The production process of sufu was documented as early as the Wei Dynasty (220-265 AD). Sufu had a protein content of 15% to 20%, which was equivalent to the amount of protein in meat [2]. Previous statistics showed that annual production of sufu can reach 300,000 tons, and it occupied an important position in the Chinese condiment and traditional fermented bean product industry [2]. It is necessary to study sufu to improve people’s understanding of it.
According to differences in colour, taste, and processing methods, the sufu in the market is broadly divided into red, white, and grey sufu. The nutritional value of the three kinds of sufu was significantly different. Previous research mainly focused on the classification and processing of three kinds of sufu. Recent research showed that there were differences in the composition of proteins, metabolites, and microorganisms among them. With the development of modern technology, the discovery and analysis of the differences and intrinsic associations of the main substances and nutrients among RS, WS, and GS could be achieved with the aid of metabolomics, proteomics, and 16S rRNA sequencing [3, 4]. However, current studies on this aspect have not been reported.
In a word, our study aimed to determine and analyse red, white, and grey sufu using metabolomics, proteomics, and 16S rRNA technologies to discover the differences in metabolites, proteins, and the microbiota and excavate the intrinsic links. Ultimately, the preliminary differentiation of RS, WS, and GS proteins, metabolites, the main microbiota, and nutritional value will be achieved and will provide a reference and suggestions for the further development, effective utilization, and selection of different sufu types.
2. Materials and Methods
2.1. Experimental Materials
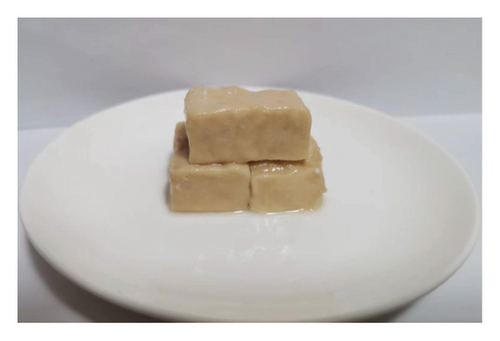
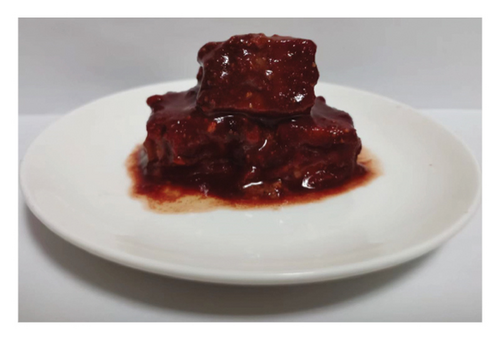
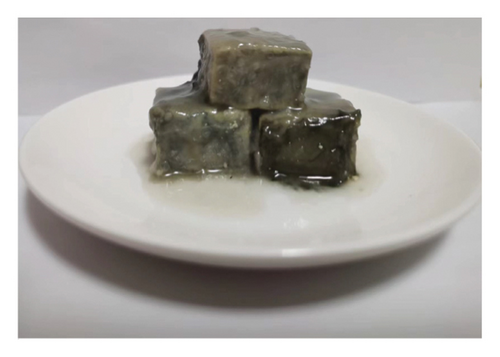
Nine sufu samples, of the same brand, from one production region of China (Beijing), were purchased at local markets in Beijing: white sufu (WS, Batch number: 123205 4SAG), 3 samples; red sufu (RS, Batch number: 1009045APT), 3 samples; and grey sufu (GS, Batch number: 15022996AY), 3 samples (Figure 1). The samples were immediately stored in a 4°C refrigerator in the laboratory of the First Affiliated Hospital of Zhengzhou University after purchase.
Acetonitrile, methanol, and formic acid were obtained from Millipore (Michigan, American); ammonia was purchased from Merck (Darmstadt, Germany); trypsin was obtained from Promega (Beijing, China); ExpressPlusTM PAGE Gel was purchased from GenScript (Nanjing, China); and SDS and trifluoroacetic acid were obtained from Sigma (Shanghai, China).
2.2. Metabolomics
2.2.1. Sample Preparation
Samples of each sufu weighing 120 mg were accurately weighed, and 200 μL precooled water and 800 μL methanol/acetonitrile (2 : 2, v/v) solution were added. After the sufu samples were crushed in a ball mill, they were transferred to an ice water bath for 60 min of ultrasonic treatment, incubated at −20°C for 60 min, and then centrifuged at 4°C for 30 min at 16,000 g (Centrifuge 5424R, Eppendorf, Hamburg, Germany) [5]. The supernatant was aspirated, and the sample was vacuum dried. After drying, the sample was redissolved in 800 μL of an aqueous acetonitrile solution (1 : 1, v/v). The sample was centrifuged at 16,000 g at 4°C for 20 min, and the supernatant was aspirated for LC-MS analysis.
At the same time, QC samples were prepared for monitoring and evaluating the stability of the system and the reliability of the experimental data. QC samples contained all the information contained in sufu samples, and 20 μL for each sample was used for mixing.
2.2.2. Chromatographic and Mass Spectrometric Conditions
The metabonomic analysis of sufu samples utilized the Shimadzu Nexera X2 LC-30AD system (Nexera X2 LC-30AD, Shimadzu, Kyoto, Japan), which was equipped with an Acquisition UPLC HSS T3 column (1.8 μM 2.1 × 50 mm, Waters, Milford, USA) and a triple quadrupole mass spectrometer (5500 QTRAP, AB SCIEX, Framingham, Massachusetts, USA). The mobile phase was A: 0.1% formic acid water, and B: acetonitrile. The gradient elution column elution program was 0–2.5 min, 0% B; 2.5–9 min, 0%–30% B; 9−10 min, 30%–100% B; 10–15.4 min, 100% B; 15.4–15.5 min, 100%−0% B; 15.5–18 min, 0% B. Full scan data were obtained in positive and negative spray ionization (ESI) dual modes with a mass range of m/z 100–1500. The capillary voltage was set to 5.5 kV (positive) and 4.5 kV (negative), respectively. The capillary temperature in both positive and negative ion modes was 550°C. Transition was detected through the MRM mode.
2.2.3. Data Analysis
The composite ion peaks with missing values exceeding 50% were removed from the original data. The chromatographic peak area and retention time were extracted with Multi Quant software. Compounds were identified through mixing standards, retention time, Q1/Q3 ion pairs, secondary mass spectrometry, and other related conditions. Only compounds with RSD less than 30% were retained in QC samples.
2.2.4. Pathway Enrichment Analysis
These differential compounds were introduced into the Kyoto Encyclopedia of Genes and Genomes (KEGG).
2.3. Proteomics
2.3.1. Sample Preparation
One gram of sufu of different types was weighted for liquid nitrogen grinding. The ground sample was transferred to a container containing 1000 μL SDT cracking solution (1 : 10, m/v) centrifuge tube, incubated in a 95°C water bath for 3 min, and ultrasonicated in the same centrifuge tube at 4°C for 2 min. Next, the ultrasonic samples were centrifuged at 4°C and 16,000 g for 20 min. Then, 15 µg of supernatant was aspirated from each group of samples and mixed with buffer in a 5 : 1 volume ratio. The samples were transferred to a boiling water bath and incubated for 15 min. After the boiling water bath was completed, different samples were subjected to SDS-PAGE electrophoresis and staining. The protein concentration in another aliquot of the protein sample from each sufu was determined using the BCA kit method.
2.3.2. Enzymatic Hydrolysis and Protein Quantification of Samples
Each sufu was weighed to 300 µg by enzymatic digestion through a 10-kd ultrafiltration centrifuge tube. Each sample was subjected to reduction in 100 mm DTT, and after sample reduction, excess DTT and buffer were filtered off by centrifugation at 12,000 g for 15 min. Samples were then incubated in the dark with 100 μL IAA (50 mM) in centrifuge tubes for 45 min. This was followed by sequential addition of 100 μL UA buffer and 100 μLNH4HCO3 buffer, and samples were washed four times. Then, 60 μL trypsin buffer was poured into the centrifuge tube and incubated at 37°C for 20 h. The filtrate was collected using a new collection tube to complete elution of peptides for subsequent LC-MS determination.
2.3.3. LC-MS Analysis of Samples
The peptides of different samples were chromatographically separated using a chromatographic system (Easy-nLC1200, Thermo Scientific, Waltham, Ma, USA). The mobile phases were A: 0.1% formic acid water and B: 0.1% formic acid, 95% acetonitrile and water. First, the column was equilibrated with 100% solution A at a flow rate of 300 NL/min. The gradient elution program was set as follows: 0–2 min, 2%–8% B; 2–71 min, 8%–28% B; 71–79 min, 28%–40% B; 79–81 min, 40%–100% B; 81–90 min, 100%–100% B [6, 7].
The isolated peptide fragments were analysed using a mass spectrometer (QE HF-X, Thermo Scientific, Waltham, Ma, USA) with an analysis time of 90 min. Detection was in positive ion mode, and parent ions were scanned in the range of 400–1800 m/z. The resolutions for peptide and ion fragment detection were detected at 60,000 and 45,000, respectively. The 20 most intense ions were collected for MS/MS with an automatic gain control (AGC) target of 3 × 10⁶. For the peptides screened for MS/MS, a normalized collision energy of 32% was applied. About 100,000 ions were accumulated to produce the MS/MS spectra.
2.3.4. Data Analysis
Mass spectrometry raw files were imported into proteome discoverer software (version 2.4, Thermo Scientific, Waltham, Ma, USA) to perform a search. The database exploited in proteomic analysis was uniprot-Glycine max (Soybean) (Glycine hispida) [3847]-85135-220624, and the isobaric label was TMT 10plex. The Main search Peptide Tolerance and MS/MS Tolerance were set to 10 ppm and 0.02 Da, respectively. The PSM FDR and Protein FDR were both set to ≤0.01. Lastly, the razor and unique peptides were used for protein quantification. Student’s t-test combined with fold change (FC) was applied to screen out significantly different proteins (p < 0.05, and FC > 1.5 or <1/1.5). The differential proteins were imported into the GO and KEGG databases for functional annotation and pathway enrichment analysis.
2.4. 16S rRNA Sequencing Analysis
2.4.1. Microbiome Total DNA Extraction
The total genomic DNA from three sufu was extracted with a DNA extraction kit, and the quality of DNA extraction was detected by 1.2% agarose gel electrophoresis.
2.4.2. DNA Extraction and 16S rRNA Gene Amplicon Sequencing
The extracted sample DNA was stored at −70°C. DNA from three samples of the same kind of sufu was combined together for subsequent analysis. A fragment of the 16S rRNA gene was amplified by targeting with the designed primers (Table S1). Polymerase chain reaction (PCR) was conducted in a total reaction volume of 50 μL as follows: 1 μL of each primer, 1 μL of DNA template, 22 μL of dd-H2O, and 25 μL of 2 × ExTaq PCR Master Mix was (TransGen Biotech, Beijing, China). PCR amplification was performed as follows: 10 min initial denaturation at 94°C; 32 cycles of 94°C for 30 s, 58°C for 30 s, and 72°C for 30 s; 10 min final extension at 72°C. Three replicate PCR products of each sufu were mixed and purified with a PCR purification kit (DP214, TIANGEN, Beijing, China). The amplified product was subjected to 2% agarose gel electrophoresis and quantified with a fluorometer (Qubit 3.0, Thermo Scientific, Waltham, Ma, USA) [8]. The purified amplification products were mixed in equimolar amounts and sequenced using the Illumina Hiseq 2500 platform.
2.4.3. Preparation of a Sequencing Library and High-Throughput Sequencing
Firstly, a sequencing library was prepared using the TruSeq Nano DNA LT library preparation kit (Illumina, San Diego, California, USA). Next, the prepared library was purified again using BECKMAN AMPure XP Beads, and the purified library was quantified using the Quant it PicoGreen dsDNA assay kit on the PromegaQuantiFluor fluorescence quantification system. Finally, the samples were sequenced.
To ensure sequencing quality, the optimal sequencing length and insertion range of the target fragment were set to 200–450 bp.
2.5. Statistical Analysis
Principal component analysis (PCA) and Partial Least Squares Discrimination Analysis (PLS-DA) were applied to distinguish differences between the groups. The one-way ANOVA test was used to analyse the significance of multiple groups of compounds. Different compounds with settings p < 0.05 and VIP >1 would be considered as statistically significant compounds. Different bacterial groups in sufu were classified by UPGMA cluster analysis. The composition of proteins, metabolites, and the microbiota in different sufu was analysed by thermography. The dominant species and internal relations in different sufu were displayed by using the dominant species seed network.
3. Results
3.1. Widely Targeted Metabolomics Profiles of Sufu
The metabolites in sufu were diverse. To compare the overall metabolite profiles of three kinds of sufu, broadly targeted metabolomics technology was applied to identify and analyse the metabolites in WS, RS, and GS samples. The results showed that 1099 metabolites were identified in different sufu, including 1086 metabolites in RS, 1080 metabolites in WS, and 1069 metabolites in GS. The PCA showed that three groups of sufu samples were distributed in different regions (Figures 2(a), 2(b), 2(c), 2(d), 2(e), and 2(f)), indicating certain differences in the ingredients among the three sufu samples (Table S2). There were 448 metabolites that differed between RS and WS; 412 between WS and GS; and 517 between RS and GS. The metabolites of three kinds of sufu were quite different, which was consistent with recent reports [9] (Figures 2(g), 2(h), 2(i)). After testing, the PLS-DA analysis results were scientific (Figure S1-A1–A3, S1-B1–B3, Tables S3 and S4) and consistent with those of PCA.
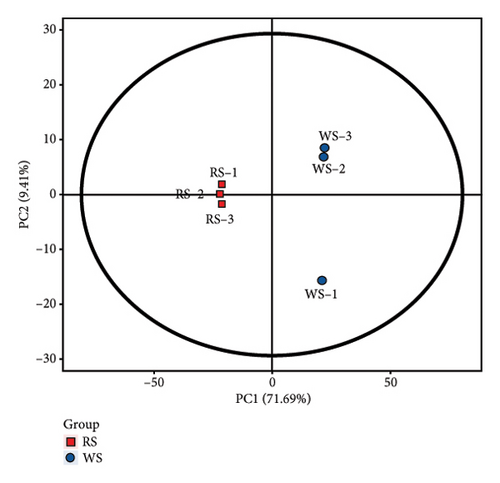
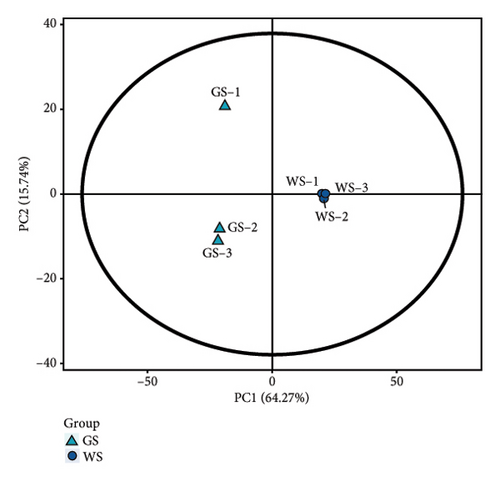
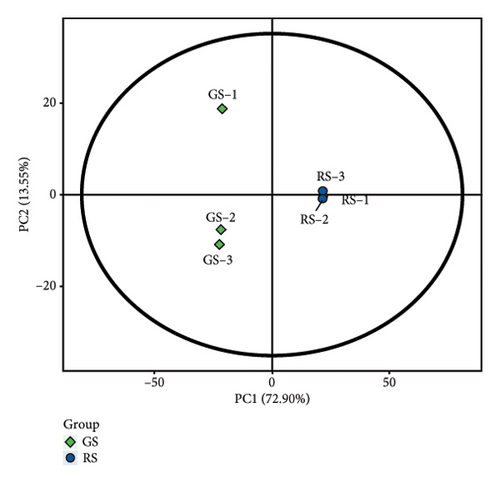
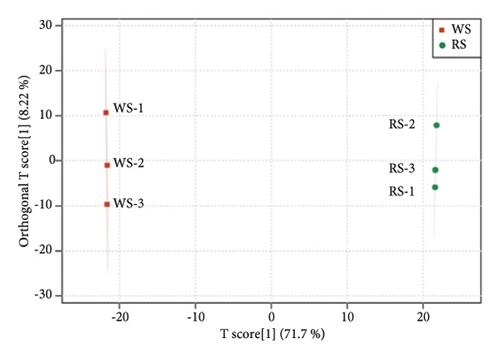
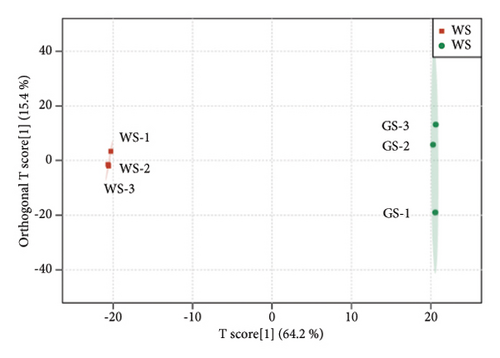
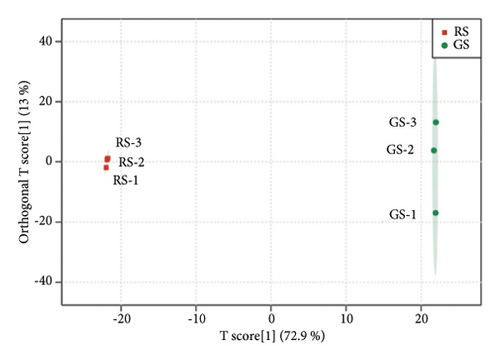
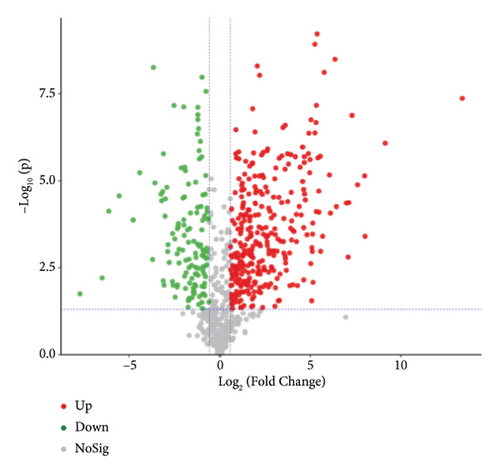
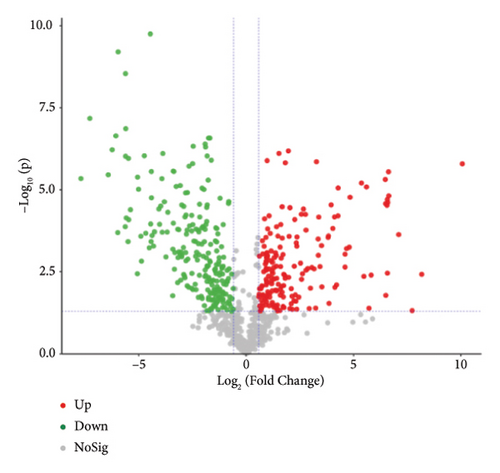
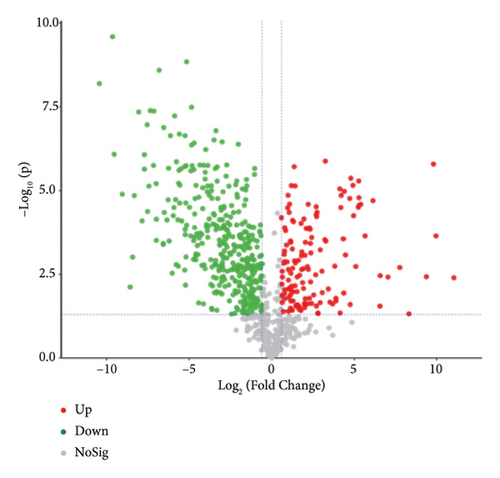
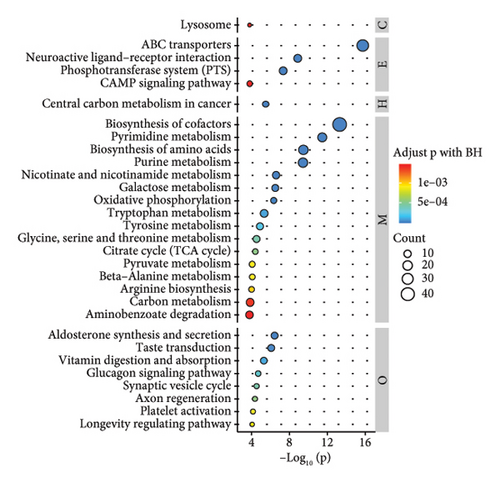
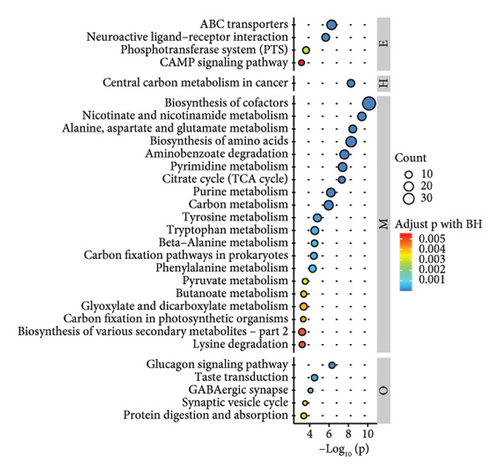
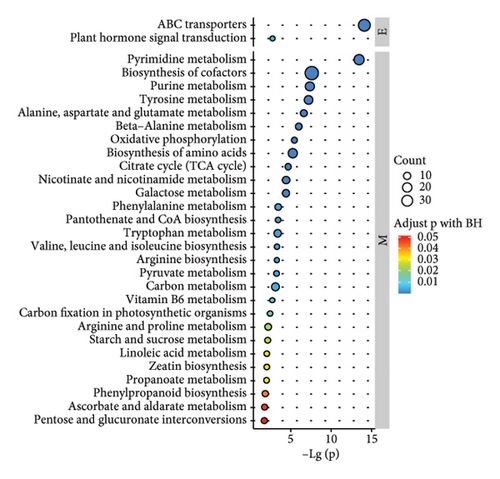
To present the differences among the three kinds of sufu metabolites more intuitively, a volcano diagram, histogram, and heat map analysis were conducted (Figures S1-C1–C3, S1-D1–D3, S1-E1–E3). The results showed that the three sufu differed significantly in the types and contents of their metabolites, as shown in Figure 2.
According to the results of metabolite identification combined with the KEGG database, the first 30 pathways with the lowest p values were screened (Figures 2(j), 2(k), and 2(l)). The results of KEGG pathway analysis of the differential compounds are shown (Figures 2(j), 2(k), and 2(l)). Compared with WS, the pathways involved in RS included cofactor biosynthesis, pyrimidine metabolism, amino acid biosynthesis, etc. Compared with WS, the pathways involved in GS included cofactor biosynthesis; nicotinate and nicotinamide metabolism; alanine, aspartate, and glucose metabolism, etc. Compared with RS, the pyrimidine metabolism pathway, cofactor biosynthesis pathway, purine metabolism pathway, and so on were involved in GS.
3.2. Proteomics
3.2.1. Protein Identification and Differential Proteins
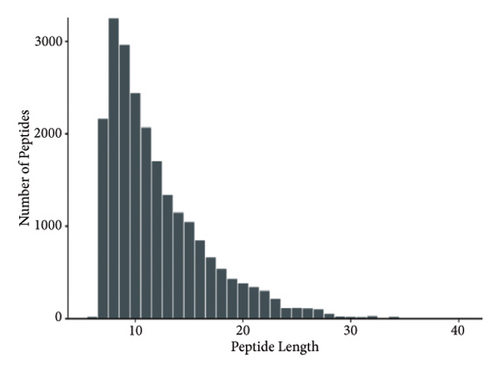
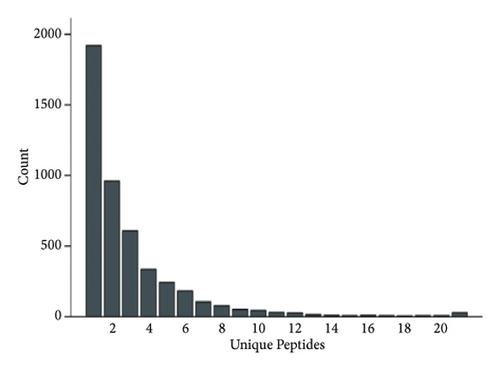
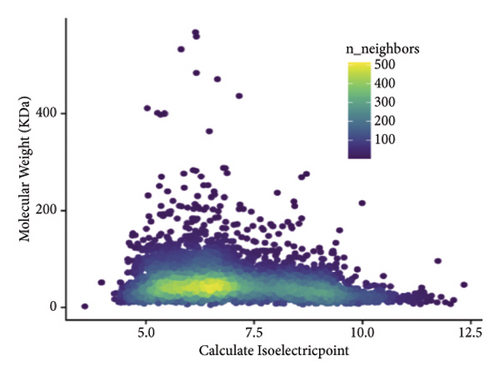
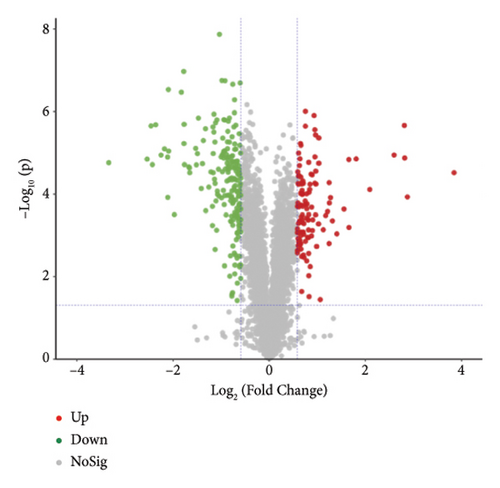
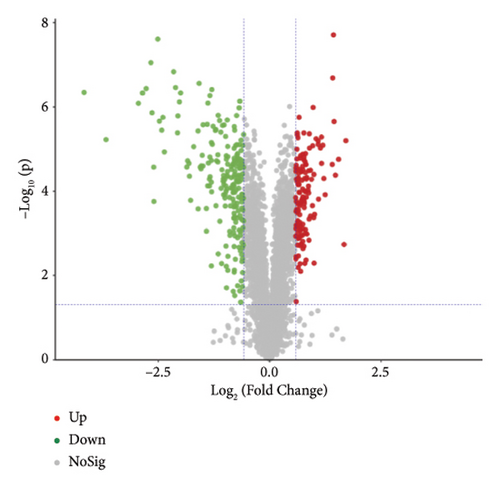
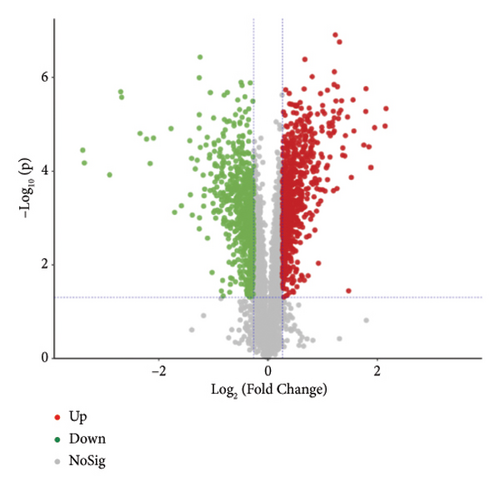
The proteins in different types of sufu were widely divergent. To compare the protein profiles of three kinds of sufu, Tandem Mass Tag™ Quantitative proteomics was exploited to determine the content and types of protein (Table S5). The analysis results showed that the total number of secondary spectra obtained from three kinds of sufu was 349,512. We obtained 65,744 chromatograms through protein database comparison, and the utilization rate of the chromatogram was 18.82%. A total of 65,744 peptides were obtained, including 22,715 unique peptides. The number of identified proteins was 4670, and the number of quantifiable proteins was 4663. The comparisons between RS and GS identified 322 proteins (122 up- and 200 down-regulated). The comparisons between GS and WS identified 355 proteins (140 up- and 215 down-regulated). The comparisons between GS and RS identified 1421 proteins (747 up- and 674 down-regulated) (Table S6). The top 30 differential proteins in the three comparison groups are displayed in Table S2, totalling 75. To observe the difference in sufu protein more intuitively in different groups, further volcano plot analysis was carried out for the differential protein (Figures 3(a), 3(b), 3(c), 3(d), 3(e), and 3(f)). The comparison results of three different sufu proteins showed that the number of down-regulated differentially abundant proteins was greater than that of up-regulated proteins. This indicated the presence of complex regulation of metabolic pathways among different sufu samples.
3.2.2. GO Function Annotation and KEGG Pathway Analysis
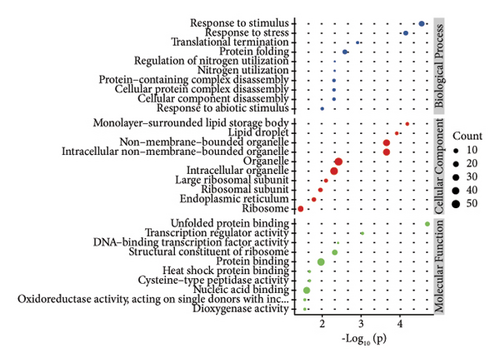
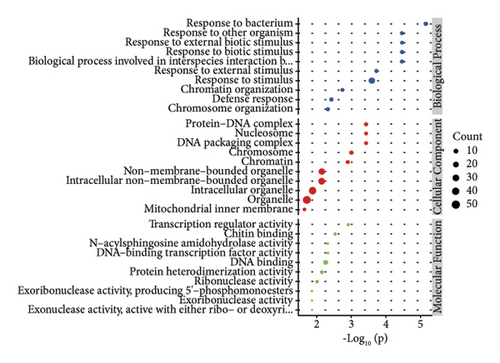
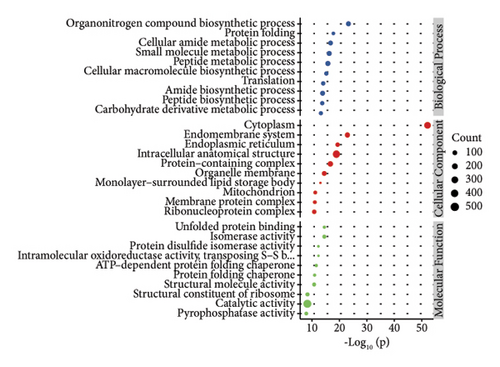
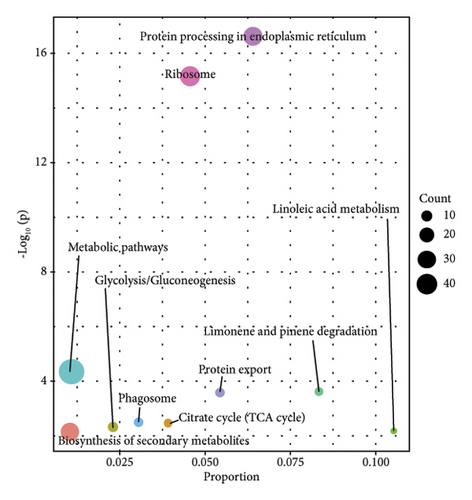
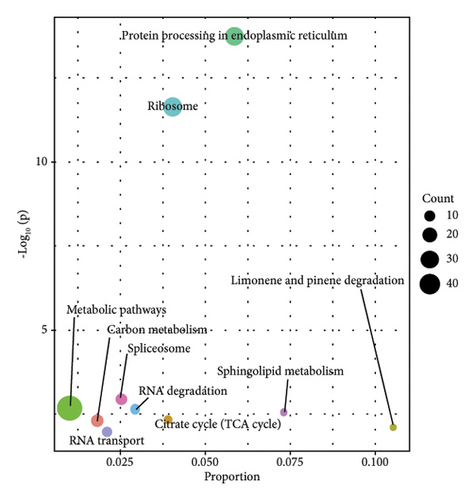
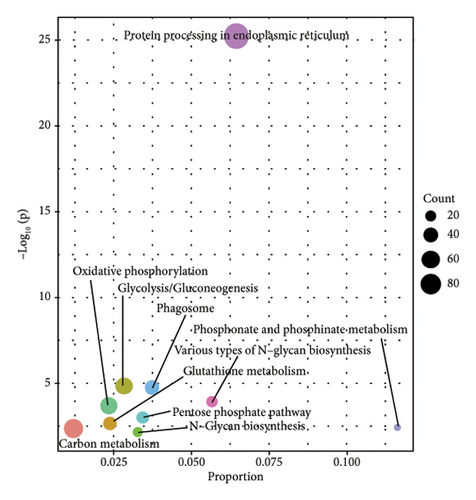
In order to study the biological function of different proteins in different kinds of sufu samples, GO annotation was carried out for different proteins. The enrichment results of the top 10 differential proteins are displayed on the image (Figures 3(g), 3(h), and 3(i)) and included protein processing pathways such as endoplasmic reticulum, ribosome, and metabolism. The enrichment pathway of differential proteins in GS was similar to that in WS. However, the differential proteins in RS were mainly enriched in endoplasmic reticulum, protein processing in phagosomes, glycolysis/gluconeogenesis pathway, etc. (Figures 3(j), 3(k), and 3(l)).
3.3. 16S rRNA Sequencing
3.3.1. Rarefaction Curve and Rank Abundance Curve
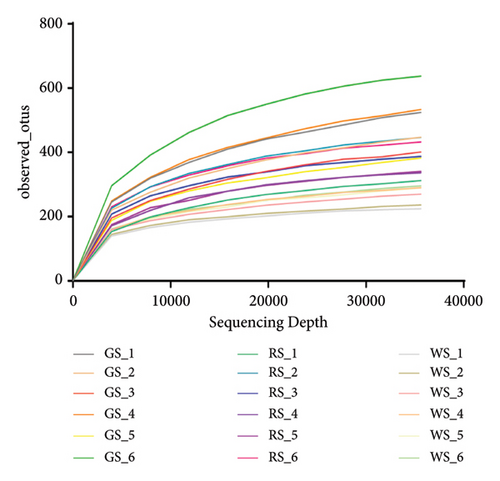
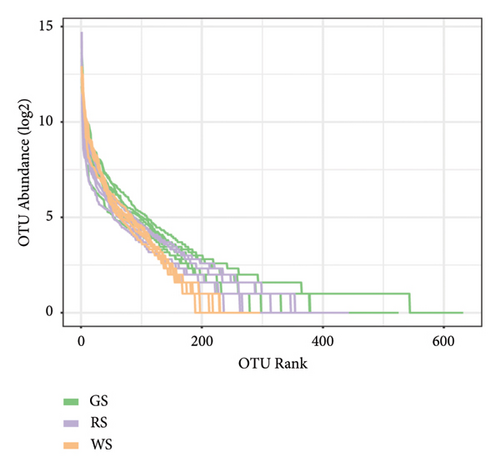
The sequencing results showed that the curve tends to flatten, indicating that the sequencing depth of the sample could meet the analysis requirements (Figures 4(a)). The results of the grade abundance curve showed that the broken line of the same kind of sufu was relatively flat, which implied that the composition of the bacterial colony in the same kind of sufu was high, and there was no significant difference; the broken lines were steep, and the evenness of the microbial composition was low, which showed obvious differences between different kinds of sufu (Figures 4(b)).
3.3.2. Analysis of α Diversity Index
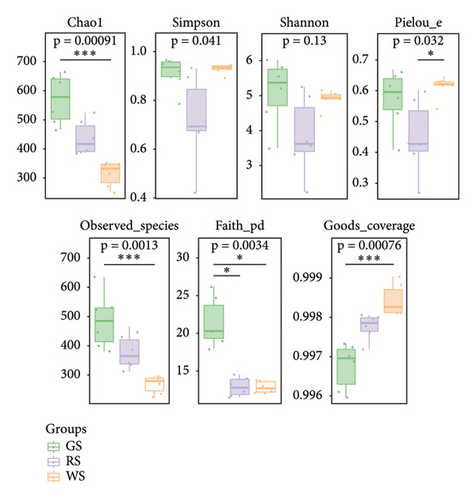
The alpha diversity of the microbiota in sufu was evaluated through Chao1, Simpson, Shannon, Faith’s PD (Faith), Pielou’s evenness (Pielou), and Good’s coverage (Good) indexes using the QIIME2 platform. The results showed that compared to WS, the Chao1 index for GS was significantly higher than that of the observed species (p < 0.01), indicating a higher abundance of bacterial colonies from GS. However, there was no statistical difference in the Chao 1 values between GS and RS, nor between the abundance from the RS and WS communities, which indicated that there was no significant difference in the bacterial colonies between GS and RS samples. There was also no significant difference in bacterial colonies between RS and WS. The Simpson index and Shannon index were not statistically different, indicating that there was no significant difference in microbial diversity among the three kinds of sufu. Compared with GS, the Faith PD indexes of RS and WS were lower (p < 0.01), which pointed out that there was lower evolutionary diversity between RS and WS. However, the Pielou index of RS was significantly lower than that of GS (p < 0.05), implying that the uniformity of colonies in RS was lower than that in GS. In addition, the good value of GS was significantly lower than that of WS (p < 0.01), suggesting that the coverage of colonies in GS was lower than that in WS (Figures 4(c)).
3.3.3. Analysis of β Diversity
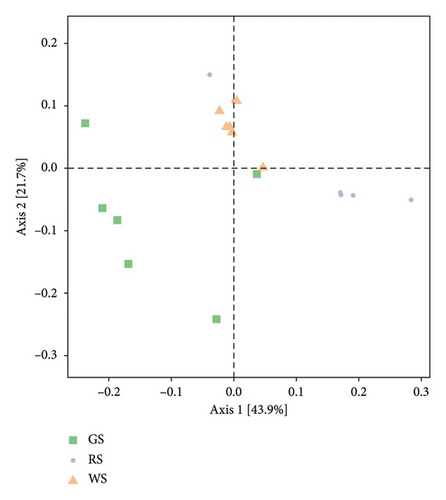
β diversity refers to the diversity of species composition between different communities. The analysis results reflected that three kinds of sufu were distributed in different areas in the figure, which indicated that there were differences in community structure and composition among the three kinds of sufu (Figures 4(d)).
3.3.4. Analysis of Species Composition
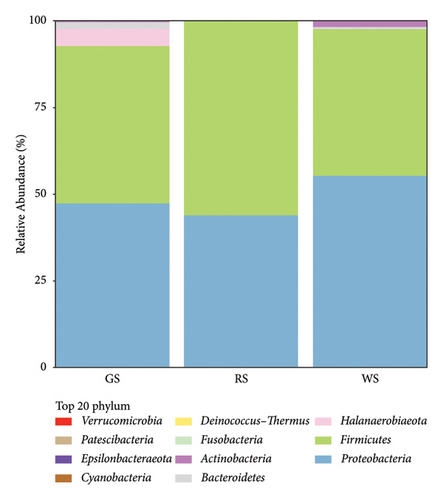
To explore the bacterial community composition of sufu samples, the 16S rRNA gene sequences of bacteria were classified on the phylum, class, order, family, genus, and species levels. The analysis results reported that a total of 77 microbial species were identified in three kinds of sufu. At the phylum level, the three sufu were mainly composed of Proteobacteria and Firmicutes, which accounted for about 90% of the total microbiota. Proteus accounted for approximately 47.3% of GS, and Firmicutes accounted for approximately 45.5% of GS, which is similar to recent reports [10]. Proteobacteria accounted for approximately 44.0% in RS, while the Firmicutes accounted for approximately 56.0% in RS. The Proteobacteria accounted for approximately 55.3% of WS, while the Firmicutes accounted for approximately 42.5% of WS. In addition, Halanaerobiaeota, bacteroides, actinomycetes, fusobacteria, Deinococcus thermos, cyanobacterium, Epsilonbateraeota, Patescibacteria, verrucomicrossbia, and other phyla were included in the three kinds of sufu (Figures 4(e)).
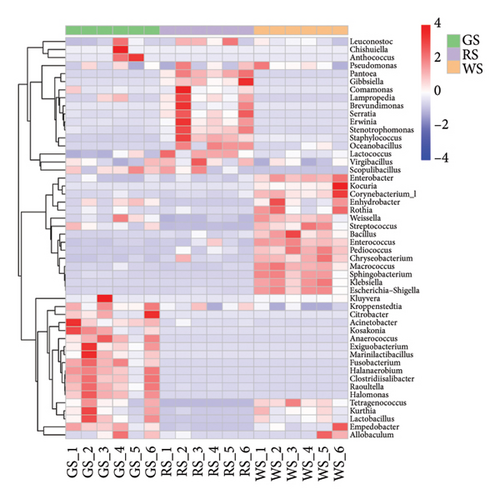
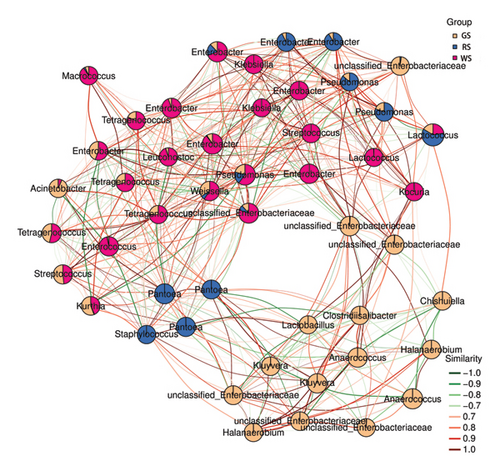
In order to further compare the microbiota composition of the three sufu, the microbiota with the average abundance in the top 50 were analysed. The results showed that the colour difference of the three sufu regions was obvious, which indicated that the microbiota composition differed significantly among samples (Figures 4(f)). The dominant microbiota of different sufu varied significantly, and there was a certain correlation among different microbiota (Figure 5).
3.4. Multi-Omics Analysis
3.4.1. Coanalysis of Proteomics and Metabolomics
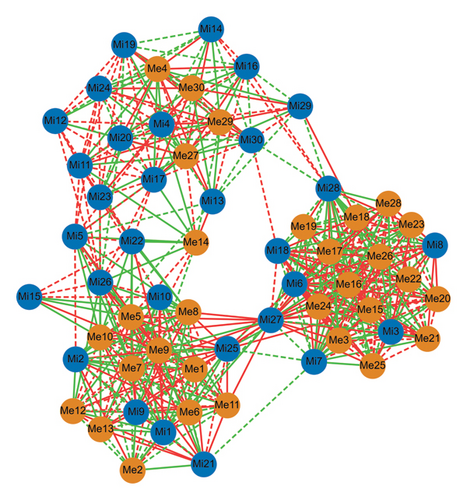
To analyse the interaction between proteins and metabolites contained in different kinds of sufu, proteomics and metabolomics were combined and the network of the proteome and metabolome was drawn (Figure 6).
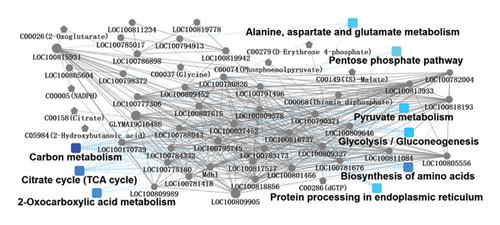
The analysis results showed that the differential proteins and differential metabolites from three kinds of sufu shared 79 KEGG pathways. Among them, the top 10 pathways in differential proteins and variant metabolites were carbon metabolism, glyoxylate and dicarboxylate metabolism, and amino acid biosynthesis, respectively. Sufu was rich in nutrients. The carbon metabolism activity was vigorous, and a large number of proteins and small molecules of metabolites were enriched in the process of carbon metabolism. At the same time, due to the different raw materials and production processes used for the three kinds of sufu, there were obvious differences in the types and contents of metabolites, which might result in variation in proteins and metabolites in the pathways of carbon metabolism, as well as glyoxylate and dicarboxylate metabolism of the sufu samples. This result was consistent with the fact that there were differences in the raw materials and production processes among the three kinds of sufu. Due to the variation in raw materials and processing technologies among RS, WS, and GS, the types of amino acids in three sufu samples were obviously different. The results of combined proteome and metabolite analysis showed that there were not only a large number of proteins with differential expression in the pathway of amino acid biosynthesis but also a large number of amino acids with different types and contents. This result suggested that there were significant differences in the types and contents of amino acids in RS, WS, and GS. This also corresponded to the fact that the raw materials and processing technology of the three kinds of sufu were different. The results suggested that consumers should choose the appropriate type of sufu according to the raw materials, nutritional components, and processing technology.
3.4.2. Coanalysis of Proteomics and Microbiomics
To comprehensively analyse the differences among the three kinds of sufu, this study jointly analysed the test data for proteomics and 16S rRNA. The results showed that 30 proteins were significantly different from the microbiota in the samples, among which the top 10 were NAD (P) H dehydrogenase (quinone), 3-oxoacyl-[acetyl carrier protein] reductase, glutamate–cysteine ligase, diphosphaeronate decarboxylase, ATP-dependent DNA helicase (Fragment), peptidyl-prolyl isomerase, ribulose bisphosphate carboxylase small subunit, SAC domain-containing protein, elongation factor G, chloroplastic, protein-serine/threonine phosphatase, diphosphomevalonate decarboxylase, uncharacterized protein, Reticulon-like protein, ATP-dependent DNA helicase (fragment), peptidyl-prolyl isomerase, napin-type 2S albumin 1, TRASH domain-containing protein, and lipocln_ cytosolic_ FA-bd_ dom domain-containing protein (0.7<|p|<1). These proteins were important substances in the synthesis and transformation of amino acids. Among the three kinds of sufu, there were 28 different genera of microbes that were significantly related to differentially expressed proteins, among which the top 10 were Blautia, Anaerococcus, Exobacterium, Pediococcus, Chishuiella, Streptococcus, Bacillus, Enterococcus, Acinetobacter, and Staphylococcus. The results indicated that the differential microorganisms in different sufu were closely related to the differential proteins, and this close connection may be the reason for the difference of amino acids among the three kinds of sufu (Figure 7).
3.4.3. Coanalysis of Microbiomics and Metabolomics
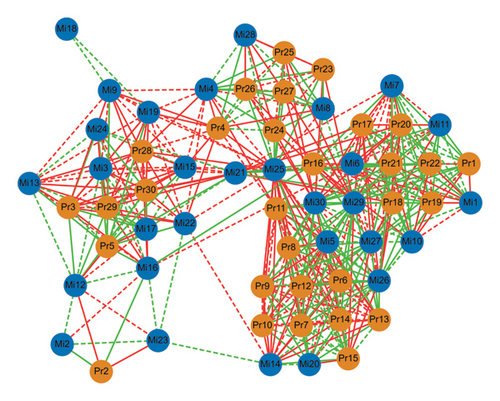
To analyse in depth the differences and internal relationships between the microbiota and metabolites in three kinds of sufu, a correlation analysis was conducted on the metabonomic and metabolomic data. The results showed that there were 31 kinds of microorganisms in the three kinds of sufu that had significant correlations with metabolites, and the top 10 were chishuiella, exiguobacterium, raoultella, pediococcus, enterococcus, bacillus, kocuria, acinetobacter, corynebacterium_ 1, and lactobacillus (0.7<|p|<1). A total of 30 metabolites in the three kinds of sufu samples were significantly correlated with microorganisms, among which the top 10 were hexanoyl-l-glycine, 2-deoxyribose-1-phosphate, argininosuccinic acid, tryptophal, gamma aminobutyric acid, N, N-dimethylglycine, aspartate, N-isovalerylglycine, arginine, and subscriber acid (0.7<|p|<1). In sufu samples, most of the compounds that were significantly related to microorganisms belonged to amino acids. The results not only further explained that there were obvious differences in the types and contents of amino acids among three kinds of sufu but also showed that the differences in the types and contents of amino acids in sufu samples were closely related to the microorganisms from these samples (Figure 8).
4. Discussion
In this study, broadly targeted metabolomics, proteomics, and 16S rRNA sequencing techniques were applied to identify the metabolites, protein distribution, and microbial community structure of different kinds of sufu, and multi-omics analysis was exploited to identify the correlation between metabolites, proteins, and microbial composition.
Our research showed that there were 306 metabolites with significant differences among the three groups of sufu. A total of 18 complete amino acids were identified in sufu, of which 8 were essential amino acids. Among the numerous essential amino acids, lysine was noteworthy. Lysine was highly effective in enhancing immunity, combating viruses, promoting fat oxidation, and alleviating anxiety. The metabolic results showed that the lysine content of WS was the highest among the three kinds of sufu. Therefore, consuming an appropriate amount of WS is beneficial to the human body. Previous studies have shown that consuming a certain amount of GABA could improve people’s sleep quality and help lower blood pressure [11, 12]. The results showed that the GABA content of GS was the highest (Figures S2A and S2B). Therefore, it was recommended that people with hypertension and sleep disorders could consume an appropriate amount of GS every day, which would help improve related symptoms. Studies showed that many vegetarians were vulnerable to vitamin B12 deficiency [13]. Vitamin B12 deficiency could lead to diseases such as megaloblastic anaemia, neurological damage, and hyperhomocysteinaemia [14]. The results of metabolomics analysis showed that the content of vitamin B12 in WS was the highest among the three kinds of sufu (Figures S2C). Therefore, for vegetarians, WS may be a good choice. The lack of vitamin B2 could affect the body’s biological oxidation and cause metabolic disorders, such as keratitis, cheilitis, glossitis, and conjunctivitis [15]. The content of vitamin B2 in sufu reached 0.13∼0.36 mg/100 g, which is 3∼7 times that found in tofu [16]. The results of vitamin B2 content determination in three kinds of sufu samples showed that the content of vitamin B2 in GS was the highest (Figures S2D). As a consequence, people who lack vitamin B2 could consume an appropriate amount of GS every day.
Most of the protein in sufu was decomposed into a low-molecular-weight polypeptide mixture by microbial enzymes, which was easy to digest and absorb, increasing the digestibility of protein in sufu from 65.3% of soybeans to 96%18 TMT-labelled proteomics was employed to analyse the proteins in GS, RS, and WS, and the functions of proteins in sufu samples were enriched and annotated through the GO and KEGG databases (Figure 2 (D1–D3)). The results of the top five enrichment pathways showed that linoleic acid metabolism was a common metabolic pathway between GS and RS. Spliceosome and RNA degradation were common metabolic pathways in RS and WS. Glycolysis/gluconeogenesis, phagosomes, various types of N-glycan biosynthesis, and oxidative phosphorylation chemistry were common metabolic pathways of WS and GS (Figures S2-E1–E3). If linoleic acid was lacking, cholesterol would combine with some saturated fatty acids, which might eventually lead to cardiovascular and cerebrovascular diseases [17]. The analysis results of sufu protein showed that among the three kinds of sufu samples, the amount of protein in GS was the most involved in linoleic acid metabolism. This indicated that consuming GS may be more beneficial for regulating linoleic acid metabolism and further affecting lipid metabolism. The spliceosome assembles on the precursor of messenger RNA to help fold it into a confirmation that allows transesterification [18]. The RNA degradation pathway is one of the pathways involved in the decay of eukaryotic ribonucleic acids and is crucial for the correct processing, quality control, and turnover of intracellular RNA molecules in many aspects of genetic information expression [19]. The analysis results of differential proteins showed that compared to WS, 14 differential proteins in RS were enriched in these two pathways. Hence, RS has the potential function of regulating intracellular messenger RNA. Glycolysis was the process of converting glucose into pyruvate and producing a small amount of ATP. The disruption of N-glycan biosynthesis could lead to a series of diseases, collectively known as congenital glycation disorders [20]. Oxidative phosphorylation was an important branch of energy metabolism in living organisms and was a coupled reaction in the synthesis of ATP. [21, 22]. The results of differential protein analysis showed that most of the proteins in WS were enriched in biosynthetic pathways such as glycolysis, N-glycan, and oxidative phosphorylation. To summarize, moderate intake of WS would have a beneficial promotional effect on the maintenance of human energy, the normal functioning of tissues and organs, and the prevention of congenital glycation disorders.
Sufu contains a richly varied microbiota, and each type of sufu has its own specific colony structure. High-throughput 16S rRNA sequencing analysis was carried out to study the bacterial diversity and community structure of three sufu samples in this paper. The results showed that Proteobacteria and Firmicutes were the dominant phyla of sufu, and Proteus was the largest phylum [23]. Firmicutes were one of the two main groups in the gut microbiota. A previous study determined that seven kinds of Enterobacteriaceae were pathogenic bacteria with infectivity. These Enterobacteriaceae may damage the host’s immune system and may cause urinary tract and lung infections, which reminds everyone to control their WS intake. The dominant bacteria of RS were pantoea, accounting for approximately 90%–95% of the total microbiome. Pantaea comprises more than 20 species, but over 90% of infections were associated with only two species (excluding humans). Therefore, whether consumption of RS could cause human infections remained to be discussed [24]. The dominant bacteria in GS were Kluyvera (Figures S2F). Clovira may be a rare human conditional pathogen [25]. As the infection caused by Clovira is still uncertain, it is as yet unclear whether GS could lead to human infection through Clovira.
Based on the combined analysis results of metabolomics, proteomics, and microbiomics, there was a significant correlation between the metabolites, proteins, and microbiota in three kinds of sufu. The raw materials, processing technology, and microbiota in different types of sufu lead to different types and amounts of amino acids [26].
5. Conclusion
In summary, the differences and intrinsic links among the metabolites, proteins, and microbiota of the three kinds of sufu were analysed by metabolomics, proteomics, and 16SrRNA sequencing techniques firstly. The findings showed that 1099 metabolites and 306 different metabolites, including lysine, GABA, and vitamin B12, existed in the three kinds of sufu. A total of 4663 proteins and 2098 differential proteins were identified in three kinds of sufu. The differential proteins of the three kinds of sufu were enriched in different KEGG pathways, mainly including lipid metabolism, mRNA regulation, and glucose metabolism. Approximately 77 kinds of microbes were included in the three sufu samples. The dominant bacteria common to the three kinds of sufu were Proteobacteria and Firmicutes. In addition, the dominant bacteria of WS, RS, and GS were enterobacter, pantoea, and kluyveromyces spp. The conjoint analysis results of the three omics showed that the types and contents of amino acids in sufu were formed under the interaction of metabolites, proteins, and the microbiota. This study systematically discussed the differences between three kinds of sufu in terms of metabolites, proteins, and microbial communities for the first time, which will help people better understand the nutritional value of different sufu, and also help special people more accurately screen suitable sufu types, and which will provide a reference for the further development of sufu, the excavation of new food value, and the reasonable selection of different sufu.
Conflicts of Interest
The authors declare that they have no conflicts of interest.
Authors’ Contributions
Chenning Zhang developed methodology, investigated the study, handled software, wrote the original draft, and conducted funding acquisition and project administration. Ying Li investigated the study, handled software, and supervised the study. Tao He and Mo Sun investigated the study and handled software. Yuanyang Shao conceptualized the study, wrote, reviewed, and edited the study, supervised the research, and revised this manuscript. All authors contributed to the article, reviewed the manuscript, and approved the submitted version. These authors Chenning Zhang and Ying Li have contributed equally to this work and shared the first authorship.
Acknowledgments
Funding for this work was supported by the key project of the 2022 Medical and Health Science and Technology Plan of Xiangyang City, Hubei Province (Grant no. 2022YL30A), and the Natural Science Foundation of Hubei Province (Grant no. 2022CFB867).
Open Research
Data Availability
Data will be made available on request.


