VLDL Induced Modulation of Nitric Oxide Signalling and Cell Redox Homeostasis in HUVEC
Abstract
High levels of circulating lipoprotein constitute a risk factor for cardiovascular diseases, and in this context, the specific role of the very-low-density lipoproteins (VLDL) is poorly understood. The response of human umbilical vein endothelial cells (HUVEC) to VLDL exposure was studied, especially focusing on the pathways involved in alteration of redox homeostasis and nitric oxide (NO) bioavailability. The results obtained by the analysis of the expression level of genes implicated in the NO metabolism and oxidative stress response indicated a strong activation of inducible NO synthase (iNOS) upon 24 h exposure to VLDL, particularly if these have been preventively oxidised. Simultaneously, both mRNA and protein expression of endothelial NO synthase (eNOS) were decreased and its phosphorylation pattern, at the key residues Tyr495 and Ser1177, strongly suggested the occurrence of the eNOS uncoupling. The results are consistent with the observed increased production of nitrites and nitrates (NOx), reactive oxygen species (ROS), 3-nitrotyrosine (3-NT), and, at mitochondrial level, a deficit in mitochondrial O2 consumption. Altogether, these data suggest that the VLDL, particularly if oxidised, when allowed to persist in contact with endothelial cells, strongly alter NO bioavailability, affecting redox homeostasis and mitochondrial function.
1. Introduction
Atherosclerosis, one of the principal causes of morbidity and mortality in occidental countries, is a disease affecting large and medium-sized muscular arteries, characterised by endothelial dysfunction and vascular inflammation [1–3]. Dyslipidaemia, and in particular, the increased concentration of cholesterol esters and low-density lipoproteins (LDL) at the arterial intima surface, has long been recognised as a major proatherogenic factor [4] potentially more dangerous for the vessels upon increasing the lipid oxidation level [5–8]. Not only the LDL but also the very-low-density lipoproteins (VLDL), the physiological precursors of the LDL, might share the responsibility of the onset and builds up of the atherosclerotic plaques [9]. The implication in the atherosclerotic lesion of VLDL can be indirect, since the more elevated the VLDL concentration, the higher the LDL accumulation, but also direct due to the straight molecular interactions with the arterial cell components, membranes, and receptors [10, 11].
Evidence has been collected suggesting that, as reported for the LDL [5], also the oxidation of VLDL triggers a cascade of proatherogenic and proinflammatory cell responses [12]. These include lipoprotein retention in the arterial wall and recruitment of macrophages at the vessel level; under these conditions, foam cells are formed and eventually the atherosclerotic plaque builds up [13, 14].
Interestingly, while the role of LDL and their redox state in the atherogenesis have been both intensively studied [15–18], the experimental evidence supporting the direct involvement of VLDL, native or oxidized, in the onset and development of atherosclerosis is still limited.
Previous reports have shown an increased production of reactive oxygen species (ROS) by mitochondria, accumulation of mitochondrial DNA damage, and progressive respiratory chain dysfunction associated with atherosclerosis [19–23]. A growing body of evidence suggests that alterations of the nitric oxide (NO) synthesis may be involved with this disease [18, 24, 25].
As a gaseous cell messenger, NO regulates several pathways both in prokaryotes and in eukaryotes [18, 26–29], including the modulation of cell energetic through the interaction with electron transport chain proteins [30–32]. Very relevant to cardiovascular diseases, the NO generated by endothelial cells plays a crucial role in the blood pressure control via relaxation of the vessel muscular smooth muscle cells [33].
Studies on knockout mice demonstrated that NO produced at low (nM) concentration by the constitutive NO synthases (eNOS and nNOS) exerts vasculo-protective effects, whereas higher NO concentration levels (μM), as those synthesized by the inducible NOS (iNOS), are more often associated with oxi/nitrosative stress of vessels and tissues [34, 35].
Moreover, it has been observed that under condition favoring oxidative stress and inflammation, the impairment of the physiological activity of the eNOS may occur, leading to the so called “uncoupling state” characterized by the production of superoxide O2−• instead of NO [36–38].
The present work was aimed at characterising the response of vascular endothelial cells in culture to a time-persistent (24 h) administration of VLDL as purified from human blood sera (native), or oxidised, focusing on the NO metabolism, the ROS production, and the changes of the primary mitochondrial function [39]. Human umbilical vein endothelial cells (HUVEC) have been taken as a model of vascular endothelium, and within the simplification of a monoculture, it allowed a detailed biochemical characterisation of eNOS biosynthesis and function, pointing to a key role played by this enzyme in the early redox unbalance associated to the onset of atherosclerosis.
2. Materials and Methods
2.1. Cell Culture
Human umbilical vein endothelial cells (HUVEC, ATCC CRL-1730) were cultured on 0.2% (w/v) gelatin-precoated flasks or multiwell plates (Falcon, BD Biosciences, USA) and grown at 37°C, 5% CO2, 95% air in F-12K medium containing 1.26 g/L glucose, 0.1 mg/mL heparin, 0.03 mg/mL endothelial cell growth supplement (ECGS), 10% fetal bovine serum (FBS), 100 U/mL penicillin, 100 μg/mL streptomycin, and 1.5 g/L sodium bicarbonate.
The day before the experiments, cells were depleted of serum for 4 h and thereafter incubated in serum-free medium for 24 h with native VLDL (n-VLDL) or oxidised VLDL (ox-VLDL), at the concentration of 75 or 140 μg protein mL−1, the former assayed only in a subset of experiments.
Controls were carried out in the absence of VLDL, under otherwise identical conditions. When necessary, HUVEC were harvested by trypsinization and centrifugation (900 ×g) and carefully suspended in the working medium, at suitable density (see text). None of the treatments affected cellular viability of HUVEC, as determined by cell counts, morphology, and trypan blue exclusion analysis.
Cell lysis was performed by CelLytic™ MT Cell Lysis Reagent (Sigma-Aldrich, USA) in the presence of the Protease Inhibitor Cocktail (Sigma-Aldrich, USA); protein content was determined according to bicinchoninic acid (BCA) assay (Sigma-Aldrich, USA), and citrate synthase activity, considered as representative of the mitochondrial mass, was measured as described [40].
2.2. VLDL Isolation and Ethics Statement
n-VLDL (density: 0.95–1.006 kg/L) were isolated from human sera by preparative ultracentrifugation following the procedure described by Redgrave et al. [41]. Serum samples were collected from typically 40–50 healthy volunteers of age comprised between 20 and 40 years (gender equally represented) after 12 h fasting, in order to minimize the biological variability among the preparations. The presence of chylomicrons in fresh sera was eliminated centrifuging for 30 min at 15,000 rpm. Then, n-VLDL were obtained by ultracentrifugation at 105,000 ×g, for 18 h at 15°C in a 1.006 kg/L density solution. After ultracentrifugation, the supernatant from the top of each tube was carefully aspirated and pooled. n-VLDL were dialysed against 0.25 mM ethylenediaminetetraacetic acid (EDTA) in phosphate-buffered saline (PBS), using a membrane (molecular weight cut-off: 6–8 kDa) at 4°C overnight. All VLDL preparations were filtered through a sterile 0.45 μm filter and, after the evaluation of protein concentration by the BCA (~500 μg/mL), were stored at −70°C until used. The purity of isolated VLDL was checked on agarose gel and sodium dodecyl sulphate polyacrylamide gel electrophoresis (SDS-PAGE), staining with a lipid-specific dye (Sudan Black B) and a protein-specific dye (Coomassie Blue R 250), respectively.
n-VLDL with high degree of purity were obtained as outcome by its apolipoprotein composition determined by SDS-PAGE (Supplementary Figure 1(a) available online at https://doi.org/10.1155/2017/2697364) and characteristic mobility (Supplementary Figure 1(b)) [42, 43]. Human sera were collected anonymously by the Immunohematology Laboratory, Policlinico Umberto I, Sapienza Università di Roma. The procedure described has been approved by the Ethics Committee of Sapienza University (Prot. number 3610-2015).
2.3. VLDL Oxidation
VLDL oxidation was carried out according to Guha and Gursky [44] using Cu2+ ions (CuSO4). Briefly, a solution of purified n-VLDL, at the concentration 0.2–0.4 mg mL−1 in EDTA-free PBS, was incubated with CuSO4, 40 μM for 6 h; the reaction was then stopped using 1 mM EDTA. Conjugated dienes and thiobarbituric acid-reactive substances (TBARS) were quantified in order to monitor lipid peroxidation [45, 46] (Supplementary Figure 1(c) and (d), resp.).
2.4. Real-Time Polymerase Chain Reaction (PCR)
After HUVEC incubation, for 24 h, with n-VLDL or ox-VLDL (140 μg mL−1), total RNA was extracted using the Nucleo Spin® RNA isolation kit (Macherey-Nagel, Germany), according to the manufacturer’s instructions. Total RNA, 1 μg, was used for the reverse transcription reaction using RT2 First Strand Kit (Qiagen, Germany). The cDNA obtained was hybridised to the Human Nitric Oxide Signalling Pathway RT2 Profiler PCR Array (Qiagen, Germany).
This array contains oligonucleotide primers matching 84 genes whose expression is controlled by or involved in the signalling of NO, superoxide metabolism, and response to oxidative stress (see Table 1). The array includes also genes that are known to be induced or repressed by NO and whose finding therefore can be used as indicator for the activation of NO cell pathways.
| Functional grouping | Gene | n-VLDL (rel. exp.)# | P value n-VLDL versus 0 VLDL | ox-VLDL (rel. exp.)# | P value ox-VLDL versus 0 VLDL | P value ox-VLDL versus n-VLDL |
|---|---|---|---|---|---|---|
| Nitric oxide metabolism | NOS1 (nNOS) | — | — | — | — | — |
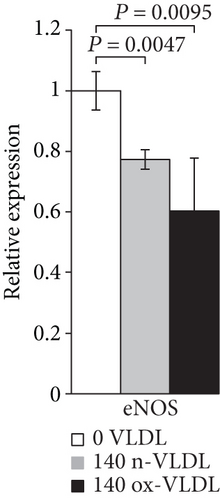
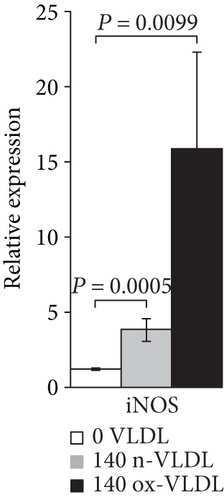
| Nitric oxide biosynthesis | NOS2 (iNOS) | 3521 ± 0.684 | 0.0005 ∗ | 15,212 ± 7287 | 0.0099 ∗ | 0.0513 |
| NOS3 (eNOS) | 0.772 ± 0.031 | 0.0047 ∗ | 0.602 ± 0.173 | 0.0095 ∗ | 0.1857 | |
| Nitric oxide biosynthesis | DYNLL1 | 0.996 ± 0.450 | 0.9860 | 1066 ± 0.345 | 0.7615 | 0.8376 |
| Regulation | GLA | 0.921 ± 0.253 | 0.6263 | 1438 ± 0.231 | 0.0424 | 0.1046 |
| HSP90AB1 | 1157 ± 0.393 | 0.5550 | 1553 ± 0.343 | 0.0485 | 0.2456 | |
| IL8 | 0.551 ± 0.507 | 0.0794 | 6532 ± 2814 | 0.0272 ∗ | 0.0654 | |
| INS | — | — | — | — | — | |
| NOS1AP | 1037 ± 0.684 | 0.1139 | 2028 ± 0.395 | 0.0075 ∗ | 0.0125 ∗ | |
| Other nitric oxide | AKT1 | 1014 ± 0.189 | 0.5801 | 1356 ± 0.513 | 0.3054 | 0.7300 |
| Biosynthesis genes | ARG2 | 1196 ± 0.265 | 0.3450 | 1847 ± 0.109 | 0.0006 ∗ | 0.0278 |
| DDAH2 | 1158 ± 0.281 | 0.4354 | 0.621 ± 0.386 | 0.0616 | 0.0439 | |
| EGFR | 2750 ± 2317 | 0.1798 | 2639 ± 1704 | 0.1045 | 0.9498 | |
| GCH1 | 0.786 ± 0.119 | 0.0579 | 1354 ± 0.701 | 0.4329 | 0.2406 | |
| GCHFR | 0.685 ± 0.281 | 0.1486 | 0.327 ± 0.249 | 0.0136 ∗ | 0.1734 | |
| Nitric oxide induced | CDKN1A | 1611 ± 1425 | 0.4282 | 1533 ± 0.904 | 0.3065 | 0.9399 |
| CXCL8 | — | — | — | — | — | |
| JUN | 1574 ± 0.655 | 0.2130 | 21,111 ± 0.890 | 0.0949 | 0.4297 | |
| VEGFA | 1451 ± 0.620 | 0.2582 | 5372 ± 1224 | 0.0134 ∗ | 0.0226 ∗ | |
| Nitric oxide suppressed | CCNA1 | 1335 ± 0.558 | 0.4048 | 1534 ± 0.128 | 0.0097 ∗ | 0.8953 |
| MYB | — | — | — | — | — | |
| TROAP | 2080 ± 0.589 | 0.0192 ∗ | 1189 ± 0.156 | 0.1658 | 0.1917 | |
| Nitric oxide signalling | CAMK1 | 1477 ± 0.388 | 0.2150 | 1916 ± 0.473 | 0.0161 ∗ | 0.5063 |
| DLG4 | 1505 ± 0.935 | 0.3199 | 1178 ± 0.920 | 0.7098 | 0.6873 | |
| GRIN2D | 1461 ± 0.573 | 0.0832 | 1012 ± 0.554 | 0.9659 | 0.5407 | |
| PPP3CA | 1003 ± 0.388 | 0.4840 | 1386 ± 0.067 | 0.0155 ∗ | 0.9211 | |
| PRKAR1B | 1627 ± 0.620 | 0.1029 | 1472 ± 0.137 | 0.0259 ∗ | 0.7621 | |
| PRKCA | 1083 ± 0.036 | 0.5305 | 1909 ± 0.149 | 0.0019 ∗ | 0.0052 ∗ | |
| NQO1 | 3456 ± 0.606 | 0.0018 ∗ | 2525 ± 0.835 | 0.0312 ∗ | 0.1657 | |
| Superoxide metabolism | ALOX12 | 1425 ± 0.450 | 0.0911 | 3253 ± 0.187 | 0.0001 ∗ | 0.0017 ∗ |
| Release | DUOX1 | 1105 ± 0.317 | 0.1697 | 0.404 ± 0.048 | 0.0029 ∗ | 0.0115 ∗ |
| Oxidoreductases | DUOX2 | 1429 ± 0.949 | 0.3574 | 0.439 ± 0.069 | 0.0001 ∗ | 0.1435 |
| Peroxidases | NOX5 | — | — | — | — | — |
| PRG3 | — | — | — | — | — | |
| SOD1 | 0.897 ± 0.235 | 0.4863 | 1608 ± 0.492 | 0.1094 | 0.1532 | |
| SOD2 | 0.942 ± 0.414 | 0.8203 | 1819 ± 0.502 | 0.0539 | 0.1200 | |
| SOD3 | — | — | — | — | — | |
| Other superoxide | CCS | 1296 ± 0.670 | 0.4132 | 1173 ± 0.518 | 0.5367 | 0.8134 |
| Metabolism genes | NCF1 | — | — | — | — | — |
| NCF2 | 1250 ± 0.698 | 0.4988 | 3637 ± 1943 | 0.0549 | 0.1460 | |
| PREX1 | 0.916 ± 0.191 | 0.6021 | 0.857 ± 0.255 | 0.4455 | 0.7658 | |
| Oxidative stress | MPO | — | — | — | — | — |
| Antiapoptotic | MTL5 | 0.756 ± 0.316 | 0.1880 | 0.759 ± 0.479 | 0.3562 | 0.9919 |
| NME5 | 1049 ± 0.249 | 0.7349 | 1645 ± 0.939 | 0.2187 | 0.3483 | |
| PRDX2 | 0.999 ± 0.294 | 0.9952 | 1040 ± 0.029 | 0.7286 | 0.8198 | |
| RNF7 | 1260 ± 0.655 | 0.5334 | 1248 ± 0.140 | 0.0863 | 0.9827 | |
| Antioxidants | APOE | — | — | — | — | — |
| MT3 | — | — | — | — | — | |
| VIMP | — | — | — | — | — | |
| SRXN1 | 2721 ± 2766 | 0.2554 | 8175 ± 3135 | 0.0075 ∗ | 0.1113 | |
| Glutathione peroxidases | GPX1 | 1355 ± 0.587 | 0.4132 | 1070 ± 0.387 | 0.8239 | 0.5210 |
| GPX2 | 1392 ± 1035 | 0.4698 | 0.890 ± 0.314 | 0.5164 | 0.4669 | |
| GPX3 | 1639 ± 0.795 | 0.1599 | 1683 ± 0.682 | 0.0960 | 0.9458 | |
| GPX4 | 1436 ± 0.894 | 0.4714 | 1283 ± 0.663 | 0.5417 | 0.8239 | |
| GPX5 | — | — | — | — | — | |
| GPX6 | — | — | — | — | — | |
| Other oxidoreductases | CAT | 1079 ± 0.533 | 0.8239 | 1287 ± 0.542 | 0.4419 | 0.6603 |
| EPX | 1132 ± 0.448 | 0.4422 | 2491 ± 0.655 | 0.0087 ∗ | 0.1634 | |
| LPO | — | — | — | — | — | |
| MSRA | 1298 ± 0.793 | 0.48110 | 1062 ± 0.458 | 0.8025 | 0.6788 | |
| PRDX6 | 1918 ± 1369 | 0.3161 | 1526 ± 0.741 | 0.2989 | 0.6865 | |
| TPO | 0.802 ± 0.688 | 0.5814 | 0.868 ± 0.095 | 0.1235 | 0.9056 | |
| TXNRD2 | 1746 ± 0.944 | 0.1712 | 0.933 ± 0.284 | 0.6938 | 0.2250 | |
| Other peroxidases | CSDE1 | 1532 ± 1115 | 0.4558 | 0.868 ± 0.558 | 0.7056 | 0.4081 |
| CYGB | — | — | — | — | — | |
| GPR156 | — | — | — | — | — | |
| PRDX2 | 0.999 ± 0.294 | 0.9953 | 1040 ± 0.029 | 0.7286 | 0.8198 | |
| PRDX5 | 1412 ± 0.845 | 0.3940 | 1035 ± 0.537 | 0.9149 | 0.5503 | |
| TTN | 0.416 ± 0.095 | 0.0008 ∗ | 0.350 ± 0.192 | 0.0026 ∗ | 0.7083 | |
| Regulation | FOXM1 | 1541 ± 0.369 | 0.0670 | 1695 ± 0.914 | 0.2597 | 0.8012 |
| GLRX2 | 1006 ± 0.447 | 0.9657 | 1323 ± 0.778 | 0.5124 | 0.6323 | |
| SCRT2 | — | — | — | — | — | |
| SIRT2 | 1322 ± 0.502 | 0.3329 | 1339 ± 0.292 | 0.1279 | 0.9676 | |
| Other oxidative stress | ATOX1 | 1254 ± 0.913 | 0.6551 | 1515 ± 0.757 | 0.3056 | 0.7224 |
| Response genes | DUSP1 | 1186 ± 0.189 | 0.3110 | 1490 ± 0.797 | 0.1381 | 0.3571 |
| GSS | 1357 ± 0.684 | 0.4227 | 1124 ± 0.173 | 0.3452 | 0.5988 | |
| KRT1 | — | — | — | — | — | |
| MBL2 | 2039 ± 1129 | 0.1870 | 16,376 ± 10,431 | 0.1108 | 0.1335 | |
| NUDT1 | 1521 ± 1018 | 0.3459 | 1871 ± 0.589 | 0.0340 | 0.6342 | |
| OXR1 | 0.876 ± 0.199 | 0.3577 | 1044 ± 0.606 | 0.8910 | 0.6727 | |
| PNKP | 1382 ± 0.601 | 0.2771 | 1566 ± 0.907 | 0.2675 | 0.7837 | |
| PRNP | 2908 ± 2329 | 0.2226 | 5331 ± 2944 | 0.0284 | 0.4218 | |
| SCARA3 | 0.762 ± 0.376 | 0.3352 | 0.482 ± 0.277 | 0.0318 | 0.3568 | |
| SEPP1 | — | — | — | — | — | |
| SGK2 | 4371 ± 5854 | 0.3548 | 8491 ± 5139 | 0.0698 | 0.5327 |
- n-VLDL = RT-PCR assay performed after 24 h incubation of HUVEC with native VLDL (140 μg/mL); ox-VLDL = RT-PCR assay performed after 24 h incubation of HUVEC with oxidised VLDL (140 μg/mL). #Relative expression (rel. exp.) versus untreated cells (0 VLDL) grown for an overall comparable time. cDNAs undetectable under the condition assayed were indicated by “—.” P values considered statistically significant by ANOVA were marked by “ ∗.”
2.5. Western Blot
After HUVEC treatments, cells (1 × 10⁶) were lysed with CelLytic MT Reagent (Sigma-Aldrich, USA) in the presence of Protease Inhibitor Cocktail (Sigma-Aldrich, USA). The proteins were separated on 10% sodium dodecyl sulphate-polyacrylamide gel electrophoresis (SDS-PAGE) and transferred on nitrocellulose membranes (Whatman, GE Healthcare, UK), 1 h at 100 mA. After 2 h blocking (PBS with 0.1% Tween 20 and 3% BSA), the membranes were incubated overnight at 4°C with primary mouse monoclonal anti-phospho-Ser1177 and anti-phospho-Thr495 antibodies (BD Transduction Laboratories, USA). Thereafter, the membranes were stripped and reprobed for monoclonal purified mouse anti-eNOS antibodies (BD Transduction Laboratories, USA); α-tubulin was used as the reference. The enhanced chemiluminescence (ECL) Horseradish Peroxidase (HRP) anti-mouse secondary antibody (Jackson, Baltimore, PA, USA) was incubated 1 h at 25°C, and chemiluminescence was determined (Amersham, GE Healthcare, UK). Densitometric analysis was carried out by the ChemiDoc™ MP Image Analysis Software (Bio-Rad, USA).
2.6. ROS Quantification
Cell ROS generation was assessed by using the fluorescent probe 2′,7′-dichlorodihydrofluorescein diacetate (DCFDA, Sigma-Aldrich, USA), with modifications respect to the protocol generally adopted for adherent cells.
Briefly, HUVEC (70–75% confluent) were incubated with VLDL for 24 h as already described, then trypsinized, and pelleted at 900 ×g for 5 min at 20°C. Cell pellets were resuspended in Hank’s buffer at the density 1 × 10⁵ cells mL−1 and plated in 24-well (black) plates.
Immediately after the addition of 10 μM DCFDA, the relative fluorescence emission was followed kinetically at 520 nm for 60 min (VICTOR™ Multilabel Counter, PerkinElmer, USA). The value of ROS production is taken at 30 min.
2.7. Nitrate/Nitrite Determination
The accumulation of nitrate/nitrite (NOx) in the culture medium was assessed by using the fluorescent probe 2,3-diaminonaphthalene (DAN) (Fluorometric Assay Kit, Cayman Chemical, USA).
After 24 h incubation of HUVEC (~2.5 × 10⁵ cell/mL) with n-VLDL or ox-VLDL, the culture supernatant was centrifuged at 4°C, 1000 ×g for 10 min and the NOx content was measured by adding DAN according to the manufacturer’s instructions and using a Fluorescence Plate Reader VICTOR Multilabel Counter (PerkinElmer, USA).
2.8. 3-Nitrotyrosine Quantification
The level of 3-nitrotyrosine- (3-NT-) modified proteins was used as marker of protein damage induced in HUVEC by peroxynitrite and quantified using nitrotyrosine ELISA kit (Abcam ab113848, UK).
After treatments with n-VLDL or ox-VLDL at different concentration (75, 140 μg/mL), HUVEC were trypsinized, pelleted at 500 ×g for 10 min, and washed twice using PBS buffer. Then, cells (~1 × 10⁶) were suspended in sample extraction buffer and incubated on ice for 20 min. After centrifugation at 12,000 ×g 4°C for 20 min, the 3-NT levels were determined colorimetrically according to the manufacturer’s instructions.
2.9. O2 Consumption Measurements
HUVEC incubated with n-VLDL or ox-VLDL (140 μg/mL) were harvested and resuspended in the oxygraph medium consisting of 3 mM MgCl2 × 6 H2O, 10 mM KH2PO4, 20 mM HEPES, 1 g/L BSA, 110 mM mannitol, 0.5 mM EGTA, and pH 7.1. Cell density and viability were determined by trypan blue exclusion test. Respiration was assayed as previously described [47, 48] using a high-resolution respirometer (Oxygraph-2k; Oroboros Instruments) equipped with two 1.5 mL chambers with thermostats; data were collected and analysed using the built in software DatLab 4.
Cells (1 × 10⁶) were added to the oxygraph chamber containing the medium, and the system let equilibrate for 5 min. Cell plasma membrane was permeabilised to reducing substrates and effectors with digitonin (see text). The optimal digitonin concentration, 2.7 μg/mL, and the incubation time, 10 minutes, were fixed according to [49].
The contribution to cell respiration of any respiratory complex was evaluated according to Kuznetsov et al. with minor modifications [50]. Briefly, 10 min after the addition of digitonin, 8.8 mM pyruvate and 4.4 mM malate were added and the resting complex I-supported respiration was recorded (state 4); ADP, 2 mM, was then added to induce the maximal mitochondrial respiration (state 3), followed by rotenone, 0.5 μM, to specifically inhibit complex I; succinate, 10 mM, was added to induce complex II-supported respiration, and antimycin, 5 μM, was added to inhibit complex III; finally, complex IV-dependent respiration was activated by 2 mM ascorbate and 0.5 mM N,N,N′,N′-tetramethyl-p-phenylenediamine (TMPD).
2.10. Citrate Synthase
HUVEC were harvested (1 × 10⁶), lysed, and centrifuged at 13,000 ×g for 10 min. Cell lysates were assayed for citrate synthase activity [40] and for total protein content. HUVEC, used as controls or after incubation with n-VLDL or ox-VLDL, displayed the same protein content (~0.2 mg/mL) and citrate synthase activity (~0.18 μmol/min/1 × 106 cells) (not shown).
2.11. Statistical Analysis
Data are the mean ± standard deviation (SD) of at least three independent biological experiments (as specified in the figure legends), each repeated in three technical replicates. For statistical analysis, one-way analysis of variance (ANOVA), followed by Bonferroni-Holm post hoc test, was used for multiple comparisons. P values indicated in figures were considered statistically significant by ANOVA. In Table 1, the P values for all genes are shown; when followed by ∗, P values were considered significant by ANOVA.
3. Results
The transcriptional activity of HUVEC exposed to 140 μg/mL n-VLDL or ox-VLDL was investigated by targeting genes related to NO metabolism and to oxidative stress. The genes included in the screening have been grouped in functional classes (Table 1), and the mRNA production of each gene has been reported as the relative to that of untreated cells (see Materials and Methods).
3.1. eNOS and iNOS Genes
As shown in Figures 1(a) and 1(b) following cell incubation with n-VLDL, the eNOS mRNA expression is slightly downregulated by ~0.25-fold, whereas the iNOS is upregulated by ~2.5-fold. When cells were exposed to ox-VLDL, the eNOS mRNA expression was more clearly downregulated (~0.4-fold) while the iNOS increased largely by approximately 15-fold.
3.2. Other NO-Related Genes
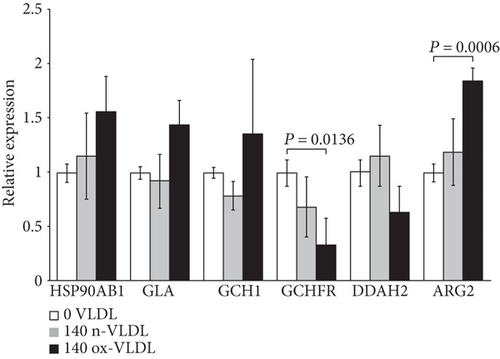
This group includes genes involved in the stability and functional regulation of the NOS enzyme. Following cell incubation with ox-VLDL, the HSP90AB1, GLA, GCH1, and ARG2 genes are upregulated, whereas the DDAH2 and the GCHFR genes are downregulated (see Figure 1(c)).
Changes of the expression levels of this selection of genes are very small when induced by n-VLDL, varying by a larger extent if VLDL were preliminarily oxidised (see Table 1).
3.3. Inflammation-Related Genes
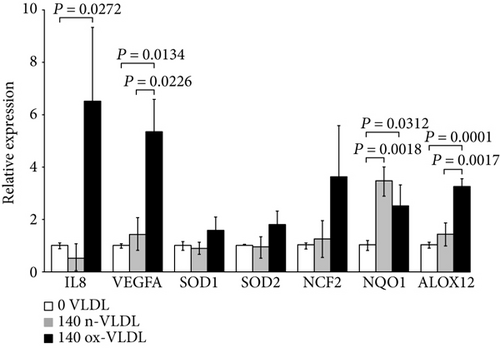
Along with the iNOS mRNA, also the VEGFA-, IL8-, and ALOX12-encoding genes are upregulated by ox-VLDL, pointing to the activation of inflammation pathways (Figure 1(d)). The expression of endothelial genes involved in the NADPH oxidase biosynthesis and function, namely, the NCF2 and NQO1, also appears upregulated together with the SOD1 and SOD2 mRNA, the latter increased by ~1.8-fold (see Table 1 and Figure 1(d)). In this frame, the 24 h cell incubation with n-VLDL is clearly less effective.
3.4. eNOS Expression and Uncoupling
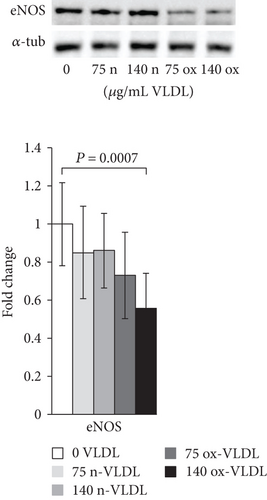
The protein expression of eNOS was determined by Western blot analysis in HUVEC incubated with n-VLDL or ox-VLDL. For the analysis, primary antibodies against eNOS, or specifically recognising Thr495- or Ser1177-phosphorylated eNOS, were used. Consistent with the data shown in Figure 1, the exposure to n-VLDL leads to a ~20% decrease of the eNOS protein detected regardless to the lipoprotein concentration used, namely, 75 and 140 μg mL−1. The exposure to ox-VLDL, at the same concentrations, induces, respectively, a ~30% and ~40% decrease of protein expression (Figure 2(a)).
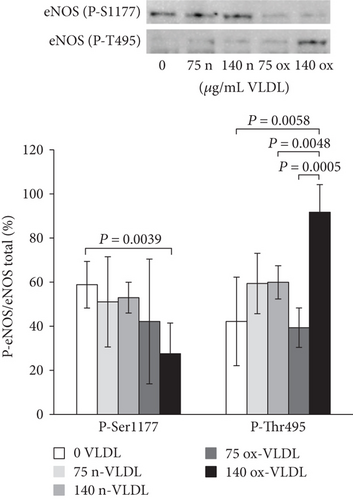
The results of Western blot carried out with primary antibodies directed against phosphorylated eNOS indicated differences in phosphorylation at the level of key regulatory sites, Ser1177 and Thr495, upon varying VLDL redox state and concentration. In Figure 2(b), the results were reported as the ratio of phosphorylated eNOS (at Ser1177 or Thr495) over total eNOS (%). Control cells exhibited a ~60% phosphorylation at Ser1177 (P-Ser1177), and incubation with n-VLDL (both 75 and 140 μg mL−1) did not induce significant changes. Nevertheless, the amount of P-Ser1177 decreased significantly to ~30%–40% of the total eNOS, when cells were incubated with ox-VLDL (Figure 2(b)). Somewhat symmetrically, Thr495 (P-Thr495) is ~40% phosphorylated in the controls, reaching ~60% phosphorylation upon incubation with n-VLDL, regardless to their concentration, in the limited range explored. At the highest ox-VLDL concentration, up to ~90% threonin was phosphorylated (Figure 2(b)).
3.5. Nitrite/Nitrate, Reactive Oxygen Species, and 3-Nitrotyrosine
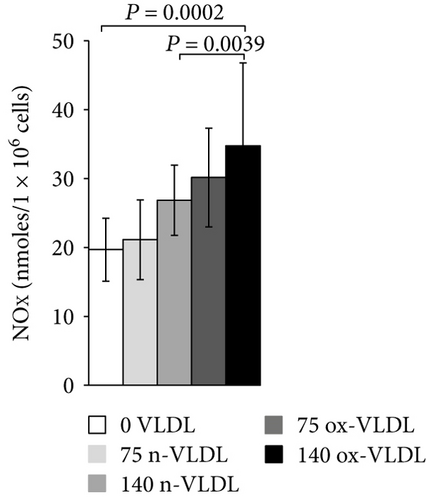
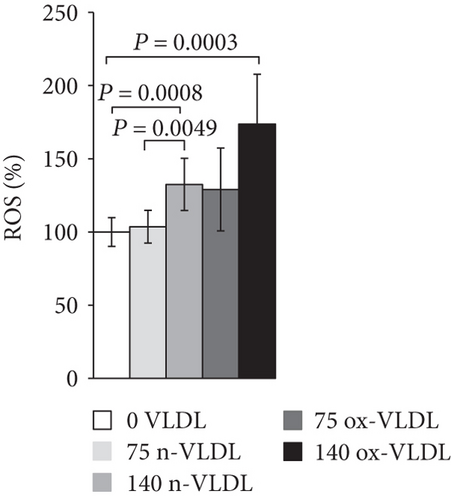
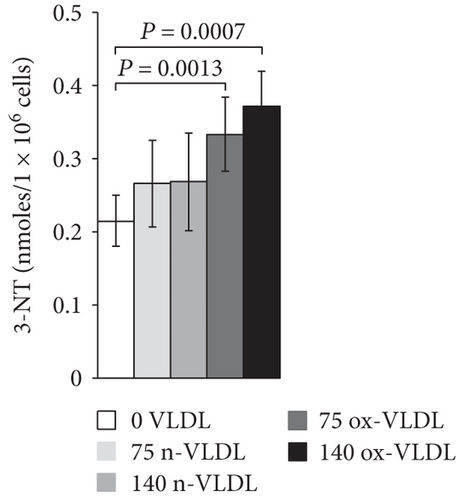
The accumulation of nitrite/nitrate (NOx), the production of ROS, and the concentration level of 3-NT were measured after 24 h incubation with VLDL. As shown in Figure 3(a), ~20 nmoles NOx was produced by 106 control cells in 24 h. Incubation with VLDL resulted in the increase of NOx production, as a function of VLDL concentration and oxidation state. 75 μg/mL and 140 μg/mL ox-VLDL resulted in the highest NOx increase, respectively, by 1.5- and 2-fold with respect to controls. The production of ROS was also measured under similar conditions. As shown in Figure 3(b), the ROS level rises during the 24 h incubation, with increasing the concentration of VLDL, and more markedly if these are oxidised; the larger effect is observed at the highest ox-VLDL concentration. A comparable trend is observed when monitoring the level of 3-nitrotyrosine protein modification; this last finding, particularly, suggests a correlation between the persistence in the HUVEC environment of ox-VLDL and formation of the short-lived detrimental peroxynitrite (Figure 3(c)).
3.6. HUVEC Respiration
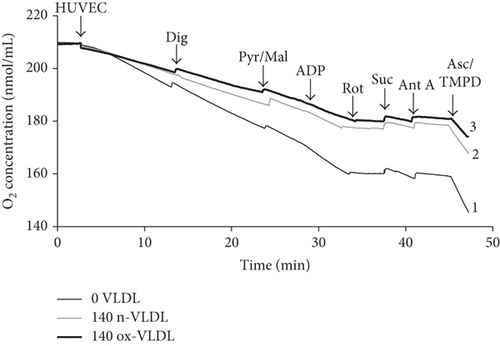
The O2 consumption of HUVEC following treatment with n-VLDL or ox-VLDL was measured oxigraphically. Measurements were carried out under different experimental conditions, such as using intact or digitonin-permeabilised cells in the presence or absence of specific mitochondrial substrates and respiratory chain inhibitors.
Typical traces are reported in Figure 4(a), where HUVEC untreated or incubated with n-VLDL or ox-VLDL, both 140 μg mL−1, were allowed to consume O2 in the presence and absence of selective activators or inhibitors of specific respiratory chain complexes [49, 50]. The basal rates of O2 consumption have been measured and reported under all conditions (see Figure 4(b)). As shown in the figure, the incubation with n-VLDL induces a ~21% decrease of the O2 consumption, from ~85 pmoles O2 s−1 to ~67 pmoles O2 s−1. Moreover, the rate of respiration decreases, instead down to ~59% of the initial value, if incubation is carried out with ox-VLDL.
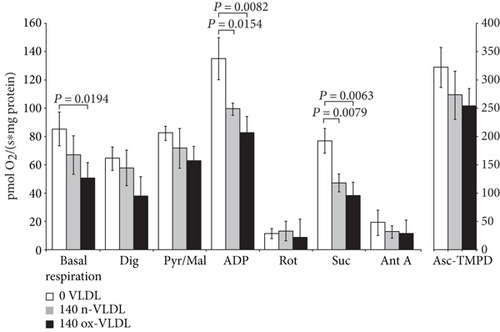
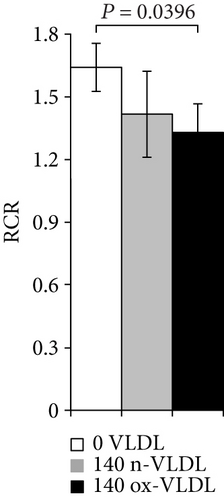
The depression of O2 consumption appears slightly more evident in the presence of rotenone and succinate, inhibiting complex I and activating complex II, respectively (Figure 4(b)). The basal respiratory control ratio, RCR, was also affected by the VLDL incubation; it decreased from 1.74 to 1.50 and 1.40, upon treatment with n-VLDL and ox-VLDL, respectively (see Figure 4(c)).
4. Discussion
The endothelium of vessels exposed to oxidative stress displays an altered availability of reactive oxygen and nitrogen species (RONS) that may result in disturbance of mitochondrial function and unbalancing of cell physiological signalling, aspects in which NO is known to play a crucial role [31, 51–54].
Bioavailability of NO at cell level depends on the activity of the NOS isoforms, so that physiological pathways ascribable to eNOS activity are featured by a limited (nM) amount of NO, whereas higher NO concentrations (μM) resulting from the activation of iNOS are responsible for structural modifications such as membrane lipid peroxydation and protein nitrosation. These modifications are associated to the onset and maintenance of severe inflammatory states, including atherosclerosis [34, 55, 56].
In this study, human umbilical vein endothelial cells (HUVEC) have been used as a model system to investigate the endothelium response to a persistent VLDL exposure.
The incubation time and the VLDL concentrations were chosen so to set a mild though clear dyslipidemic condition of pathophysiological relevance. Within the experimental limits of cells in culture mimicking endothelium microenvironment, cells were allowed to face for 24 h about twice as much the physiological blood concentration of VLDL (140 μg/mL), as prepared (native) or oxidized. The experimental design was such to investigate the role of VLDL in inducing nitro-oxidation of endothelium-like cells.
The analysis of NOS expression suggested the activation of a regulative antagonistic cross talk among the two NOS isoforms (eNOS and iNOS), so that the upregulation of the iNOS mRNA was accompanied, under comparable conditions, by a significant downregulation of the eNOS.
The iNOS activation is fully consistent with the increased production of NOx independently detected in the culture medium, suggesting a pathway of NO production which escapes the eNOS control. Furthermore, the increased production of ROS and 3-nitrotyrosine herein reported is consistent with the evidence of peroxynitrite formation compatible with a cogent inflammatory state of the cells [34].
The whole framework is also coherent with the upregulation of IL8 and VEGFA, genes involved in NO production and cell inflammatory response [57] and with the increased expression of NCF2 and NQO1 factors related to the NADPH oxidase function and biosynthesis [58, 59].
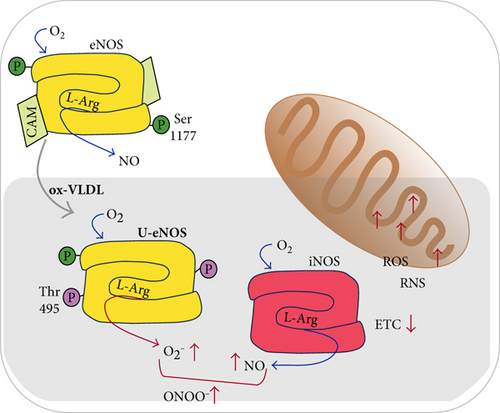
Consistently with the setting of an inflammatory state, the lowered eNOS synthesis induced by VLDL in HUVEC may imply an alteration of the physiological vasodilatory function relying on nanomolar NO fluxes. It is worth to notice that the eNOS is not only downregulated, according to both the mRNA and protein expression changes: based on the detected eNOS phosphorylation pattern (by targeting phospho-Ser1177 and phospho-Thr495), the enzyme appears also largely uncoupled hence supporting the production of superoxide ion [60–62].
The relevance of the proposed involvement of VLDL in the biosynthetic and functional regulation of eNOS was supported by changes found, over the same time scale, on the regulation of genes involved to NOS stability and function [63, 64]. The decreased expression of DDAH2, scavenger of an eNOS inhibitor (ADMA) [65], as well as the upregulation of ARG2, responsible for the depletion of arginine, were all elements pointing to the impairment of the physiological production of NO.
Interestingly, and somehow discordant with the above findings, some differences in the expression of other genes from the same array, as the modest upregulation of HSP90, involved in maintaining the dimeric structure of eNOS [66] and of GLA, responsible for degradation of the eNOS uncoupler Gb3 [67], seemed to point out the activation of compensatory pathways possibly aimed to the preservation of the eNOS function. Furthermore, the upregulation of the enzyme GCH1, involved in BH4 biosynthesis, combined to the downregulation of its feedback regulator GCHFR, suggests that under conditions in which BH4 oxidation is feasible, such as under oxidising conditions, signals enhancing BH4 bioavailability may be activated by endothelial cells, aimed at preventing or possibly reverting eNOS uncoupling [38, 68].
It is interesting to underline that upon VLDL treatment, the observed increase in ROS concentration follows a trend fully consistent with the progress of eNOS uncoupling, detected by Western blot. A peak in ROS concentration was found after 140 μg/mL ox-VLDL administration, a condition matching that responsible for the ultimate eNOS uncoupling (lowest phospho-Ser1177, highest phospho-Thr495).
It may be also interesting to point out that the increased production of superoxide goes along with a mild upregulation of SOD1 and SOD2 mRNAs (Figure 1(d)), thus suggesting a cell attempt to tempering ROS rise.
Beside NO, ROS are also involved in the maintenance of physiological vascular homeostasis, through a tight control exerted by healthy endothelial cells.
The setting of prooxidative conditions was shown to result in increased ROS production, associated with the activation of signals promoting oxidative damage [22, 69].
Hence, the VLDL-induced cell redox changes are characterised by the concurrent synthesis of NO by the iNOS and of O2−• by the uncoupled eNOS. These two evidences are fully compatible with the observed production of the highly reactive species peroxynitrite, probed by the increased tyrosine nitration.
Ox-VLDL treatment appears to be the condition necessary and sufficient to determine peroxynitrite formation, as the increase of 3-NT was found significant already at 75 μg/mL, compared to control cells; this may suggest a specific interaction of ox-VLDL with the scavenger receptors. As already reported for ox-LDL, this class of cell surface receptors may specifically recognise oxidised lipoproteins, thus activating typical inflammatory cell response [70, 71].
The whole picture appears consistent with the onset and/or maintenance of a nitrosative stress in endothelial cells undergoing VLDL treatments; within this frame, the determination of the functional state of mitochondria is relevant to define the level of cell dysfunction.
VLDL induced a functional decrease (mild if native, more evident if oxidised) of mitochondrial respiration. The mitochondrial respiratory control ratio (RCR) also followed a similar trend. The respiratory chain activity, evaluated at the level of the specific mitochondrial complexes, showed a decrease of the electron transfer efficiency (~20%), detected almost uniformly along the chain, apparently just slightly more at the level of complex II (~50% inhibition by ox-VLDL).
As the observed impairment on mitochondrial respiration may not be unequivocally attributed to a specific respiratory complex, it appears feasible to envisage that the oxi/nitrosative stress induced by VLDL may determine relevant modification of mitochondrial proteins, such as protein nitrosation, causing an interference with the electron transfer process. The persistency of these conditions would bring to supercomplex disaggregation and alteration of the mitochondrial proteolipid arrangement.
5. Conclusions
From these experiments, we can propose that 24 h incubation of HUVEC with native and oxidised VLDL triggers a signalling leading to iNOS activation and eNOS uncoupling.
These events, resulting in an unbalance of NO and ROS metabolism, are more clearly produced by excess of ox-VLDL leading to production of harmful proxynitrite and triggering a cell inflammatory state. Consistently, cells display a lower mitochondrial O2 consumption and RCR (Figure 5).
It is tempting to speculate on the biomedical relevance of these results: an altered lipid metabolism arising from both a genetic or epigenetic background could represent a condition in which an inadequate lifestyle (smoking abuse, highly processed food consumption, and pollution) provides an additional detrimental contribution, perceived by the endothelium of vessel as a prooxidant insult.
According to our results, the early dysfunction of the eNOS associated to iNOS activation driven by VLDL can be relevant to set conditions compatible with the development of atherosclerosis.
Abbreviations
-
- ADMA:
-
- Asymmetric dimethylarginine
-
- ADP:
-
- Adenosine diphosphate
-
- ALOX12:
-
- Arachidonate 12-lipoxygenase, 12S type
-
- ARG2:
-
- Arginase, type II
-
- BSA:
-
- Bovine serum albumin
-
- cDNA:
-
- Complementary DNA
-
- DDAH2:
-
- Dimethylarginine dimethylaminohydrolase 2
-
- EC:
-
- Endothelial cells
-
- eNOS:
-
- Endothelial nitric oxide synthase
-
- EDTA:
-
- Ethylenediaminetetraacetic acid
-
- Gb3:
-
- Globotriaosylceramide
-
- GCH1:
-
- GTP cyclohydrolase 1
-
- GCHFR:
-
- GTP cyclohydrolase I feedback regulator
-
- GLA:
-
- Galactosidase alpha
-
- HSP90AB1:
-
- Heat shock protein 90 kDa α, class B member 1
-
- HUVEC:
-
- Human umbilical vein endothelial cells
-
- IL8:
-
- Interleukin 8
-
- iNOS:
-
- Inducible NOS
-
- LDL:
-
- Low-density lipoproteins
-
- NCF2:
-
- Neutrophil cytosolic factor 2
-
- NO:
-
- Nitric oxide
-
- nNOS:
-
- Neuronal NOS
-
- NOx:
-
- Nitrites and nitrates
-
- NQO1:
-
- NAD(P)H dehydrogenase, quinone 1
-
- n-VLDL:
-
- Native VLDL
-
- ox-VLDL:
-
- Oxidised VLDL
-
- PBS:
-
- Phosphate-buffered saline
-
- PCR:
-
- Polymerase chain reaction
-
- P-Ser1177:
-
- Phosphorylated serine 1177
-
- P-Thr495:
-
- Phosphorylated threonine 495
-
- RNS:
-
- Reactive nitrogen species
-
- ROS:
-
- Reactive oxygen species
-
- RONS:
-
- Reactive oxygen and nitrogen species
-
- Thr:
-
- Threonine
-
- RCR:
-
- Respiratory control ratio
-
- Ser:
-
- Serine
-
- SOD1:
-
- Superoxide dismutase 1
-
- SOD2:
-
- Superoxide dismutase 2
-
- VEGFA:
-
- Vascular endothelial growth factor A
-
- VLDL:
-
- Very-low-density lipoproteins
-
- U-eNOS:
-
- Uncoupled eNOS
-
- 3-NT:
-
- 3-Nitrotyrosine.
Conflicts of Interest
The authors declare that there is no conflict of interests regarding the publication of this paper.
Authors’ Contributions
Maria Chiara Magnifico and Roxana Elena Oberkersch have contributed equally to this work.
Acknowledgments
This work was supported by the Ministero dell’Istruzione, dell’Università e della Ricerca (MIUR) of Italy (PRIN20107Z8XBW 005) to Paolo Sarti and Regione Lazio of Italy (FILAS-RU-2014-1020) to Paolo Sarti. The Erasmus Mundus Programme Action 2 Arcoiris Partnership (UID ARCO1100237) and ERASMUS + Programme (KA103) are acknowledged for supporting Roxana Elena Oberkersch and Yasmine Grooten. The authors gratefully acknowledged the staff from the “Immunohematology and Transfusion Medicine” UOC of Policlinico Umberto I and particularly Dr. Rosato V. and Dr. Malanga G. for the selection of blood samples from healthy volunteers used in this study. The authors are grateful to Dr. Alessio Paone for supporting them in the statistical analysis of the results.


