A Direct Eulerian GRP Scheme for the Prediction of Gas-Liquid Two-Phase Flow in HTHP Transient Wells
Abstract
A coupled system model of partial differential equations is presented in this paper, which concerns the variation of the pressure and temperature, velocity, and density at different times and depths in high temperature-high pressure (HTHP) gas-liquid two-phase flow wells. A new dimensional splitting technique with Eulerian generalized riemann problem (GRP) scheme is applied to solve this set of conservation equations, where Riemann invariants are introduced as the main ingredient to resolve the generalized Riemann problem. The basic data of “X well” (HTHP well), 7100 m deep, located in Southwest China, is used for the case history calculations. Curve graphs of pressures and temperatures along the depth of the well are plotted at different times. The comparison with the results of Lax Friedrichs (LxF) method shows that the calculating results are more fitting to the values of real measurement and the new method is of high accuracy.
1. Introduction
The prediction of pressure and temperature of transient gas-liquid flow in a wellbore is important but difficult for well completion test because they are characterized by the dependence of pressure, density, velocity, and other flow parameters on both time and space. As for pressure prediction research, there exist empirical formulas, such as those given by Beggs and Brill [1], Mukherjee and Brill [2, 3], and so on. Different researchers such as Hurlburt and Hanratty [4] and Cazarez-Candia and Vásquez-Cruz [5] have proposed mechanistic models, assuming that flow is under steady-state conditions; other researchers such as Taitel et al. [6]; Ouyang and Aziz [7] have proposed unsteady-state gas-liquid two-phase flow models. Fontanilla and Aziz [8] and Ali [9] presented two simultaneous ordinary differential equations for estimating the steam pressure and quality and solved these equations by using the fourth-order Runge-Kutta method. However, those models can only predict the pressure profiles but not the temperature profiles and ignored their interdependence.
Concerning both pressure and temperature in HTHP wells, Wu et al. have presented a coupled system model of differential equations in [10], but this model only considered the single phase flow statement. In this paper, we build a set of coupled partial differential equations of pressure, temperature, density, and velocity in HTHP gas-liquid two-phase flow wells on the base of the model which was build by Xu et al. in [11]. The numerical model, which accords with the actual situation of the well, allows for the change of oblique angle,different heat transfer medium in annular and the depth of the physical properties of the formation.
We found an algorithm solving model with generalized Riemann problem (GRP) scheme, which is an analytic extension of the Godunov scheme in [12] and originally designed by Li and Chen in [13] for the shallow water equations. A direct and simple derivation of the Eulerian generalized Riemann problem scheme is presented to get the integration in time of the conservation laws. Riemann invariants are applied in order to resolve the singularity at the jump discontinuity. The approach has the advantage that the contact discontinuity in each local wave pattern is always fixed with speed zero, while the rarefaction and the shock waves are located on either side. Since the extension of this scheme to multidimensional cases is obtained using the dimensional splitting technique, getting the integration in time of the conservation laws is more direct and simple.
In this paper, we use GRP method for solving this problem and get more accurate prediction of pressure and temperature compared with those obtained from the existing correlations such as LxF method in [11]. The basic data for the calculation are from X well, 7100 m of depth in Southwest China. The curves of the gas pressure and temperature along the depth of the well are plotted. The results can provide a technical reliance for the process of designing well tests in HTHP gas-liquid wells and a dynamic analysis of production from wells.
2. Model Formulation
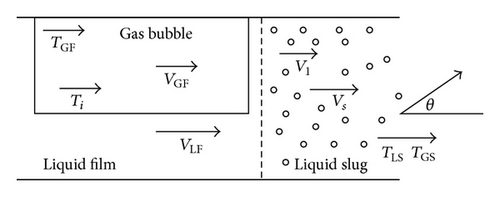
2.1. Mass Balance
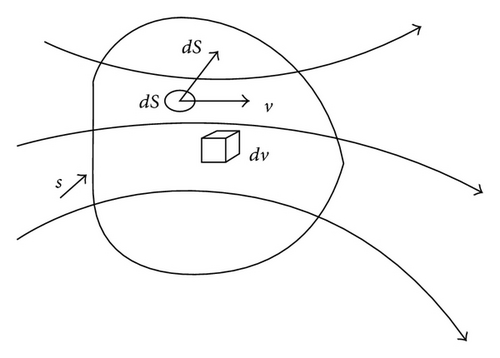
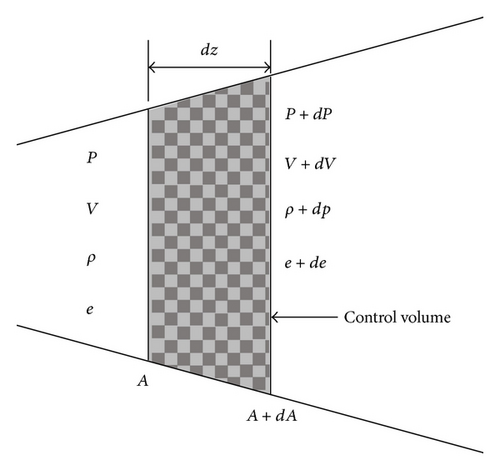
2.2. Momentum Balance
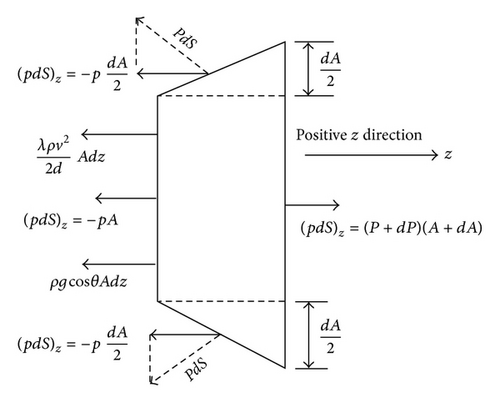
2.3. Energy Balance
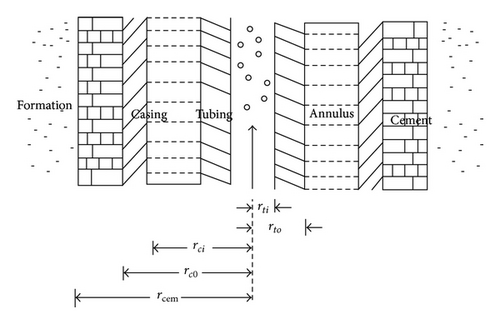
For the transient flow, it leads directly to the energy equation in terms of temperature. As shown in Figure 5, we should consider the heat transmission within wellbore and from wellbore to formation as transient.
3. Format Construction
We assume that the data at time t = tn are piecewise linear with a slopeand we have.
The second-order Godunov scheme for (11) takes the following form: , where is the midpoint value or the value of U at the cell interface (zj+1/2, tn) with accuracy of second order. More specifically, the mid-point valueis computed with the formulas and . Also, is the solution of the Riemann problem centered at (zj+1/2, tn). Moreover, and are the limiting values of initial data U(z, tn) on both sides of (zj+1/2, tn). We present a direct and simple derivation of the Eulerian geralized Riemann problem (GRP) scheme and apply Riemann invariants in order to resolve the singularity at the jump discontinuity.
The local wave configuration is usually piecewise smooth and consists of rarefaction waves, shocks, and contact discontinuities. As the general rarefaction waves are considered, the initial data can be regarded as a perturbation of the Riemann initial data and .
The initial structure of the solution is determined by the associated Riemann solution, denoted by lim t→0U(λt, t) = RA(λ; UL, UR), λ = x/t.
4. Solving Process
Step 1. Set the step length. In this paper,
Step 2. Obtain each point’s inclination:.
Step 3. The in situ liquid volume fraction (holdup) in (1) can be calculated from
Step 4. Calculate the following parameters by Liao and Feng in [15]:
Step 5. For piecewise given initial data, we solve the Riemann problem for (11) to define the Riemann solution, which is the same as the classical Godunov scheme and the Riemann solver in [16] is used in the solution.
Step 6. Determineand evaluate the new cell averages. We apply monotonic algorithm slope limiters to suppress the local oscillations near discontinuities. We use parameter α = 1.9 in, where and .
5. Results and Discussion
In this simulation, we study a pipe in X well located in Sichuan Basin, Southwest China. All the needed parameters are given in [17] as follows: fluid density is 1000 kg/m3; depth of the well is 7100 m; friction coefficient is 1.2; ground temperature is 160°C; ground thermal conductivity parameter is 2.06; ground temperature gradient is 0.0218°C/m. Parameters of pipes are given in Table 1. Inclination, azimuth, and vertical depth are given in Table 2.
| Diameter | Thickness | Weight | Expansion | Coefficient | Young | Modulus |
|---|---|---|---|---|---|---|
| 88.9 | 9.53 | 18.9 | 0.0000115 | 215 | 0.3 | 1400 |
| 88.9 | 7.34 | 15.18 | 0.0000115 | 215 | 0.3 | 750 |
| 88.9 | 6.45 | 13.69 | 0.0000115 | 215 | 0.3 | 4200 |
| 73 | 7.82 | 12.8 | 0.0000115 | 215 | 0.3 | 600 |
| 73 | 5.51 | 9.52 | 0.0000115 | 215 | 0.3 | 150 |
| Number | Measured | Inclination | Azimuth | Vertical depth |
|---|---|---|---|---|
| 1 | 0 | 0 | 120.33 | 0 |
| 2 | 303 | 1.97 | 121.2 | 302.87 |
| 3 | 600 | 1.93 | 120.28 | 599.73 |
| 4 | 899 | 0.75 | 126.57 | 898.59 |
| 5 | 1206 | 1.25 | 124.9 | 1205.45 |
| 6 | 1505 | 1.04 | 124.62 | 1504.32 |
| 7 | 1800 | 0.49 | 123.75 | 1799.18 |
| 8 | 2105 | 2.49 | 125.27 | 2104.04 |
| 9 | 2401 | 1.27 | 123.13 | 2399.91 |
| 10 | 2669 | 2.44 | 120.12 | 2667.79 |
| 11 | 3021 | 0.14 | 127.39 | 3019.63 |
| 12 | 3299 | 1.18 | 122.60 | 3297.50 |
| 13 | 3605 | 2.05 | 123.25 | 3603.36 |
| 14 | 3901 | 0.16 | 121.45 | 3899.22 |
| 15 | 4183 | 2.92 | 121.24 | 4181.09 |
| 16 | 4492 | 2.73 | 129.22 | 4489.95 |
| 17 | 4816.07 | 1.98 | 121.61 | 4813.87 |
| 18 | 5099.07 | 2.74 | 129.93 | 5096.74 |
| 19 | 5394.07 | 0.13 | 120.46 | 5391.61 |
| 20 | 5706.07 | 0.63 | 129.59 | 5703.47 |
| 21 | 5983.07 | 2.09 | 120.14 | 5980.34 |
| 22 | 6302.07 | 2.69 | 122.91 | 6299.19 |
| 23 | 6597.07 | 2.45 | 129.41 | 6594.06 |
| 24 | 6911.12 | 0.15 | 124.88 | 6907.96 |
Through the simulation, we use GRP method to calculate the prediction of pressure and temperature of the oil in the pipe and draw a sensitive analysis for the results. We compare the results of pressure and temperature calculated for the well head at 1200 s by GRP and LxF scheme with the measurement results, which also shows that GRP scheme is more accurate in the real calculation. We obtain series of results contained in tables and figures and analyze these results as follows.
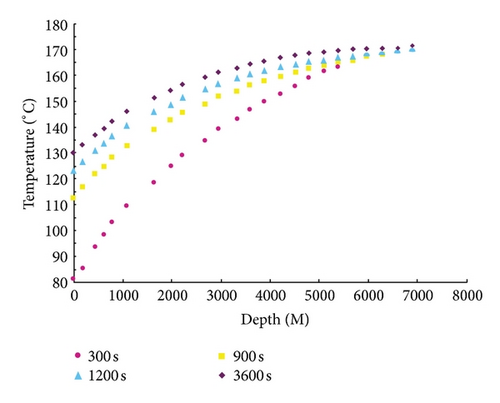
When the bottom pressure is 70 MPa, temperatures are plotted in Figure 6 at different depths and shown in detail in Table 3. When the output keeps constant, the temperature increases with the increasing depth of the well and when the depth fixed, the temperature increases with the increasing time. In addition, it can be seen from the figure that the temperature changes quickly in the early stage but stabilizes over time, especially after 1200 s.
| Depth | Time | |||
|---|---|---|---|---|
| 300 s | 900 s | 1200 s | 3600 s | |
| 0 | 81.22 | 115.29 | 124.19 | 132.27 |
| 300 | 85.45 | 121.38 | 127.55 | 133.34 |
| 600 | 92.67 | 125.54 | 131.76 | 136.56 |
| 900 | 95.54 | 129.48 | 134.96 | 138.87 |
| 1200 | 101.16 | 133.77 | 137.58 | 141.94 |
| 1500 | 106.49 | 136.66 | 140.77 | 143.15 |
| 1800 | 111.76 | 140.67 | 143.23 | 145.17 |
| 2100 | 116.98 | 143.54 | 146.29 | 147.39 |
| 2400 | 121.86 | 145.66 | 148.49 | 149.14 |
| 2700 | 126.89 | 148.45 | 150.78 | 151.93 |
| 3000 | 131.55 | 151.78 | 152.99 | 153.85 |
| 3300 | 136.85 | 153.74 | 154.86 | 155.91 |
| 3600 | 140.88 | 154.02 | 154.46 | 157.87 |
| 3900 | 144.67 | 157.12 | 158.73 | 159.45 |
| 4200 | 148.25 | 159.34 | 160.87 | 161.88 |
| 4500 | 152.74 | 161.53 | 161.65 | 162.65 |
| 4800 | 155.77 | 162.55 | 162.72 | 163.45 |
| 5100 | 159.75 | 163.42 | 163.49 | 164.56 |
| 5400 | 162.36 | 164.56 | 164.87 | 165.24 |
| 5700 | 164.32 | 165.74 | 165.45 | 166.57 |
| 6000 | 166.36 | 166.56 | 167.67 | 167.97 |
| 6300 | 167.91 | 168.77 | 168.87 | 169.65 |
| 6600 | 168.23 | 169.45 | 169.57 | 169.81 |
| 6900 | 170.24 | 170.56 | 171.78 | 171.52 |
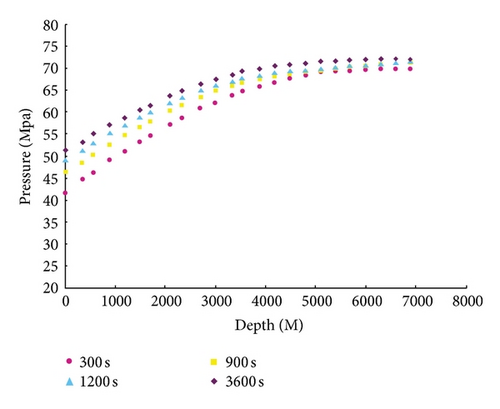
It is established that, when depth is constant, the pressure shown in Figure 7 and Table 4 increased with an increase of the time. When the output keeps constant, the pressure increased with the increasing depth of the well. This is because, with time increasing, the flow increases and then the frictional heat leads to an increase in the pressure. It can also be seen that the pressure changes quickly in the early stage but stabilizes over time.
| Depth | Time | |||
|---|---|---|---|---|
| 300 s | 900 s | 1200 s | 3600 s | |
| 0 | 42.55 | 46.62 | 50.24 | 51.34 |
| 300 | 43.23 | 47.53 | 50.64 | 52.67 |
| 600 | 44.86 | 48.71 | 50.46 | 53.47 |
| 900 | 45.87 | 49.13 | 51.41 | 54.69 |
| 1200 | 46.73 | 50.43 | 52.32 | 54.79 |
| 1500 | 48.46 | 51.24 | 53.36 | 55.53 |
| 1800 | 49.43 | 52.43 | 54.47 | 56.12 |
| 2100 | 50.34 | 53.83 | 55.42 | 57.37 |
| 2400 | 51.96 | 56.92 | 54.37 | 57.85 |
| 2700 | 53.53 | 57.22 | 55.45 | 58.97 |
| 3000 | 54.44 | 58.46 | 56.78 | 59.34 |
| 3300 | 55.24 | 59.97 | 57.47 | 60.95 |
| 3600 | 56.76 | 59.94 | 58.95 | 61.22 |
| 3900 | 57.33 | 60.98 | 59.04 | 62.29 |
| 4200 | 58.93 | 61.22 | 60.29 | 63.33 |
| 4500 | 59.34 | 62.45 | 61.24 | 64.48 |
| 4800 | 60.89 | 63.43 | 62.23 | 64.33 |
| 5100 | 61.56 | 64.19 | 63.22 | 64.78 |
| 5400 | 63.35 | 65.24 | 64.18 | 65.34 |
| 5700 | 64.69 | 65.45 | 65.12 | 66.34 |
| 6000 | 65.45 | 66.79 | 66.15 | 67.56 |
| 6300 | 66.99 | 67.49 | 67.11 | 67.47 |
| 6600 | 67.46 | 68.52 | 68.22 | 68.58 |
| 6900 | 69.28 | 69.46 | 69.92 | 69.55 |
As shown in Table 5, for the comparative results of the well head temperature at 1200 s, the relative error between the calculation results and the measurement results of GRP scheme method is 5.12% and by LxF method is 6.70%, while the relative error between the results in pressure predition at the same time calculated by GRP scheme method is 8.81% and by LxF method is 9.73%, which shows that the distribution prediction of the two-phase flow is more accurate in actual calculation by GRP scheme method.
| Well-head | Temperature | Pressure |
|---|---|---|
| Measurement results | 180.65 | 76.10 |
| Results by GRP method (relative error) | 171.78 (5.12%) | 69.92 (8.81%) |
| Results by LxF method (relative error) | 169.30 (6.70%) | 69.36 (9.73%) |
6. Conclusion
In this paper, considering the variation of pressure, temperature, velocity; and density at different times and depths in gas-liquid two-phase flow, we present a system model of partial differential equations according to mass, momentum, and energy. We establish an algorithm solving model with a new difference method with a direct Eulerian GRP scheme which is proven to be efficient for the numerical implementation in this paper. The basic data of the X well (HTHP well), 7100 m deep in Sichuan Basin, Southwest China, was used for case history calculations, and a sensitivity analysis is completed for the model. The gas-liquid’s pressure and temperature curves along the depth of the well are plotted, and the curves intuitively reflect the flow law and the characteristics of heat transfer in formation. The results can provide the technical reliance for the process of designing well tests in high temperature-high pressure gas-liquid two-phase flow wells and dynamic analysis of production. Furthermore, the works in this paper can raise safety and reliability of deep completion test and will yield notable economic and social benefits and avoid or lessen accidents caused by improper technical design.
Nomenclature
-
- A:
-
- A total length of conduit (m2)
-
- CJ:
-
- Joule-Thompson coefficient (K/pa)
-
- Cp:
-
- Heat capacity (J/kg·K)
-
- D:
-
- A hydraulic diameter (m)
-
- G:
-
- Acceleration constant of gravity (m/s2)
-
- Ke:
-
- Formation conductivity (J/m·K)
-
- P:
-
- Pressure (KPa)
-
- rD:
-
- Dimensionless radius
-
- rto:
-
- Outer radius of conduit (m)
-
- T:
-
- Temperature (K)
-
- tD:
-
- Dimensionless time
-
- Te:
-
- Temperature of the stratum (K)
-
- Twb:
-
- Wellbore temperature (K)
-
- TwbD:
-
- Dimensionless wellbore temperature (K)
-
- Tr:
-
- Temperature of the second surface (K)
-
- Tei:
-
- Initial temperature of formation (K)
-
- Uto:
-
- Overall-heat-transfer coefficient (W/m·K)
-
- V:
-
- Velocity (m/s)
-
- Z:
-
- A total length of conduit (m)
-
- z:
-
- The distance coordinate in the direction along the conduit
-
- hc:
-
- Heat transfer coefficient for natural convection based on outside tubing surface and the temperature difference between outside tubing and inside casing surface
-
- hr:
-
- Heat transfer coefficient for radiation based on the outside tubing surface and the temperature difference between the outside tubing and inside casing surface
-
- Kcas:
-
- Thermal conductivity of the casing material at the average casing temperature
-
- Kcem:
-
- Thermal conductivity of the cement at the average cement temperature and pressure
-
- λ:
-
- The friction coefficient, dimensionless
-
- γg:
-
- Euler constant 1.781
-
- ρ:
-
- Density (kg/m3)
-
- θ:
-
- Inclination angle flow conduit.
Conflict of Interests
The authors declare that there is no conflict of interests regarding the publication of this paper.
Acknowledgments
This research was supported by the Key Program of NSFC (Grant no. 70831005) and the Key Project of China Petroleum and Chemical Corporation (Grant no. GJ-73-0706).


