Observation and Modeling of Optical Emission Patterns and Their Transitions in a Penning Discharge
Abstract
A Penning discharge tube has been used as the excitation source for optical detection of gaseous species concentrations in a neutral gas. This type of diagnostic has been primarily used in magnetic fusion energy experiments for the detection of minority species in the effluent gas (e.g., for helium detection in a deuterium background). Recent innovations (US Patent no. 6351131, granted February 26, 2002) have allowed for extension of the operation range from <1 Pa to as high as 100 Pa and possibly beyond. This is done by dynamically varying the gauge magnetic field and voltage to keep the optical signals nearly constant (or at least away from a nonlinear dependence on the pressure). However, there are limitations to this approach, because the Penning discharge can manifest itself in a number of modes, each exhibiting a different spatial emission pattern. As a result, varying the discharge parameters can cause the gauge to undergo transitions between these modes, disrupting any intended monotonic dependence of the overall emission on the varied parameter and hence any predicable impact on the emission. This paper discusses some of the modes observed experimentally using video imaging of the discharge. It also presents a first successful application, a particle-in-cell (PIC) code, to simulate these modes and a mode transition. The hope is that a good understanding of the physics involved in the mode transitions may allow for methods of either avoiding or suppressing such transitions. This would aid in broadening the use of this plasma-based sensor technology.
1. Introduction
The species-selective Penning gauge (SPG) is a sensor that uses the gaseous electric discharge inside a Penning gauge tube to excite optical emission from the gaseous species. Analysis of the optical emission leads to the detection of the species and a measure of their relative concentrations (Figure 1). As such, this sensor has been most extensively used in magnetic fusion energy (MFE) experiments to measure the concentration of helium in the mainly hydrogen and/or deuterium effluent of fusion devices [1–3]. The ability of a particle removal scheme to preferentially remove helium (the ash in a burning fusion reactor) is an important design issue for pumped limiters and divertors.
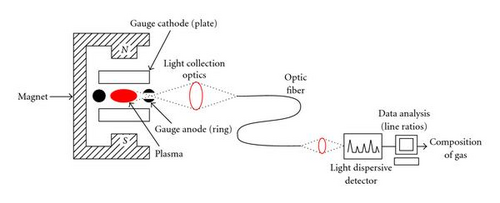
One of the limitations of the SPG, as developed in the MFE research community, has been the inability to handle pressures above about 1 Pa (~7 mTorr). In fact, significant nonlinear effects in the dependence of line emission on partial pressure have been seen as the total pressure approaches this limit. Above that, spatial mode transitions would be observed in the optical emission pattern of the plasma discharge. These effects have, in general, not been understood and they have been avoided by keeping the total gas pressure in the gauge low by means of differential pumping.
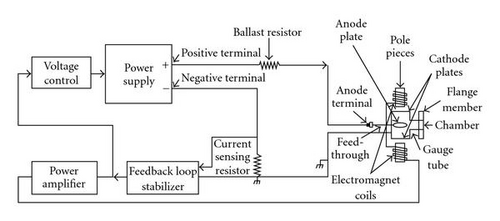
A more recent diagnostic development innovation, which combines feedback control of both the voltage and the magnetic field of the gauge to keep the gauge current nearly constant, independent of the total pressure (Figure 2), has been shown to reduce nonlinearity with limited success. For example, in cases with He minority concentration in a hydrogen (or deuterium) working gas, the region of linearity could be extended by nearly an order of magnitude [4]. However, transitions between what would appear to be different plasma discharge modes (i.e., the above-mentioned emission pattern transitions) have complicated the further development of this diagnostic. The work described in this paper was driven by an interest in the development of physical and computational models that might predict the optical emission pattern, based on the discharge parameters, as well as the transitions between patterns. One could envision a “smart” feedback control system, which automatically “steers” the operation of the gauge clear of the transition points or boundaries on the IV-plane. Such a complex “expert system” would be much easier built on a physical model than as a result of statistical studies.
Even though the magnetic confinement of electrons in a Penning gauge allows for a higher degree of ionization than in a glow discharge, the ionization is still much below 1% for pressures of interest (~0.1–100 mTorr, with the highest electron densities not exceeding 1 × 1011cm−3). Therefore, neutrals and their interactions with the plasma are very important. It was in part for this reason that the particle-in-cell (PIC) code XOOPIC was chosen for this work. The code includes a Monte-Carlo collision model for the neutrals. This paper includes a brief description of XOOPIC and the way it was configured for the problem at hand. Observations of the emission patterns using a video (CCD-type) camera in place of the collection optics in Figure 1 are also presented. Finally, it is shown that a transition from one pattern to another can be successfully modeled with XOOPIC and, thus, this or a similar model can be a powerful tool in the further development of this plasma-based sensor technology.
2. Experimental Setup
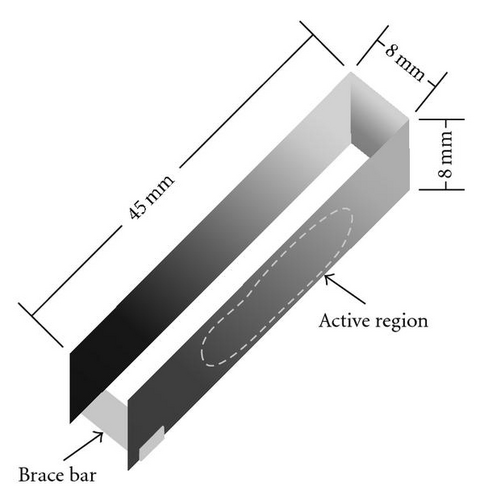
For this work, specially designed gauge tubes were fabricated to give more flexibility and greater optical access of the discharge. Separate electronics, including a KEPCO programmable current amplifier and specially made circuitry, were used for the feedback control of Figure 2. As with most commercial Penning gauges, our tubes are designed with the cathode at the same potential as the tube′s envelope, which is typically the same as the ground potential. The anode is then biased positive with respect to ground. Unlike the “zero-profile” anodes found in commercial tubes (usually consisting of a wire loop), our anode was designed to span most of the gap between the cathode plates, leaving minimal (about 1.5 mm) air gaps to prevent shorting to the cathode. Additionally, by using a rectangular cross-section perpendicular to the electron-confining magnetic field, it was possible to provide an opening in the anode for full visual access of the plasma and its light emission, while keeping this opening away from the plasma. Figure 3 is a 3D rendition of the anode electrode, which is fabricated from thin, nonmagnetic stainless steel stock. The white dashed lines on one side of the anode is a rough indication of a projection of the plasma region onto that surface, intended to define the region of the intra-electrode space that appeared to be occupied by the plasma discharge.
A CCD-type video camera was set up in place of the spectroscopy collection optics of Figure 1 and viewing in the same direction. While recording current-versus-voltage (I-V) characteristic curves for various gas pressures, the camera was used to document the emission patterns and their transitions. Since the camera was not intensified, and it was important to document even the faintest patterns, wavelength-selective filters were not used. All visible light was collected (with typical CCD spectral response).
2.1. Observations of Emission Patterns and Their Transitions
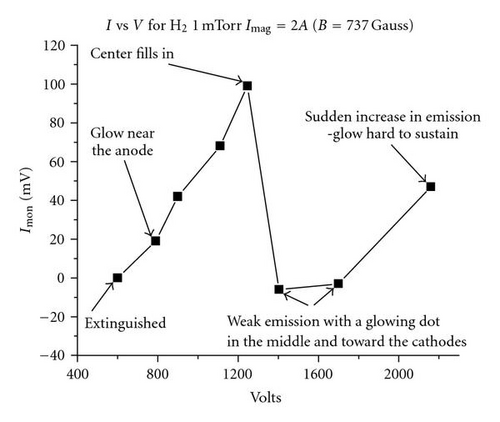
Mode transitions were found to be universal, in the sense that they appeared in current-versus-voltage (I-V) characteristics for any Penning tube geometry and at any working gas pressure. Figure 4 shows a typical I-V characteristic showing a number of mode transitions. The signal Imon is proportional to the current (output of a noncalibrated current sensor). Descriptions of the types of spatial modes (or, more precisely, distributions of the plasma emission), as observed visually, are noted in the graph for some of the data points. These data are all at 1mTorr hydrogen with the current in the electromagnet fixed at 2A, which produced a 737-Gauss magnetic field in the plasma discharge region of the gauge. At a different magnetic field or pressure, this I-V characteristic can be quite different.
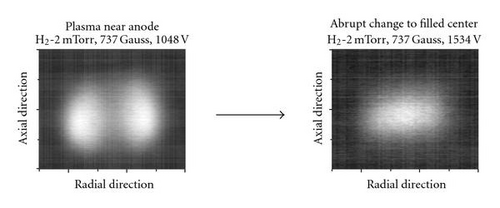
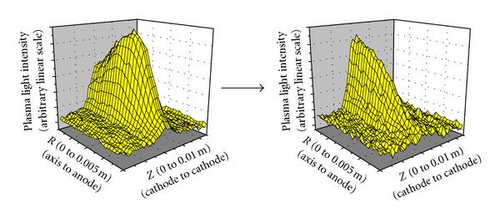
To test the ability of the XOOPIC model to simulate the occurrence of transitions between spatial modes of the Penning discharge, a number of cases were run, in which only the voltage of the gauge was varied, while the background pressure and the magnetic field were kept constant. In one set of such studies, hydrogen was used as the working gas at low pressure, because a substantial transition had been observed and well documented for this case. Figure 5 shows CCD images of the Penning discharge on two sides of a spatial mode transition as the voltage is changed from 1048 V (left image) to 1534V (right image) at fixed magnetic field in 2 mTorr (~0.3 Pa) H2 discharge. One very clearly sees in these images the change from plasma that is donut-like in shape to a plasma that is highly concentrated near the center of the tube (in both cases, the plasma is centered vertically with respect to the cathode plates, which are near the top and bottom edges of the images). Figure 6 shows plots of the plasma emission light intensity distribution from the CCD images of Figure 5 as a function of R and Z. Note that these data represent integrated emission profiles along the view of the camera, which is similar to the view of the spectroscopy collection optics of Figure 1.
2.2. XOOPIC and Its Application to the Penning Gauge
Before discussing numerical simulation, it is interesting to note that theoretical work on the operation of the Penning gauge is very limited in the literature. However, the physics of the Penning discharge is akin to that of the magnetron discharge. The same crossed electric field/magnetic field-induced “magnetron motion” confines the electrons and enhances the ionization within the desired region. A significant amount of work on the physics of the magnetron discharge can be found in the literature in the 1960s and 1970s, driven by the combined commercial interest in magnetrons for microwave power generation and for sputter deposition of thin films [5–7]. Especially driven by the great potential for applications in thin film deposition for the microelectronics industry, a surge of experimental activity in the study of magnetron plasmas appears in the 1980s [8–10]. This then led to theoretical interpretation based on numerical modeling of these experimental results, with most of the work done in the 1990s, [e.g., [11, 12]]. Although the significant difference in the geometry makes it difficult to extrapolate results from the magnetron to the Penning, a good intuition can be developed from the existing work. This intuition led to the development of the feedback control process mentioned in the introduction. As mentioned, however, the appearance of spatial mode transitions limited the success of the feedback process and this motivated the investigation of XOOPIC as a possible modeling tool to help get beyond intuition in the further development of the sensor.
XOOPIC [13] is a two-dimensional particle-in-cell (PIC) code that operates in x-y and r-z coordinates. It is capable of simulating the electrostatic limit, as well as the fully electromagnetic Maxwell equations. XOOPIC can simulate interaction of charged particles with a background gas using a Monte-Carlo collision (MCC) model. The code can model fully relativistic particles, general magnetic fields, and a wide variety of boundary conditions for both particles and fields. It includes the capability to model arbitrary configurations of boundaries, including internal boundaries, each with general properties such as secondary emission or time-dependent voltage, and each capable of measuring particle statistics such as impact energy and angle in addition to currents.
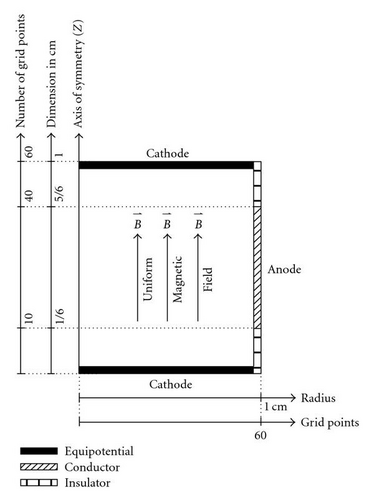
The Penning gauge geometry was set up for XOOPIC as shown in Figure 7. The code allows for planar or cylindrical geometry. Naturally, a cylindrical geometry is chosen for the Penning tube. The magnetic field can be entered either as a uniform constant field or as an input file containing a distribution over the grid used in the calculation. The small physical size of the gauge allowed for a conveniently small grid. The grid is selected carefully so the Debye length (λD), is larger, on average, than the grid spacing (average electron energies are in the range of 100–200 eV), while maintaining enough particles per cell for good statistics while still retaining practical run times on a PC.
The code was run on a 1 GHz Pentium PC running Linux. With a typical plasma density of mid-109cm−3, the total number of “particles” was still in the mid-105 range. Here “particles” actually refer to the “super-particles” used in PIC codes to represent a large group of actual plasma ions or electrons. A simulation typically takes 2-3 days to run on the PC.
2.3. PIC Modeling of Mode Transitions
As mentioned, Figure 6 shows the intensity (mostly emission from the hydrogen Balmer-alpha line at 6563 Å) distribution as a function of radius and vertical position between the cathode plates. It is interesting to display the data in this fashion, because then one can attempt to compare with similar 3D plots of the electron density and other plasma parameters, as one finds in the standard output of the XOOPIC run. Such plots of the electron density are shown in Figure 8 for two extreme cases for the voltage, at fixed magnetic field and low hydrogen pressure.
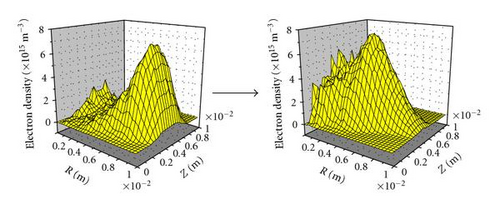
The assumption is that the light emission is proportional to the electron density, since it is mainly the electrons in the discharge that excite the atomic transitions, which in turn produce the emission. However, the electron energy distribution function may also vary spatially, and will strongly influence the excitation profile. Of course, other factors, such as charge-exchange between neutral atoms and plasma ions can also contribute to the distribution of the emission and cause it to be different from that of the electron density (e.g., by resulting in deexcitation of atomic states involved in the line emission process). Since the pixels of the CCD camera are actually integrating the light along their line of sight in an optically thin medium, the same operation is carried out numerically on the density profiles of Figure 8 to allow for direct comparison. The resulting line-integrated densities, shown in Figure 9, qualitatively show the same transition in the light emission pattern seen in the CCD data of Figure 6.
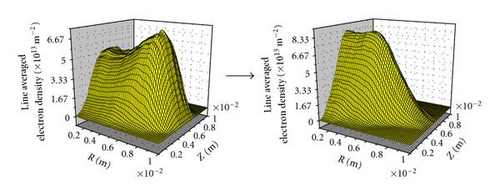
Clearly, the match is not perfect, nor expected to be (since the density is not the only factor in the emission intensity, as explained above, and the geometry of the Penning tube in the model only approximates that of the actual tube used in the experiment). However, it is clear from these results that the gross features of the light emission distribution, which is what has been denoted as a spatial mode in the preceding discussion, and the transition to different distributions or modes, can in fact be simulated by a numerical code like XOOPIC.
To make use of this new capability to simulate the behavior of the Penning discharge, it is also necessary to understand what specific processes in the simulation might cause the effects, such as the mode transitions. This work has only now begun and a complete understanding will require additional simulation runs. However, some ideas have arisen from trends seen in the various standard output diagnostics of XOOPIC. These give a direction to be pursued in the follow-on study.
One potential effect to investigate in the mode transition described here might be changes in the magnetic sheath. If we assume the plasma is fairly conductive so that most of the voltage drop is radial, then we expect a strong azimuthal motion due to E × B forces. For dense plasma, a thin layer might shield most of the radial field, so that electrons in the inner radii see little field and hence attain a temperature insufficient for ionization.
It is noted that as the voltage in the simulation goes from 800 to 2500 V, the Debye length (λDe) should double from 5 mm to nearly 1 cm if the full voltage is available, according to , where n is the electron density. Similarly, the (electron cyclotron motion) gyroradius (rce) should double from 2.5 mm to 5 mm, according to . These numbers indicate that both the gyroradius and the Debye length are comparable to the system size, so the changes in these parameters may be significantly contributing to the observed modal changes.
One of the standard diagnostic outputs of the simulation code is the azimuthal velocity as a function of the radius. Comparing the two cases in Figure 10, it is found that the velocity distribution shifts toward the smaller radii at the higher voltage. It is noted that the magnitude of these velocities (peak values of 1.5 × 10⁷ and 2.8 × 10⁷ m/s, for low- and high-field cases, resp.) are large compared to thermal velocities (for typical ≤~10 eV thermal electrons, average velocities are ≤~0.1 × 10⁷ m/s). These azimuthal velocities are caused by the E × B drift and correspond to energies that can contribute substantially to the excitation and ionization of neutral species. Consequently, the plasma light emission profile is a convolution of the E × B rotation and the electron density. At the lower voltage, the E × B rotation is clearly reduced in the central region of the gauge. Since the magnetic field is specified in this model, and there is no diamagnetic current in the electrostatic limit, this implies that the radial electric field must be shielded at the small radii for the low-voltage case. (By taking dne/dr at the steepest density gradient region of the low-V case, where ne ≈ 4 × 10¹⁵ m−3, an upper limit for the diamagnetic current |c · B × ∇p/B2 | ≈(ckT/B) · dne/dr can be obtained. It corresponds, after dividing by e · ne, to a velocity of about 1 × 10⁵ m/s, which is two orders of magnitude below the average E × B velocity. This indicates that the diamagnetic effect can be safely ignored.) The shift of the peak density toward the axis of symmetry of the gauge is consistent with a reduction of the screening of the electric field at the higher voltage, and therefore with the increased azimuthal motion at the smaller radii.
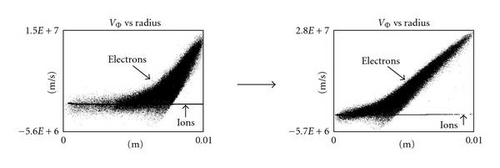
It is also noted that relative lifetime (or residence time in the Penning trap) of the electrons and ions can determine the penetration (or thickness) of the sheath, and consequently the fields. (It is noted that even the sign of the field can change as the electron-ion balance is changed.) The evidence indicates that the low-voltage case has losses high enough that it does not form the typical diffusive profile (Bessel function), but is instead hollow, possibly indicating a lower or localized ionization rate or reduced diffusion. Since the primary source of light emission is likely to be excited by energetic electrons produced by the E × B drift, then the modeled changes in the azimuthal velocity distribution are consistent with this picture.
3. Summary and Conclusions
Spatial mode transitions are manifested in drastic changes in the plasma light emission pattern in the gauge tube. Such transitions are deleterious to the operation of the gauge as a gas species concentration sensor, especially over large gas pressure ranges. A plasma simulation study using XOOPIC has shown that this code can indeed simulate, at least qualitatively, the occurrence of such transitions. With a reasonably working setup for the Penning discharge, the code can already be run on a desktop PC with convergence times that are increasingly practical in an industrial product development setting. It is therefore a potential tool for improvement of the sensor for specific applications, which can include greenhouse gas emission monitoring in plasma processing of semiconductors.
Acknowledgments
This research was sponsored in part by the US Department of Energy under contract no. DE-FG02-98ER82592-A001 (Phase II SBIR) with HY-Tech Research Corporation. This paper is based on material presented by the authors in a poster session (PS5 + MS) of the AVS 49th International Symposium, Denver, Colorado, November 4–8, 2002.


