The potential link between gas diffusion and embolism spread in angiosperm xylem: Evidence from flow-centrifuge experiments and modelling
Abstract
Understanding xylem embolism formation is challenging due to dynamic changes and multiphase interactions in conduits. Here, we hypothesise that embolism spread involves gas diffusion in xylem, and is affected by time. We measured hydraulic conductivity (Kh) in flow-centrifuge experiments over 1 h at a given pressure and temperature for stem samples of three angiosperm species. Temporal changes in Kh at 5, 22, and 35°C, and at various pressures were compared to modelled gas concentration changes in a recently embolised vessel in the centre of a centrifuge sample. Temporal changes in Kh were logarithmic and species-specific. Maximum relative increases of Kh between 6% and 40% happened at 22°C for low centrifugal speed (<3250 RPM), while maximum decreases between 41% and 61% occurred at higher speeds. These reductions in Kh were experimentally shown to be associated with a temporal increase of embolism at the centre of centrifuge samples, which was likely associated with gas concentration increases in recently embolized vessels. Although embolism is mostly pressure-driven, our experimental and modelled data indicate that time, conduit characteristics, and temperature are involved due to their potential role in gas diffusion. Gas diffusion, however, does not seem to cover the entire process of embolism spread.
Abbreviations
-
- Crelative
-
- Relative modelled gas concentration in a recently embolised vessel
-
- K0’
-
- Hydraulic conductivity before flushing a stem segment
-
- K0
-
- Initial hydraulic conductivity
-
- KF’
-
- Hydraulic conductivity after flushing a stem segment
-
- Kh
-
- Current hydraulic conductivity
-
- Kmin
-
- Minimum hydraulic conductivity
-
- Krelative
-
- Relative hydraulic conductivity
-
- PLC
-
- Percentage Loss of Conductivity
-
- R
-
- Pearson correlation coefficient
-
- RMSE
-
- root mean squared error
-
- ΔKh
-
- Relative change in hydraulic conductivity
-
- Ψ
-
- Minimum xylem water potential in the middle of a stem segment.
1 INTRODUCTION
During drought stress, the pressure of xylem sap can become negative enough to allow a local phase change from liquid to water vapour (Tyree & Zimmermann, 2002). If this phase change takes place, the water vapour, which becomes gradually mixed with gas, fills the entire water-conducting conduit and blocks the water transport by a process known as embolism (Hölttä et al., 2002; Wang et al., 2015b). There is growing evidence that embolism formation can be induced in sap-filled conduits that are directly connected to an embolised vessel via a joint interconduit wall (Brodersen & McElrone, 2013; Choat et al., 2016; Guan et al., 2021; Knipfer et al., 2015; Skelton et al., 2017). Although embolism formation in xylem conduits has been given considerable research attention, we lack a mechanistic understanding of how exactly embolism is formed, and how it propagates between vessels (Jansen & Schenk, 2015; Lens et al., 2022; Levionnois et al., 2020; Lintunen et al., 2022). It is known that bordered pits in interconduit walls play a major role in transport of liquids and gasses across conduits (Kaack et al., 2019, 2021; Park et al., 2019; Zhang et al., 2020), but there is a knowledge gap in predicting embolism resistance based on pit membrane characteristics and relevant physical parameters.
The mechanism behind embolism formation has traditionally been described as ‘air-seeding’, and the Young–Laplace equation has been used to predict the pressure difference that a gas bubble would require to penetrate a pore in a pit membrane by mass flow and then induce embolism (Tyree & Zimmermann, 2002). However, applying the Young–Laplace equation presents practical challenges when dealing with the complex gas-liquid interfaces and dynamic surface tension inside a three-dimensional pit membrane, which shows multiple pore constrictions in each pore pathway (Kaack et al., 2021; Yang et al., 2020). Embolism formation seems to be largely a pressure-driven process, with more negative pressure of xylem sap increasing the likelihood of embolism (Jansen & Schenk, 2015; Lens et al., 2022; Levionnois et al., 2020; Lintunen et al., 2022). However, there is evidence suggesting that embolism formation may not only be pressure-driven but also depends on the proximity to a gas source and local changes in gas pressure and gas concentration (Avila et al., 2022a; Choat et al., 2010; Guan et al., 2021; Torres-Ruiz et al., 2015).
The level of xylem embolism can be indirectly quantified by measuring the reduction of the hydraulic conductivity (Kh) when a xylem sample is submitted to a decreasing xylem water potential (Sperry, 1985). Although centrifuge methods have been employed to construct vulnerability curves in many studies (Cochard et al., 2013), it remains unclear how exactly embolism inside a centrifuge sample is generated, how vessel dimensions may affect embolism formation, and where embolism in stem segments is formed (Cai & Hacke, Zhang, et al., 2010). Different interpretations have been given to data obtained from centrifuge experiments with samples that have cut-open vessels longer than the actual sample, and to vulnerability curves generated with a flow-centrifuge and static-centrifuge (Choat et al., 2010; Jacobsen & Pratt, 2012; Lamarque et al., 2018; Sperry et al., 2012; Yin et al., 2019). Although Alder et al. (1997) did not find an effect on the loss of conductivity when varying the spin time from 3 to 60 min in a static-centrifuge, this issue requires more in-depth experiments.
Any hydraulic measurement is affected by temperature as it has an impact on conductance, modifying considerably the liquid viscosity, and also the cell membrane fluidity and permeability for symplastic transport (Burlett et al., 2022a; Cochard et al., 2000; Wang et al., 2014). Moreover, temperature has an influence on the gas solubility, and thus on the concentration of dissolved gas in xylem sap (Weiss, 1970). A potential link between the amount of gas dissolved in xylem sap and embolism formation has been suggested (Guan et al., 2021), but remains largely untested. If changes in the concentration of dissolved and undissolved gas are associated with embolism formation, embolism propagation may be dynamic because gas diffusion in xylem can be relatively slow, from seconds to many hours (Sorz & Hietz, 2006; Yang et al., 2023). Thus, based on this assumption, it would be reasonable to expect that both time and temperature affect embolism formation in flow-centrifuge experiments. Interestingly, Wang et al. (2014) reported the challenge of predicting Kh using linear regression at the end of a vulnerability curve, suggesting that ‘new embolism may have been occurring during the process’ (i.e., during the spin time in a flow-centrifuge at a fixed speed). Also, Kh measurements over long time periods (hours) have been reported to show a constantly decreasing trend, which has been explained by clogging or coating of intervessel pit membranes, wounding response, or another unknown phenomenon (De Baerdemaeker et al., 2019; Espino & Schenk, 2011). Therefore, it is important to test if any decline in Kh over time is caused by embolism propagation, related to a change in temperature, and/or caused by any other unknown aspect.
Moreover, there is rather contradictory information in literature about the distribution of embolised vessels along the axis of centrifuged samples (Table S1). While some studies have shown that the highest level of embolism occurs in the centre (Cai et al., 2010; Sperry et al., 2012; Tobin et al., 2013), others have reported that embolism occurred mainly near the sample ends (Cochard et al., 2010; Martin-StPaul et al., 2014; Yin et al., 2019). Theoretically, the most negative pressure occurs at the centre of the rotor, with the pressure increasing along the axis towards the outer sides of the sample (Alder et al., 1997; Cai & Tyree, 2010; Cai et al., 2010). Therefore, the amount of embolism formed in the stem should be proportional to the pressure that is applied to the centre (Cochard et al., 2010; Yin et al., 2019). Other researchers observed that the highest embolism levels occur at the water injection side of samples in a flow-centrifuge (López et al., 2018; Martin-StPaul et al., 2014; Yin et al., 2019). It has been suggested that tiny bubbles could enter cut-open conduits at stem ends, causing local embolism and therefore a gradient in loss of conductivity along a sample, with the greatest loss of conductivity at the basal and upstream part of centrifuge samples (Yin et al., 2019). There is also evidence suggesting that vessel dimensions play a role in embolism formation in a flow-centrifuge, with artificial embolism formation in conduits that are completely cut-open at stem ends (Lamarque et al., 2018). Although we do not fully understand the relationship between vessel dimensions and vulnerability to embolism in plants (Lens et al., 2022), vessel dimensions play a role in the movement of gas between vessels (Avila et al., 2022b; Salomón et al., 2021; Yang et al., 2023). It has been suggested that plant species with small vessel volumes may experience faster embolism spread compared to those with larger vessel volumes (Pereira et al., 2023). Therefore, vessel dimensions may affect embolism location in a sample used for flow-centrifuge experiments.
This study aims to elucidate fundamental mechanisms behind embolism propagation. In particular, we hypothesise that if gas movement between conduits is relatively slow and related to embolism formation and propagation, there would be a considerable time effect on Kh measurements for a constant centrifugal speed and temperature. This time effect may also affect temporal changes in embolism location in flow-centrifuge experiments. By modelling how time, temperature and vessel dimensions affect gas movement and gas solubility, we expect that there is a correlation between the gas concentration in a recently embolised water vapour-filled vessel and the loss of Kh of xylem. Finally, we speculate that vessel dimensions affect the speed of gas movement in stem xylem, and therefore the rate and location of embolism in samples that are subject to spinning in a flow-centrifuge.
2 MATERIAL AND METHODS
2.1 Plant material and site information
The temperate angiosperm tree species Corylus avellana, Fagus sylvatica and Prunus avium were selected. These are common trees at Ulm University (Germany, 48°25ʹ20.3ʹʹ N, 9°57ʹ20.2ʹʹ E).
2.2 Measurements of hydraulic conductivity
Flow-centrifuge measurements were performed with a ChinaTron centrifuge (Model H2100R, Cence Company, Xiangyi, China) with control of the rotational speed and temperature. The ChinaTron flow-centrifuge used had a thermostat temperature sensor near the rotor and a reversing valve, ensuring precise temperature control within ±0.1°C (Wang et al., 2014). Software designed by Wang et al. (2014) estimated the stem temperature based on a thermostat sensor, and maintained a constant target temperature throughout the spinning process, with the stem temperature increasing by only 0.76°C due centrifuge acceleration (data not shown). This software also recorded centrifuge rotational speed, calculated the minimum xylem water potential in the middle of a stem segment (Ψ), and recorded with a highspeed camera (scA640-120gm, Basler, Ahrensburg, Germany) changes in the position of the menisci over time, which allowed us to estimate Kh based on Alder et al. (1997). Ψ varied according to the rotational speed and was estimated based on Holbrook et al. (1995). To ensure a more precise representation of Ψ values across different temperatures, the water density was corrected according to Jones & Harris (1992).
2.3 Sample preparation
Samples measuring at least 80 cm, a length significantly exceeding the maximum vessel length of the species studied (Table S4; Guan et al., 2022), were collected around 9:00 AM. To avoid embolism formation by cutting branches with xylem sap under considerable negative pressure (Guan et al., 2021; Torres-Ruiz et al., 2015; Wheeler et al., 2013), long branch samples were first cut in air and immediately placed in a water-filled bucket. Then, the samples were transferred to the lab within 10 min, where ∼10 cm at the stem base was cut off underwater. Based on the maximum vessel lengths of the species studied (Table S4), 10 cm exceeds the minimal cut length necessary for rehydration according to Torres-Ruiz et al. (2015), and thus prevented artificial embolism induction. The ca. 70 cm long samples were then kept in water for more than 2 h to fully rehydrate.
After sample rehydration, side branches were removed, and the excised sites were tightly wrapped up with parafilm to prevent gas entry. The samples were then recut underwater to a final length of 27.4 cm (Torres-Ruiz et al., 2015). To fit the sample in the ChinaTron rotor, we selected a plant segment with a diameter (excluding the bark) of 6 ± 2 mm. Then, the stem segment ends were trimmed and the bark was removed with a sharp razor blade. The stem segments were mounted in the centrifuge rotor with their ends in cuvettes. Flow-centrifuge measurements were performed with a solution prepared with deionized water containing 10 mM KCl and 1 mM CaCl2 (Burlett et al., 2022b), which was injected with a peristaltic pump (Model PP 2201, VWR International bvba, Leuven, Belgium) into the cuvettes to measure Kh. Since xylem sap in plants is typically saturated or even oversaturated with gas (Marion et al., 2024; Schenk et al., 2016), we did not degas the injection solution.
2.3.1 Experiment 1: Continuous versus noncontinuous flow in hydraulic measurements over a long spin time
When conducting Kh measurements with a flow-centrifuge, a standard solution is only injected when measurements are taken (Cochard et al., 2005). Consequently, flow across the sample only occurs after injection of solution into the upstream cuvette. Considering this, we assessed the effect of solution injection on flow-centrifuge measurements of Kh, testing if a decline in Kh over time is caused by embolism propagation only, and not by other factors such as pit membrane clogging or wound response. To distinguish actual embolism propagation from a temporal decline of Kh that is not driven by embolism, we subjected two samples of C. avellana to two spinning conditions: (1) continuous addition of the injection solution to the cuvettes, so that we maintained an uninterrupted flow across the centrifuge sample, and (2) no continuous addition of the solution (i.e., noncontinuous flow), and thus no flow between Kh measurements. For continuous flow, the solution was injected in the cuvette continuously, keeping the menisci of the cuvette in movement, which means that a non-stop flow throughout the sample was applied. For noncontinuous flow, the solution was injected only when we took a measurement. Kh was assessed every 30 min for 8 h at 22°C. The rotational speed of 3800 RPM was applied (Ψ = −1.27 MPa), which caused less than 12% of embolism according to Guan et al. (2022).
2.3.2 Experiment 2: The effect of water potential, time and temperature on xylem embolism propagation
To uncouple the effect of time, temperature, and Ψ on Kh measurements, we collected 17 samples from C. avellana, 17 samples from P. avium, and 16 samples from F. sylvatica for flow-centrifuge experiments. We applied a given rotational speed and temperature to each sample, and took Kh measurements over the duration of 1 h. Thus, one treatment consisted of a single sample that was spun in the centrifuge under a fixed speed and temperature. The experiment was repeated at three different temperatures (5°C, 22°C, and 35°C), with various rotational speeds as described in Table S2, along with their respective water potentials.
For 5° and 35°C, the solution was manually injected into the cuvettes with a syringe. Before injection, the syringes were stored in a freezer or in a water bath, which were at 5°C and 35°C, respectively. Room temperature in the lab was 22°C. The temperature of the centrifuge solution was checked with an electronic thermometer (16200, Bioblock Scientific, Illkirch, France).
For 22°C, we applied different rotational speeds, namely eight for F. sylvatica, and nine for C. avellana, and P. avium. The speed values selected allowed us to link embolism propagation over time with different levels of initial embolism (Table S2). The two highest and lowest rotational speeds applied at 22°C were also used for measurements at 5° and 35°C (Table S2). Overall, the highest rotational speeds varied according to the species, and were selected based on vulnerability curves previously conducted on samples from the same species by Guan et al. (2022).
Kh was measured several times over 1 h. The time interval between consecutive measurements increased with spin time: every 20 s during the first 15 min of spinning, every minute during the next 15 min, and every 5 min during the next 15 min. A final measurement was taken when the sample had been spinning for 60 min.
2.3.3 Experiment 3: Location of embolised vessels in centrifuged stem segments
To assess the distribution of embolised vessels within 27.4 cm stem segments, we used an ultra-low flowmeter system, as proposed by Tyree and Zimmermann (2002) and adapted by Pereira & Mazzafera (2012). With 36 samples in total, 12 per species (C. avellana, F. sylvatica, P. avium), samples were divided into three groups (n = 4). All samples were spun in the ChinaTron at 22°C. To monitor potential changes in embolism over time, each group of samples was subjected to a different spin time, which varied among the species: 1, 7.5, and 15 min of spin time for C. avellana; 1, 30, and 60 min for F. sylvatica, and 1, 15, and 30 min for P. avium. These arbitrary spinning times were selected based on trials (data not shown), which aimed to find the lowest spinning time differences that show changes in embolism level.
We also tested the potential effect of spinning air-exposed stem ends in a centrifuge to see if these would differ in embolism formation from samples that had their ends submerged in a perfusion solution inside cuvettes. Twelve samples in total, with four samples per species (n = 4), were spun in the ChinaTron at 22°C without cuvettes, and then compared to similar-sized samples with cuvettes.
The highest rotational speed applied to each species in experiment 2 was used because the ultra-low flowmeter could not detect embolism in lower rotational speeds. We prepared stem segments with cut-open vessels, which allowed us to remove embolism in conduits by flushing the stem segments. The length of each stem segment was shorter than the mean vessel length for each species (Tables S3 and S4).
Pausing the spinning to measure K0' and KF' allowed the pressure to return to nearly atmospheric levels, potentially leading to slight changes in the level of embolism (Wang et al., 2015a). However, we assumed that these changes in pressure did not impact the distribution of embolised conduits along the centrifuged stem samples.
2.4 Modelling the gas pressure in a recently embolised vessel in flow-centrifuge experiments
Since we did not know how exactly embolism formation was trigged (Kaack et al., 2021; Schenk et al., 2015), this process could not be directly modelled. However, once a conduit is embolised, it is initially filled with 100% of water vapour, and becomes gradually filled with gases—primarily N2 (78.09%), O2 (20.98%), Ar (0.93%), and CO2 (0.10%)—until atmospheric pressure has been achieved (Schenk et al., 2016; Wang et al., 2015b; Yang et al., 2023). As this process is associated with local gas transport and changes in pressure, we assumed that this step would be related to embolism resistance. Therefore, we developed a gas diffusion model to predict changes of the gas pressure in recently embolised conduits in a flow-centrifuge (Box S1). This model was based on Yang et al. (2023)'s Unit Pipe Pneumatic model (UPPn), and had a similar vessel geometry. It estimated gas diffusion in water-filled conduits and gas concentration in embolised vessels. Given the centrifugal force in a flow-centrifuge, the model also considered how anatomical parameters, temperature, time, and Ψ would affect the dynamic concentration of gas in a recently embolised vapour-filled vessel.
At a time zero (t = 0), we simulated an embolised water vapour-filled vessel at the centre of a centrifuge sample, and modelled its relative changes in gas concentration over time (Crelative). We assumed that the gas diffusion near the centre of the stem segment was through intervessel pit membranes only, mainly because gas diffusion across pit membranes has been estimated to be ca. 100 times faster than across cell walls (Yang et al., 2023). The model estimated the axial gas diffusion in sap from the stem ends through successive water-filled vessels towards the centre of the sample, and finally through a wet pit membrane into the embolised water-vapour-filled vessel.
A list of all abbreviations, units and definitions used in this study can be found in Tables S6 and S7. All equations and calculation steps were detailed in the Supporting Information (Methods S1).
2.5 Statistics and data analysis
Data processing, simulations and statistical analyses were performed in RStudio 2022 (version 4.2.2, R Core Team, Boston, USA).
In Experiments 1 and 2, we employed a time series analysis approach that captured temporal patterns over a single sample, as opposed to the conventional practice of having multiple independent replicates. Therefore, we aimed to describe the general trends of the changes in Kh over time, rather than quantifying this phenomenon and statistical comparison between different species and conditions (such as pressure and temperature).
Where K0 was the hydraulic conductivity measured at time zero, and Kh was the current hydraulic conductivity value.
Assuming that the gas pressure in a recently embolised vessel was mechanistically related to Kh, a linear relationship between Crelative and Krelative was assessed and used to evaluate the performance of our gas diffusion model. This assumption gains support from fundamental physical principles, as indicated by previous studies (Avila et al., 2022b; Salomón et al., 2021; Yang et al., 2023), which underscore the significance of gas movement in embolism propagation and its influence on gas concentrations over time. The rationale for this assumption lies in the premise that higher gas pressure within embolised vessels increases the likelihood of embolism spread to neighbouring vessels—a factor that impacts Kh. To quantify how much the model could predict xylem embolism propagation in a flow-centrifuge, we computed both the root mean squared error (RMSE) and Pearson correlation coefficient (R) of this relationship.
In experiment 3, a single stem segment was considered as one replication, and thus the spin time, the submergence of stem ends into a liquid solution inside cuvettes, and the location of the stem segment within the 27.4 cm long centrifuge sample were the sources of variation. The influence of these factors and their interaction on PLC was assessed using a non-parametric Kruskal-Wallis test. When statistically significant effects were identified, pairwise comparisons of mean values were conducted utilising Fisher's Least Significant Difference (LSD) test (p-value < 0.05).
3 RESULTS
3.1 Experiment 1: Continuous versus noncontinuous flow in hydraulic measurements over a long spin time
After 8 h of spinning at Ψ of −1.27 MPa, changes in the percentage of hydraulic conductivity (ΔKh) were 23.7% for the sample of C. avellana to which perfusion solution was continuously added (i.e., continuous flow), and 4.49% for the C. avellana sample that was subject to a noncontinuous flow (Figure S1). While a linear decrease of ΔKh was noticed from the beginning when a continuous flow was applied, a slight decrease was only evident after 6 h of spinning in the noncontinuous flow treatment. Therefore, flow measurements were found to be stable for at least several hours of spinning under the noncontinuous flow condition, which was the standard approach in our experiments.
3.2 Experiment 2: The effect of water potential, time and temperature on xylem embolism propagation
At 22°C, Kh and ΔKh values were largely pressure-driven, but changed logarithmically over time, increasing when Ψ was close to zero, but decreasing for low values of Ψ (Figures 1 and S2). The effect of time was visually most pronounced when plotting the relative values of ΔKh against time (Figure 1). For water potentials between −0.4 and −0.9 MPa, ΔKh increased over time for all three study species. For C. avellana and F. sylvatica, ΔKh was stable, and around zero when Ψ was between −1.1 and −2.1 MPa, respectively. There were no stable ΔKh values for P. avium within the 1 h of spinning. Values of Ψ that were lower than −1.4, −2.2, and −3.0 MPa, resulted in an overall decrease of ΔKh for C. avellana, F. sylvatica, and P. avium, respectively.
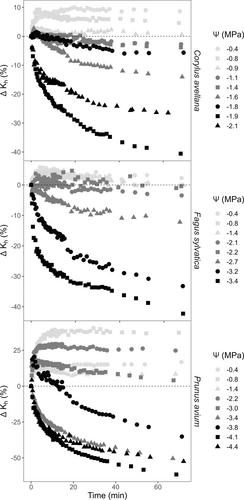
After 1 h of spinning, ΔKh decreased by a maximum of 40.6%, 42.3%, and 61.5%, or increased by a maximum of 10.0%, 5.8%, and 40.4% for C. avellana, F. sylvatica and P. avium, respectively. The magnitude of ΔKh was variable, depending on the species and the Ψ applied. Overall, the more negative Ψ induced in the flow-centrifuge, the higher the values of ΔKh, and the lower the absolute values of Kh at time zero.
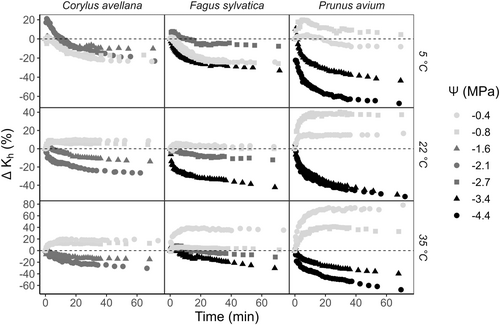
Our results also showed a temperature effect on ΔKh, mainly at 5°C (Figure 2). At this temperature and for Ψ values close to zero, we did not observe the same increasing pattern of ΔKh as seen at 22°C. ΔKh at 5°C tended to increase during the first 5 min, similar to the pattern at 22°C, but then decreased, and became negative after 15 min of spin time (except for one sample of P. avium), reaching values of −23, −24, and −8%, for C. avellana, F. sylvatica, and P. avium, respectively. Moreover, ΔKh at 5°C presented a pattern similar to that observed at 22°C for more negative Ψ values. When centrifuging samples at 35°C, ΔKh showed fairly similar temporal patterns to the ones observed at 22°C. Samples of P. avium reached +78.5 and −67.4% as the most positive and negative values of ΔKh, respectively.
The asymptotic exponential fitting function demonstrated a significant estimation of Kh values (p-value < 0.05) when we considered the two most negative Ψ values applied (Figure S3). The fitting function's efficacy was evident through low RMSE values and R values close to 1, indicating its ability to estimate Kh values with minimal error. The standardised residuals of the fitting, when plotted against the predicted values, ranged between −2 and 2, and exhibited a random distribution in most cases (Figure S4). In some cases, notably in P. avium, the residuals were wavelike, resembling sinusoidal functions. Therefore, we could estimate the minimum value of hydraulic conductivity (Kmin), and consequently the relative hydraulic conductivity (Krelative) with high precision for most of the treatments.
3.3 Experiment 3: Location of embolised vessels in centrifuged stem segments
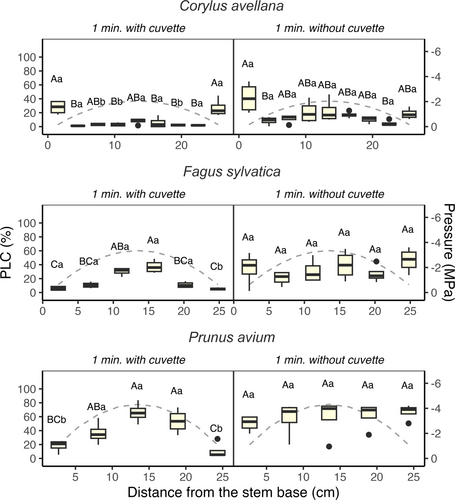
The Percentage Loss of Conductivity (PLC) changed over time, and was not homogeneously distributed along the 27.4 cm stem sample when cuvettes were used (Figure 3). The PLC distribution demonstrated symmetry with respect to the centre of the sample, and was in line with the theoretical pressure profile induced by centrifugation. Across the species studied, PLC values were significantly higher in segments at the centre of the centrifuge sample (p-value < 0.001) than in segments near the stem ends. Moreover, the PLC in segments at the centre of the centrifuge sample increased with a long spin time (p-value < 0.05). This trend was most evident for C. avellana, with PLC increasing from 7.8% after 1 min of spin time, to 53% after 7.5 min of spinning. Interestingly, C. avellana showed 27.2% of PLC at both stem ends after 1 min of spin time. These PLC values gradually decreased over time, while the amount of embolism near the centre of the centrifuge sample increased.
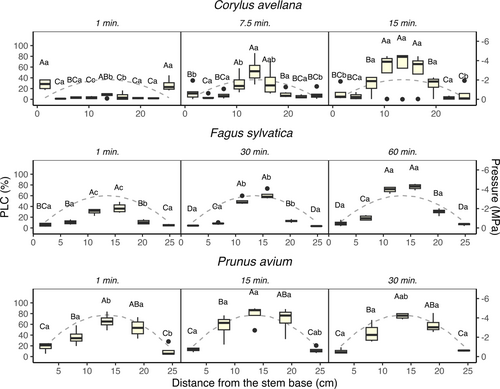
A comparison between stem samples spun for 1 min with and without cuvettes revealed significant differences in the location of embolism (Figure 4). PLC levels were higher at the stem edges in samples of F. sylvatica and P. avium that were spun without cuvettes than those spun with cuvettes (p-value < 0.05). The stem edges of C. avellana, however, did not exhibit a difference between samples spun with or without cuvettes. Samples of all species spun without cuvettes displayed a homogeneous PLC distribution along the centrifuge sample, with no statistical differences between stem segments at the ends and the centre (p-value > 0.05).
3.4 Modelling the gas pressure in a recently embolised vessel in flow-centrifuge experiments
Once embolism had occurred near the centre of a centrifuge sample, the model predicted fast axial movement of gas along the 27.4 cm stem sample during the first minutes, but considerably slower gas diffusion rates after 1 h (Figure 5). One hour after embolism formation, the relative gas concentration in a recently embolised vessel (Crelative) reached values between 83.8% and 87.7%, 63.1% and 69.7%, and 79.6% and 84.5% for C. avellana, F. sylvatica and P. avium, respectively.
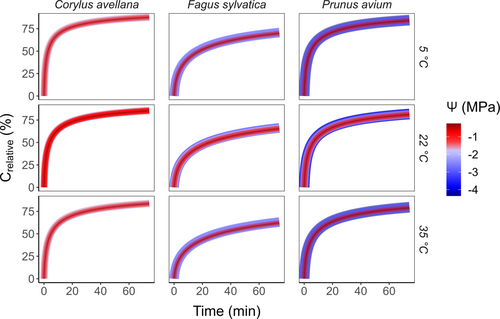
The axial gas diffusion rate was strongly affected by the temperature and the anatomical traits of the species (Figure S5), but minimally affected by Ψ (Figure 5). The higher the temperature, the smaller the changes in Crelative over time for all three species (Figure S5). Unlike temperature and xylem anatomy, Ψ changed Crelative by less than 1%. We noticed a slight difference between C. avellana and P. avium, but a larger difference between these two species and F. sylvatica. (Figure S6). For F. sylvatica, the axial gas diffusion was on average 20% slower than for C. avellana and P. avium.
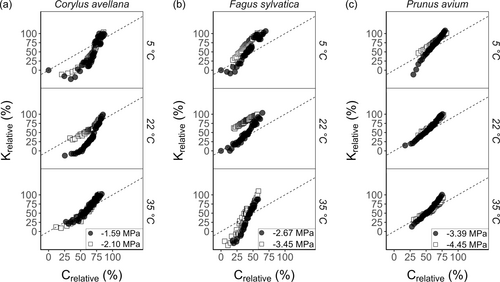
We observed a strong and positive correlation between Krelative and Crelative (Figure 6). These correlations were significant (p < 0.05) for all conditions of temperature and Ψ, with RMSE and R values close to 1. The performance of the model was most accurate for P. avium at 35°C and a Ψ of −4.45 MPa, with an error up to 5.2% (Table S8). Nevertheless, the fitting function could not accurately estimate the loss of Kh in some cases, either underestimating or overestimating Kh, depending on the conditions. The decrease in Kh over time for C. avellana at 5° and 22°C was slower than the increase in Crelative. On the other hand, F. sylvatica at 22°C and 35°C showed underestimation of Crelative, with Kh decreasing faster than the increasing Crelative. For C. avellana at 35°C, F. sylvatica at 5°C, and P. avium at 5, 22, and 35°C, the correlation curves were close to the 1:1 line (Figure 6), showing that the increase in Crelative was strongly correlated to the decrease in Krelative.
4 DISCUSSION
Our results revealed that hydraulic conductivity (Kh) measurements in a flow-centrifuge are not stable at a fixed pressure and temperature over a spinning duration of 1 h. Since relative changes in hydraulic conductivity (ΔKh) did not change randomly around zero over time, the variation observed cannot be considered as noise (Figures 1 and 2). As expected, experiment 2 (the effect of water potential, time and temperature on Kh) showed that pressure is highly important in determining the overall magnitude of Kh, with absolute Kh values taken at high water potentials being much higher than those measured at low water potentials (Figure S2). However, depending on the temperature, the xylem anatomy of the plant species studied, and the pressure applied, changes in Kh showed a particular behaviour over time. Therefore, assuming that decreases in Kh are related to increasing levels of embolism, we argue that embolism spread may represent a relatively slow process, and is not only pressure-driven. The main reason why we consider ΔKh is that we aim to shed light on the relative changes in Kh over time to explore the driving mechanisms behind embolism spread. These ΔKh values also enable us to compare the effects of the different treatments applied, and differences in xylem anatomy between species. As such, methodological issues related to vulnerability curves and how we quantify embolism resistance go beyond the purpose of this study, and are published separately (Silva et al., 2024).
Our findings presented strong evidence for a mechanistic relationship between Kh and embolism formation. While an increase in PLC over time at the centre of centrifuge samples (Figure 3) can explain the decrease in Kh in flow centrifuge measurements (Figures 1 and 2), experiment 1 (the effect of flow on Kh) showed that temporal variation in Kh cannot be driven only by a non-embolism related decline in Kh over time. We observed a small, but long-term decline in conductivity when there was a constant flow through a stem sample (Figure S1), which can be attributed to various processes (Sperry et al., 1988; Yin et al., 2019). Potential explanations include pit membrane clogging, wound response, a potential difference between the inlet and outlet flow, radial or background flow, or compression of intervessel pit membranes (De Baerdemaeker et al., 2019; Espino & Schenk, 2011). However, Kh changed minimally over time (−0.7%) when we only injected solution during measurements within the first hour of spinning. This 'natural' decline in Kh cannot explain the much higher changes in Kh observed in experiment 2, and is certainly not in line with our observations of increases in ΔKh. Moreover, if nanobubbles included in the injected water of the centrifuge were to cause embolism, as suggested by Yin et al. (2019), we would only observe a decrease in Kh and higher levels of embolism at the injection side. However, this was not the case, even if the spin time was relatively long. As reviewed by Ingram et al. (2023), nanobubbles typically range from 100 to 200 nm in size, exceeding the dimensions needed to traverse the 5–50 nm pores in mesoporous pit membranes (Choat et al., 2003, 2004; Zhang et al., 2020). Consequently, nanobubbles exhibit limited propensity to migrate across segments when pit membranes are present. In fact, our experiment 3 (embolism location) demonstrated that the distribution of embolism displayed a nearly symmetrical distribution around the stem centre when cuvettes were used.
Since embolism removal is generally not considered to occur in a sample that is exposed to a negative pressure (Lamarque et al., 2018; Tyree & Sperry, 1988), the observed increase in Kh over time has been rarely reported in literature. Sperry et al. (1988) described this increase as a rearrangement and/or dissolution of embolism within xylem conduits, which mainly occurs under subatmospheric pressure (6 KPa). Thus, this rearrangement and/or dissolution of embolism can explain the increase in Kh when we applied a water potential close to zero or slightly negative pressures. Apart from rearrangement, the replacement of xylem sap with the flow-centrifuge solution may also modify the water flow through interconduit pit membranes and thus increase Kh, a phenomenon also known as the ‘ionic effect’ (Jansen et al., 2011). Interestingly, samples centrifuged at 5°C presented a much weaker increase in ΔKh (Figure 2), suggesting that the temperature may also play an important role in the rearrangement and/or dissolution of embolism and eventually in embolism spreading. One explanation for this finding can be provided by Briggs (1950), who described that water under negative pressure loses much of its ability to support negative pressure between 0°C and 5°C, which may lead to an increase in embolism events. While the likelihood of homogeneous and heterogeneous cavitation is known to increase with increasing temperature (Caupin & Herbert, 2006; Herbert et al., 2006), embolism in xylem conduits is not known to be caused by cavitation (Hölttä et al., 2002). Overall, little is known about how temperature may affect xylem embolism resistance (Cochard et al., 2007; Lodge et al., 2018). Temperature may also affect gas solubility and oversaturation of xylem sap, or could affect the dynamic surface tension at gas-liquid interfaces (Schenk et al., 2016; Yang et al., 2020).
Experiment 3 shows that there are at least two different locations in centrifuge samples where embolism is formed, namely near the stem edges and in the centre. Over time, the amount of embolism near stem edges decreased, but increased near the centre. We speculate that the initial embolism levels near stem edges are caused by the axial proximity of the cut-open conduits to atmospheric gas, either dissolved gas in the liquid in the cuvettes, or gas outside the cuvettes. The comparison of spinning samples with and without cuvettes supports this speculation. This comparison, which is similar to comparing the static with the flow-centrifuge, demonstrated that embolism formation is faster and more pronounced near both stem ends when no cuvette is used. In the absence of cuvettes, cut-open vessels at the stem ends were exposed directly to atmospheric pressure, which quickly led these to be filled with gas at atmospheric pressure. However, the constant decrease in Kh over time observed in experiment 2 is likely associated with embolism spreading in the stem centre, as the most negative pressure in this area clearly increases the likelihood of new embolism events. Gas solubility increases slightly with decreasing negative liquid pressure (Lidon et al., 2018; Mercury et al., 2003), but the effect of temperature has a higher influence on gas solubility than pressure (Schenk et al., 2016). Our results also revealed that the speed of embolism formation and the location of embolism may vary according to the species studied. Therefore, we suggest that the disagreement between earlier studies on the location of embolised vessels in centrifuged stems is likely due to different species used in each study, as well as to the spin time, which proved to be essential in our observations, but was not reported or considered in earlier work (Cai & Hacke, Zhang, et al., 2010; Cochard et al., 2010; Martin-StPaul et al., 2014; Sperry et al., 2012; Tobin et al., 2013; Yin et al., 2019).
The observed difference in the speed of embolism propagation between species in our experiments may be related to the ability of the species to resist embolism formation, and is likely associated with the vessel anatomy, including vessel diameter, vessel length, and intervessel connectivity. However, more experiments with a larger number of species would be needed to test this hypothesis (Isasa et al., 2023; Lens et al., 2011, 2022). Interestingly, the vessel anatomy also affected our model of gas pressure in a recently embolised vessel in the centre of a centrifuge sample. While a higher value of the total intervessel pit membrane area (Ap) increases the axial gas transport rate in xylem sap (ka), and the gas transport rate across the pit membranes (kp), a larger vessel volume (Vv) also requires much more gas, and probably more time to achieve atmospheric pressure. Wide and long vessels can therefore be suggested to provide a longer, temporary 'buffer' against further embolism spread than narrow and short ones. If the gas concentration in a recently embolised vessel (Crelative) is related to the rate of embolism formation and propagation, it seems reasonable to expect that Vv and Ap could play a role in xylem embolism resistance. Notably, Pereira et al. (2023) unveiled a convex safety-efficiency trade-off, in which plants could display adaptability in modifying pit membrane thickness (TPM) and Ap. Even minor alterations of these two parameters could have an exponential impact on the pressure difference and flow across bordered pit pairs.
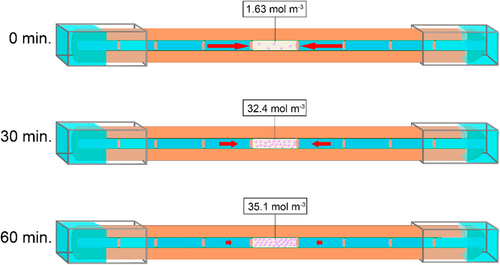
Here, we modelled the transition of a water-vapoured filled conduit to a conduit filled with gas at atmospheric pressure, which was shown to correlate significantly with ΔKh (Figure 6). This significant correlation provides evidence that the increase in Crelative and the decline of ΔKh have the same time scale and order of magnitude, suggesting that a functional link between both processes is likely. Two different steps in the process of embolism spread may explain this functional link. Firstly, a recently embolised vessel that is water vapour filled provides likely a buffer for further embolism propagation because the low vapour pressure (ca. 3.2 kPa) will extract gas molecules from surrounding vessels, until it eventually reaches atmospheric pressure (Figure 7; Wang et al., 2015b). If a high gas concentration is necessary for embolism initiation, the temporal and local extraction of gas from surrounding, sap-filled vessels can be suggested to reduce the risk of new embolism events. Secondly, when sufficient gas has been accumulated in an embolised conduit, this gas reservoir becomes a gas source that may increase the likelihood to have embolism formation in a neighbouring, interconnected conduit (Guan et al., 2021). Thus, we assume that the amount of gas in a recently embolised conduit determines the likelihood of embolism spread in a neighbouring conduit, for instance through snap-off events and nanobubble formation (Schenk et al., 2015, 2017). Finally, this new conduit will again extract gas from neighbouring conduits, slowing down embolism spread temporarily.
The lack of a strong agreement between measured and modelled data in some samples may originate from limitations inherent to the flow-centrifuge method, as well as simplifications and assumptions made in our gas diffusion model, which focuses solely on the build-up of pressure within a single conduit due to gas diffusion, without considering the potential for artificially generating embolism events in neighbouring conduits. Correlating modelled data on gas concentration within a single, embolised conduit with experimental data on flow conductivity involves comparing two fundamentally different quantities, and this discrepancy underlines the shortcomings in the model's representation of the actual physical processes under study. Moreover, our non-propagating embolism model primarily considered passive axial diffusion as the sole mechanism for gas transport, which might have led to a slight underestimation of the rate of gas diffusion. In reality, the presence of flow, which we estimate to occur for a total of approximately 7.7 min within a 1-h spinning experiment, and radial gas diffusion may introduce additional exogenous gas into the xylem, thereby increasing the rate of gas diffusion to a recently embolised conduit. Also, models have typically considered vessels as cylindrical structures, which are connected to each other at their ends and have a homogeneous diameter (Pereira et al., 2022, 2023; Yang et al., 2023), and thus overestimated the average distance that water and gas molecules travel within a single conduit (Bouda et al., 2019). Further refinement of the model would thus be useful in future research. Moreover, minor changes in Kh due to pit membrane deformation, clogging by impurities, polar lipids, or nanobubbles, or variation in Kh under different pressures (Krieger et al., 2022), may not always reflect changes in the amount of embolism. These uncertainties may propagate a certain, minor degree of error, and may weaken our analyses, correlations, and interpretations. Nevertheless, fitting the data measured in models proved to be an appropriate strategy, and showed that the modelled data were not randomly generated, but likely reflect physical phenomena. Hence, experiments with flow-centrifuges provide a valid approach to investigate the driving mechanisms behind embolism, even if flow-centrifuge experiments do not entirely mimic functional, intact xylem operating in plants under natural field conditions, especially when it comes to time-based changes in gas pressure and concentration.
In conclusion, the modelled data suggest that embolism propagation may be affected by gas diffusion, which is driven by local differences in gas concentration. Our findings raise questions about the traditional assumption that embolism is exclusively pressure-driven, as suggested for instance by the x-axis of vulnerability curves (Silva et al., 2024). Embolism propagation proved to be dynamic, influenced by an interplay of pressure and temperature, and is likely related to key vessel traits. Our experiments showed that not only the amount of embolism may slightly change over time in a flow-centrifuge, but also its location within the sample. These findings significantly enhance our understanding of how hydraulic failure by embolism formation spreads within xylem.
ACKNOWLEDGEMENTS
We thank Mathias Eberhardt and Merlin Grimm for experimental work with the ChinaTron centrifuge. The authors also thank valuable discussions with Jochen Schenk, and comments made by reviewers. We acknowledge funding from the Deutsche Forschungsgemeinschaft (DFG, German Research Foundation) to SJ (project no. 457287575), and to LP (project no. 508216003). Open Access funding enabled and organized by Projekt DEAL.
CONFLICT OF INTEREST STATEMENT
The authors declare no conflicts of interest.
Open Research
DATA AVAILABILITY STATEMENT
The data supporting the findings of this study are available within the paper and supplementary files.


