Effects of water stress on apoplastic barrier formation in soil grown roots differ from hydroponically grown roots: Histochemical, biochemical and molecular evidence
Abstract
In root research, hydroponic plant cultivation is commonly used and soil experiments are rare. We investigated the response of 12-day-old barley roots, cultivated in soil-filled rhizotrons, to different soil water potentials (SWP) comparing a modern cultivar (cv. Scarlett) with a wild accession ICB181243 from Pakistan. Water potentials were quantified in soils with different relative water contents. Root anatomy was studied using histochemistry and microscopy. Suberin and lignin amounts were quantified by analytical chemistry. Transcriptomic changes were observed by RNA-sequencing. Compared with control with decreasing SWP, total root length decreased, the onset of endodermal suberization occurred much closer towards the root tips, amounts of suberin and lignin increased, and corresponding biosynthesis genes were upregulated in response to decreasing SWP. We conclude that decreasing water potentials enhanced root suberization and lignification, like osmotic stress experiments in hydroponic cultivation. However, in soil endodermal cell suberization was initiated very close towards the root tip, and root length as well as suberin amounts were about twofold higher compared with hydroponic cultivation.
1 INTRODUCTION
Drought severity and frequency have increased as a result of climate change (AghaKouchak et al., 2014). For agriculture, drought is a recurring catastrophic climate occurrence and one of the costliest natural disasters worldwide, according to historical drought trends (Asong et al., 2018). Scientists have examined how plants respond to drought and discovered that, as drought intensifies, there is a stronger nonlinear relationship between vegetative growth and drought (Zhou et al., 2022). To ensure agricultural efficiency and output in the future, genetic diversity is crucial (Dawson et al., 2015). Given the effects of climate change, this genetic diversity is very valuable since it facilitates the production of more robust and flexible cultivars (Dawson et al., 2015; Newton et al., 2011). Over the years, genetic and genomic tools have been employed to improve drought tolerance. In the current study, we chose barley due to its importance in food production (ranking fourth in the world's food production), and its genetic diversity. The wild progenitor (Hordeum vulgare ssp. spontaneum) originating from the Fertile Crescent region is adapted to various arid and semiarid habitats (Badr et al., 2000). In contrast to the wild progenitor, the modern cultivars of barley, Hordeum vulgare ssp. vulgare, which are derived from wild barley, have lost important traits related to drought tolerance due to breeding over the years for preferred traits reducing the genetic background (Cai et al., 2020; Zhao et al., 2010). The lost traits during selection can be reintroduced into cultivated barley for crop improvement purposes (Ellis et al., 2000) allowing for the breeding of more drought tolerant barley varieties in the future. Therefore, it was the aim, comparing a wild progenitor of barley (H. vulgare ssp. spontaneum) rich in genetic diversity, with a modern barley cultivar (H. vulgare ssp. vulgare), reduced in genetic diversity. This could offer new aims what to consider for breeding more drought tolerant modern barley cultivars.
Roots play an important role in facilitating drought tolerance since they are the organs being directly exposed to water deficiency in soil and they have to respond securing water supply of the plant as good as possible. Thus, water and coupled nutrient uptake efficiency play an important role to mitigate water deficits. Water and nutrient uptake in roots can occur through apoplastic and cell-to-cell pathways (symplastic and transcellular pathways). The apoplastic movement of water and solutes can also be affected by the formation of Casparian strips and suberin in the endodermis (Franke & Schreiber, 2007; Ranathunge et al., 2017). Abiotic and biotic stressors have been demonstrated to enhance suberization in roots (Grünhofer et al., 2022, 2023; Holbein et al., 2019; Kreszies et al., 2020; Lanoue et al., 2010). The suberin polymer is composed of polyaliphatic and polyaromatic domains. Primary alcohols, fatty acids, α,ω-dicarboxylic acids (diacids), and ω-hydroxy acids (ω-OH acids) are the aliphatic monomers, whereas ferulic and coumaric acids are the aromatic components (Graça, 2015; Schreiber et al., 1999). Casparian strips are mainly made up of lignin (Naseer et al., 2012; Schreiber, 1996; Zeier & Schreiber, 1997). Syringyl, guaiacyl, and p-hydroxyphenol are the monomers of lignin, a complex aromatic biopolymer (Rolando et al., 1992). Apoplastic barrier formation leads to water uptake via the cell-to-cell pathway, which is regulated by aquaporins (Steudle, 2000a, 2000b). Previous hydroponic studies showed an earlier onset of root suberization in modern cultivar Scarlett (H. vulgare L. ssp. vulgare) when compared with wild accession Pakistan (ICB181243; H. vulgare L. ssp. spontaneum) during osmotic stress induced by polyethylene glycol (PEG) 8000 (Kreszies et al., 2020).
Water stress for plants starts in soil and roots are the first plant organs to sense water limitation in dehydrating soil. Thus, studying roots is of great importance to understand the altered growth and development of plants in response to low soil water content (SWC). In this study, the main intention was to investigate the responses of apoplastic barriers in barley roots to water limitation in soil. Anatomy of root cross sections, chemical composition of apoplastic barriers, and gene expression patterns were analysed over the length of the root. It was the intention of identifying differences in drought stress responses comparing a modern barley cultivar with a wild barley cultivar. In addition, drought effects on root growth in soil investigated here should be compared with recently published data describing root responses to osmotic stress in hydroponic cultivation, mimicking water stress (Kreszies et al., 2020). We hypothesized that (i) the root response to drought stress of wild barley will differ from the modern cultivar (Scarlett and the wild accession), and that (ii) the drought stress response of soil grown roots will differ from that of plants cultivated in hydroponics.
2 MATERIALS AND METHODS
2.1 Plant material and growth conditions
The rhizotron experiments were performed in the greenhouse of the Institute of Bio- and Geosciences (Plant Sciences) (IBG-2, Forschungszentrum Jülich GmbH) during the months of June 2020 and June 2021. For detailed growth conditions, refer to Nagel et al. (2012). The rhizotrons were filled with sieved, black peat soil (Graberde; Plantaflor Humus). Seeds of the cultivar Scarlett (Hordeum vulgare ssp. vulgare) and the wild barley accession Pakistan (ICB181243; Hordeum vulgare ssp. spontaneum) were soaked in water (Day −1) and transferred to rhizotrons (Day 0) to germinate. A thin layer of perlite or vermiculite was added on top, and only these layers were watered with 20 mL thrice per week for stress treatments to prevent the excess loss of moisture from the soil. For the control condition, the whole rhizotron (vermiculite layer and soil) was watered with 400 mL of tap water three times per week. The plants were grown for 12 days under 16 h/8 h of day/night, temperatures of 25.8/19.7°C, relative air humidity of 48.9/64.5% and average light intensity during the day of 181.5 µmol/m2 s between 06:00 and 22:00 h local time. The rhizotrons were imaged for physiological root measurements on Days 1, 4, 6, 11 and 12 after transferring the seeds to the rhizotrons with the automated phenotyping platform GrowScreen-Rhizo 1 (Nagel et al., 2012) to quantify noninvasively root-system architecture. Root traits such as visible main root length, visible lateral root length, maximum depth and width of the root system, and convex hull area which represents the area which is covered by the root system were estimated as described in Nagel et al. (2012). After the 12th day, the soil-filled rhizotrons were washed with water to obtain the whole root system with the shoot intact. For each plant, shoot height, leaf length and individual seminal root length were measured using a ruler. The shoot and roots were separated and dried in the oven for 10–12 days at 60°C until the constant weight was measured for dry weight determination.
2.2 Water stress stimulation: Measurements of SWC and soil water potential (SWP)
A calibration curve (pF curve) was established correlating the SWP in MPa with the corresponding relative SWC in % (Figure 1). Relative SWC in % is calculated by first subtracting the weight of the totally dried soil from the weight of the wet soil and then dividing the difference by the weight of the dry soil. SWC was measured by gravimetry and SWP was measured using a WP4C soil water potentiometer (Decagon Devices). For generating the calibration curve, a larger batch of soil (about 5 L) was homogeneously watered overnight, and a large number of smaller samples (about 10 mL) were prepared in preweighed containers. SWPs and weights of the well-watered soil samples were measured at time 0. Subsequently, the soil samples were allowed to continuously dry out over 2 weeks. Every day from Day 0 to Day 14, a subset of at least three soil samples were taken for determination of the SWP and the corresponding weight. Subsequently, soil samples were dried at 60°C for 1 week, and the final dry weight was measured. Finally, SWC in % of the individual soil samples was calculated. Data pairs (SWP vs. SWC) were plotted and a polynomial curve was fitted (Figure 1).
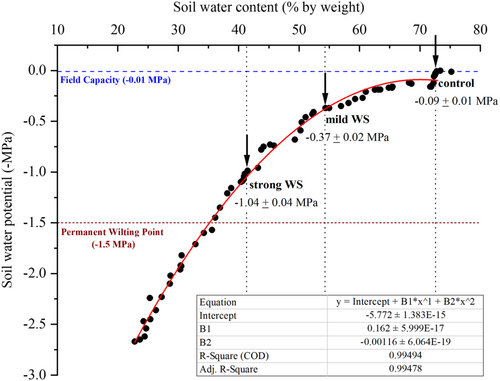
To obtain larger volumes of soil with a reduced SWC for the planned stress experiments, the sieved black peat soil was spread in the greenhouse and turned around two to three times a day for a couple of days to loose moisture before it was evenly filled into the rhizotrons. This resulted in relative SWCs of about 50% (mild water stress: mild WS) in 2021 and of about 40% (strong water stress: strong WS) in 2022 (Supporting Information S1: Figure S1). Well-watered soil (SWC of about 70%), close to field capacity (Figure 1), was used for the control experiment.
2.3 Histochemical detection of suberin lamellae and lignified tissues in roots
Harvested roots were stored in fixation solution and segmented into 1 cm sections, after which they were cut into 50 µm thick cross-sections using a cryostat microtome (Microm HM 500 M, Microm International GmbH). Suberin lamellae were stained for 1 h using 0.01% (w/v) lipophilic Fluorol Yellow 088 (Brundrett et al., 1991). Safranin red 1% (w/v) for 10 min and Astra blue 1% (w/v) for 10 min were used for differential staining to differentiate between lignified and unlignified tissues (Vazquez-Cooz & Meyer, 2002). Before applying the counterstain (Astra blue), the section was washed thrice with 70% ethanol to remove excess Safranin. Safranin red will stain lignified tissues red, while Astra blue will stain unlignified tissues blue. Photographs for both suberin lamellae and lignified tissues were made using a Canon EOS 600D camera and an ultraviolet (UV) filter set (Zeiss) (excitation filter BP 365, dichroic mirror FT 395, barrier filter LP 397). As described in Kreszies et al. (2019), the analysed root segments were expressed as relative lengths of the entire root, with 0% representing the root tip and 100% representing the root base.
2.4 Chemical analysis of barley root suberin
Following harvesting from the rhizotrons, root samples were kept in 70% ethanol. Seminal root was divided from tip to base into three different zones (zone A: 0%–25%, zone B: 25%–50% and zone C: 50%–100%) as described in Kreszies et al. (2019, 2020), and were enzymatically digested with 0.5% (w/v) cellulase and 0.5% (w/v) pectinase at room temperature under gentle shaking (Zeier & Schreiber, 1997). The enzyme solution was changed every 3–5 days for 3 weeks. The roots were washed in borax buffer and then in deionized water. Subsequently, samples were transferred to chloroform:methanol (1:1) to remove all soluble lipids. Before chemical analysis, root samples were dried, weighed and cut into very fine sections (Ranathunge et al., 2016). For both suberin and lignin analyses, 10 seminal roots sections from three to four plants were pooled per replicate for each zone.
For suberin depolymerization, 2 mg extracted materials were transesterified for 16–18 h at 70°C in 30% (v/v) boron trifluoride-methanol (Zeier & Schreiber, 1998). To stop the depolymerization reaction, 2 mL of saturated NaHCO3 was added. As an internal standard, 10 µg of C32 (dotriacontane) were spiked into each sample. Suberin monomers were extracted three times by adding 2 mL chloroform. Free hydroxy groups of released suberin monomers were derivatized using 20 µL of N, O-bis-(trimethylsilyl)-trifluoroacetamide (BSTFA) and 20 µL of pyridine for 40 min at 70°C before gas chromatographic analysis. Suberin monomers were quantified by injecting 1 µL of sample on a splitter system on a gas chromatography connected to flame ionization detection (GC-FID; HP 6890N; Hewlett-Packard) and identified by gas chromatography connected to mass spectrometry (GC-MSD; 5977B; Agilent). The obtained mass spectra of suberin monomers were compared with literature mass spectra and an in-house created mass spectral library (Schreiber et al., 2005).
2.5 Chemical analysis of barley root lignin
The protocol from Foster et al. (2010) was used with slight modifications. For lignin analysis in the three root zones (A, B and C). Only 1–2 mg of extracted dried samples were weighed, incubated in 500 µL of the thioacidolysis reagent on a heat block (105°C) for 4 h in autosampler vials. These vials were sealed with an extra Teflon disc inside the crimp seal with PTFE/silicone septa. Samples were vortexed once per hour and it was made sure that the analyzing materials remained in the liquid reagent throughout the digestion. Upon completion of the reaction, autosampler vials containing the samples were cooled to room temperature, and spiked with 10 µg of C32 (Dotriacontane) as internal standard. To stop the reaction 500 µL of saturated NaHCO3 solution was added. Samples were extracted three times with 1 mL ethyl acetate. The combined organic extracts were dried in a heating block, and 500 µL of acetone was added twice to remove all the excess water at 60°C using a gentle nitrogen stream. For lignin monomer analysis by gas chromatography, samples were derivatized with 20 µL pyridine and 100 µL BSA reagent (N,O-bis(trimethylsilyl)acetamide; Sigma Aldrich) for 45 min at 70°C. Suberin monomers were quantified by injecting 1 µL of sample on a splitter system on a gas chromatograph connected to flame ionization detection (GC-FID; HP 6890N; Hewlett-Packard). Lignin monomers were identified by GC-MS (GC-MSD; 5977B; Agilent) according to Rolando et al. (1992) thioacidolysis products prominent fragments.
2.6 RNA extraction, sequencing and RNA-Seq analyses
RNA was extracted from the 12-day-old barley roots grown under control (well-watered, −0.09 MPa) and strong water stress (−1.04 MPa) of both cultivars using the Zymo Research Plant Easy RNA kit. Based on the histochemical analysis a section from zone A (0%–12.5% of the root length) was harvested for the analysis. The quality was assessed using a nanodrop spectrophotometer (NanoDrop 2000c Spectrophotometer; ThermoFisher Scientific), a gel run and determination of RIN values. Roots were washed with DEPC treated water, and flash frozen using liquid nitrogen. RNA-sequencing was carried out with a total of three biological replicates growing either under control conditions and under water stress. Each replicate consisted of pooled roots from five to six different plants. cDNA libraries were prepared using the QuantSeq. 3′mRNA kit, and the sequencing was done on an Illumina HiSeq. 6000 platform, kindly enabled by the NGS Service, University of Bonn, Germany. Approximately 10–15 million reads were obtained, with a base length ranging up to 1 × 50 bp. The raw RNA-Seq reads were first subjected to a quality check using fastQC, which was then subsequently processed through cutAdapt (Martin, 2011) to remove traces of any sequencing adapters. The processed reads were then aligned against the barley reference genome (EnsemblPlants, v2) using Tophat2 (Trapnell et al., 2012) with the help of a bowtie index designed with the individual chromosome files and default parameters. For mapping statistics, a percentage of at least 90% alignment was considered to be the minimum for further downstream processing in our study. With the alignment files in BAM format, a gene count matrix was obtained using the featureCounts (Liao et al., 2014) function from the Rsubread package (Liao et al., 2019).
With these files, an MDS (Multi-Dimensional Scaling) scaling plot was also generated using the limma (Ritchie et al., 2015) and edgeR (Robinson et al., 2010) packages respectively, which highlighted the nature of the replicates and homogeneity of the samples used in this study. Differential expression analysis was then carried out using the normalized counts using DESeq. 2 (Love et al., 2014) with cutoffs: |log2FC | >1 and FDR < 0.05, where the raw p values obtained using Wald test (Wald, 1943) were subsequently corrected by False Discovery Rate analysis (Benjamini & Hochberg, 1995). For this study, a contrast matrix was designed as stress (−1 MPa) versus control (well-watered). Gene ontology analyses with the obtained differentially expressed genes (DEGs) were carried out with agriGO software (Tian et al., 2017) or shinyGO software (Ge et al., 2020), available online. The raw sequencing data has been deposited at the National Centre for Biotechnology Information (NCBI) database (ID: PRJNA1063280).
2.7 Statistical analysis
Depending on the type of experiment, the number of replicates varied: more than 10–30 for phenotypic measurements, 10–15 for microscopic examinations, 6–3 for chemical analysis and 3 for RNA-Seq were examined. For the statistical evaluation of the data and figure preparation, OriginPro 2021b (OriginLab Corporation) was used. Using the Shapiro–Wilk test, the normal distribution of the data was tested before checking for statistical significance. All the physiological measurements and chemical analysis were assessed using the analysis of variance (Fisher's least significant difference, LSD) of plants grown under varied water potentials and a significance threshold of 0.05 was used. Means with standard deviations or box plots with medians and means are shown in the graphs.
3 RESULTS
3.1 SWC and SWP
After 12 days of plant growth, rhizotrons were opened and soil samples were taken at three different depths in the rhizotrons (bottom: 15%–25%; middle: 40%–50%; top: 75%–85%) in relation to the maximum root system depth (100%) in length (Supporting Information S1: Figure S1). SWC of the well-watered soil (control experiment) was 72.6% ± 0.4. SWC of the stress treatments was 54.3% ± 0.5 (mild WS) and 41.3% ± 0.8 (strong WS), respectively. Within each of the three treatments, SWC did not vary significantly between the three different positions (Supporting Information S1: Figure S1). The SWPs of the control and two different treatments could be predicted from the calibration curve using the equation of the curve fit (Figure 1). SWPs for well-watered soil (control) were −0.09 ± 0.01 MPa, and for the stress treatments, they were −0.37 ± 0.02 MPa (mild WS), and −1.04 ± 0.04 MPa (strong WS), respectively (Figure 1). Thus, control conditions were close to field capacity (−0.01 MPa) and stress treatments were between field capacity and the permanent wilting point (−1.5 MPa) defined for crops (Kirkham, 2005).
3.2 Root and shoot morphology
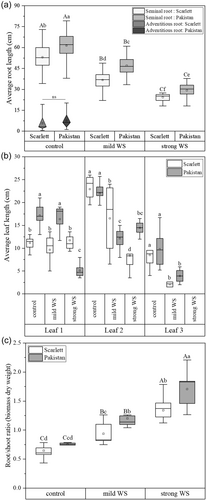
The average root length of 12-day-old barley seminal roots of both, Scarlett and Pakistan cultivars, negatively correlated with decreasing SWP (Figure 2a). The average seminal root lengths under control, mild WS and strong WS treatment was always shorter in Scarlett (53.1 ± 9.2 cm; 36.8 ± 5.6 cm; 24.4 ± 2.7 cm) compared with Pakistan (61.3 ± 9.7 cm; 47.1 ± 7.4 cm; 29.3 ± 5.2 cm). Only 12-day-old control plants developed very short adventitious roots (Figure 2a). The maximum root system depth (Supporting Information S1: Figure S2a) and the total visible root length (Supporting Information S1: Figure S2b) after 12 days cultivation was higher in Pakistan compared with Scarlett. Maximum root system width was almost similar for control and mild WS plants compared with strong WS (Supporting Information S1: Figure S2c). The total visible lateral root length was not significantly different for cultivars or treatments (Supporting Information S1: Figure S2d). Compared with Scarlett the first leaf of Pakistan was longer in control and mild WS but shorter in strong WS (Figure 2b). Lengths of leaves 2 and 3 were reduced in response to stress in both cultivars and strong WS delayed the formation of the third leaf in both cultivars (Figure 2b). Root/shoot ratios increased significantly upon stress treatments (Figure 2c).
3.3 Root anatomy: Suberin and lignin staining
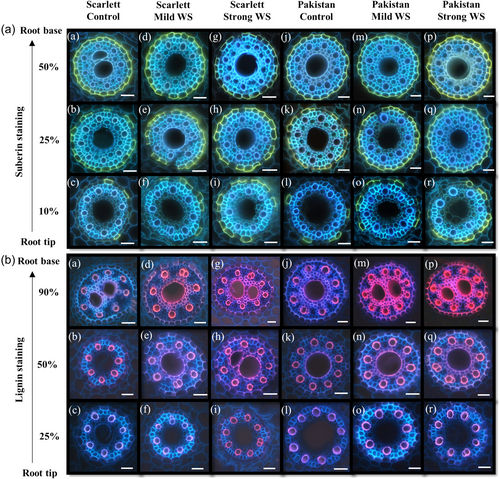
At 25% and 50% of the root length, almost all endodermal cells were fully suberized except for some passage cells in control and stress treatments (Figure 3a). In control and both WS treatments, first suberized endodermis cells were already detectable at 5%–10% of the total root length (Figure 3a). At 10% of the root length, the endodermal cell wall suberization was higher for roots grown in stress compared with control in both cultivars (Figure 3a). Intensity of the lignin staining of late metaxylem, early metaxylem and endodermal cell walls was increasing from 25 over 50%–90% of the root length and it was increasing with stress intensity (Figure 3b). In response to WS the inner tangential endodermal cell walls were asymmetrically stained at 50% and 90% of the root length (Figure 3b). This is complementary to the suberin staining, where the outer tangential endodermal cell walls showed a much stronger asymmetric staining compared with a fainter staining of the inner tangential cell walls (Figure 3a).
3.4 Chemical analysis of barley root suberin
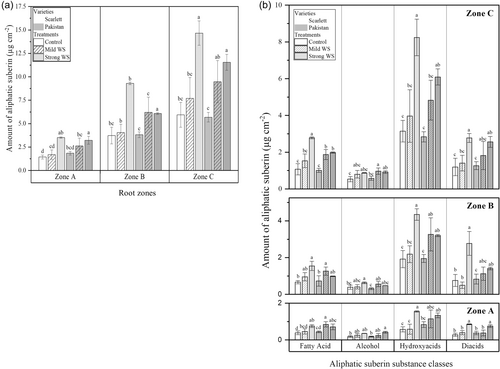
In both cultivars, the total amount of linear long-chain aliphatic suberin monomers released after transesterification continuously increased over root length (Figure 4a), which was not the case for the aromatic suberin amount (Supporting Information S1: Figure S3a). In Scarlett, strong WS significantly enhanced suberization mainly in zone C, whereas in Pakistan both, mild WS and strong WS, significantly enhanced suberization in zones B and C (Figure 4a). In response to strong WS total amounts of aliphatic suberin were higher in Scarlett compared with Pakistan. Aliphatic suberin was composed of four main substance classes (Figure 4a): fatty acids, alcohols, ω-hydroxy acids, and α,ω-dicarboxylic acids (diacids). Most of the total amount of aliphatic suberin was composed of ω-hydroxy acids, followed by diacids, fatty acids and alcohols (Figure 4b). Chain lengths of the aliphatic suberin monomers varied between C16 and C26 (Supporting Information S1: Figure S4a–d) with C18:1 ω-OH, C18:1 diacid and C24 ω-OH hydroxyl fatty acid representing the most abundant aliphatic suberin monomers. Aromatic suberin was mainly composed of coumaric and ferulic acid monomers; trans isomeric monomers of these monomers were present in higher amounts compared with cis isomers (Supporting Information S1: Figure S3b).
3.5 Chemical analysis of barley root lignin
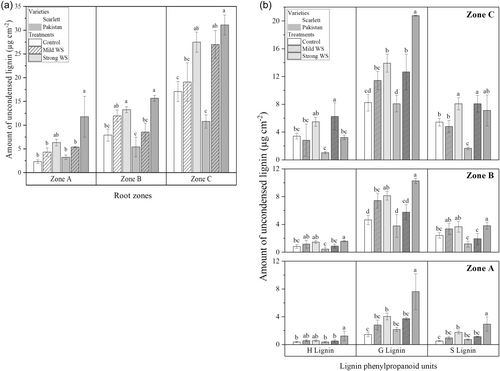
That amount of lignin which can efficiently be depolymerized in the solid state with minimal condensation is called uncondensed lignin (Li et al., 2018). Uncondensed lignin increased from zone A to zone C in both cultivars (Figure 5a). Within the same root zone for each of the three stress treatments total amounts of lignin were similar between Scarlett and Pakistan (Figure 5a). The total uncondensed lignin was composed of three main groups of monomers (C6C3 aryl glycerol-β-aryl ethers): p-hydroxyphenyl (H), guaiacyl (G), and syringyl (S) monomers (Figure 5b). G lignin monomers were the dominant group of monomers in both, Scarlett and Pakistan, followed by S and H lignin (Figure 5b). Further compounds released by thiacidolysis were C6C2, C6C1 monomeric compounds, and some derived from p-coumaric and ferulic acid aromatic compounds (Supporting Information S1: Figure S5). The H, G, and S core fragments, including all monomers composed only of the H, G, and S aromatic ring, were similar to uncondensed lignin results. Aromatic derived products are not significantly different in between treatments and each root zones, but the amount increases over the root length (Supporting Information S1: Figure S5).
RNA-Seq analyses: comparison of strong water stress versus control of the two barley cultivars.
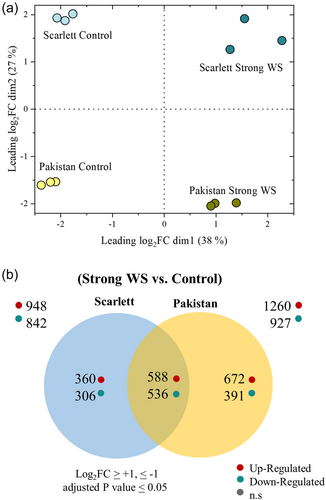
For RNA-Seq analysis root zone A (0%–12.5%), showing the largest differences in the degree of apoplastic barrier formation (Figures 3-5), was investigated comparing strong WS with control conditions. The MDS plot showed a clear separation of all the control (well-watered) samples from the strong WS samples and clear separation of both cultivars (Figure 6a). About 43 050 expressed genes were identified in the different samples, which corresponds to roughly 50% of the barley reference genome consisting of about 83 381 expressed genes (Sato, 2020). In Scarlett, comparing strong WS versus control, a total of 948 genes were differentially upregulated and 842 genes were downregulated, from which 360 up- and 306 downregulated genes were unique to Scarlett (Figure 6b, Supporting Information S2: Table S1). With Pakistan, 1260 genes were up- and 927 genes were downregulated with 672 up- and 391 downregulated genes being specific for Pakistan (Figure 6b, Supporting Information S3: Table S2). Both cultivars had 588 up- and 536 downregulated genes in common.
A GO (Gene Ontology) analysis was performed with all the DEGs of both cultivars in response to strong WS (Supporting Information S1: Figure S6, Supporting Information S4: Table S3). Most GO terms associated with the upregulated genes in the two cultivars were related to general aspects of abiotic stress responses of plants and associated signalling and transduction aspects. In Scarlett, the top upregulated GO terms were mostly associated with ROS, H2O2 metabolism, heat shock proteins (Supporting Information S1: Figure S6a). In Pakistan, the top upregulated GO terms were related to certain aspects of ROS detoxification, glutathione metabolic process, glutathione transferase activity and nicotinamine metabolic activity (Supporting Information S1: Figure S6b). The common upregulated GO-terms in both cultivars were associated with several aspects of stress signalling, phytohormone signal, cold acclimation, actin filament depolymerisation and response to abscisic acid (Supporting Information S1: Figure S6c). In Scarlett GO terms with most downregulated genes were related to aldehyde dehydrogenase activity, nutrient reservoir activity and manganese ion activity (Supporting Information S1: Figure S6d). Further categories included GO terms associated with cell walls, plasmodesmata and the apoplast. The top GO terms contained the most downregulated genes specific to Pakistan included different aspects of detoxification like hydrogen peroxide catabolic processes, ROS metabolic processes and peroxidase activity (Supporting Information S1: Figure S6e). GO terms with most downregulated genes common for both cultivars were related to various aspects of nitrate metabolism and transport including response to nitrate, nitrate transmembrane transporter activity and nitrate transport (Supporting Information S1: Figure S6f).
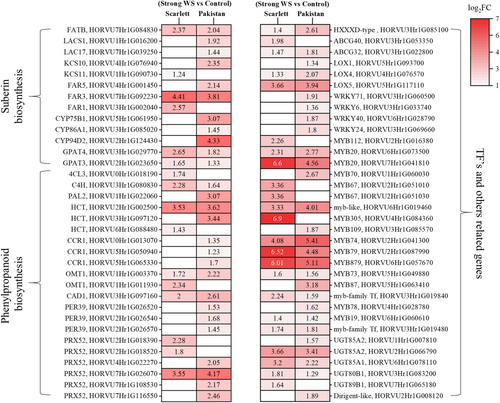
A number of DEGs (Figure 7, Supporting Information S5: Table S4) specifically upregulated in both cultivars in response to water stress were genes related to suberization (e.g., LACS: fatty acid activation, KCS: fatty acid elongation, FAR: alcohol synthesis, CYP: fatty acid hydroxylation, GPAT: esterification of fatty acids to glycerol, etc.), lignification (C4H: p-coumaric acid synthesis, PAL: cinnamic acid synthesis, HCT: shikimate hydroxycinnamoyl transferase, CCR: p-coumaryl- and coniferyl aldehyde synthesis, OMT: methyltransferase, CAD: p-coumaryl- and coniferyl alcohol synthesis, PER: lignin polymerisation, etc.) and transcription factors known to be involved regulating gene expression in response to abiotic environmental stress (e.g., WRKYs and MYBs). A smaller number of DEGs annotated as genes related to suberization and lignification were downregulated in roots exposed to water stress (Supporting Information S1: Figure S7, Supporting Information S5: Table S4). In addition, a series of DEGs were involved in nutrient (e.g., NRT: nitrate transport, PHT: phosphate transport, KT: potassium transport, MGT: magnesium transport, VIT: iron transport, SULTR: sulfate transport) and water transport (aquaporins) via cell membranes, with many of them being upregulated but some of them also downregulated (Supporting Information S1: Figure S8, Supporting Information S6: Table S5). For further information, the list of all the DEGs related to suberin, lignin, aquaporins, nutrient transporters, ROS signalling and other transcription factors are given in Supporting Information S7: Table S6.
4 DISCUSSION
In root research, hydroponic cultivation is frequently used since it allows easy, noninvasive access of the root system during growth. But this approach is artificial since roots are continuously immersed in an aqueous solution with homogeneously distributed nutrients. Cultivating plants in soil-filled rhizotrons are closer to the situation roots face in the field conditions such as mechanical impedances, soil structure, and so forth, when compared with hydroponic cultivation. But rhizotrons still allow the observation of root growth and development noninvasively (Nagel et al., 2012).
4.1 Nonlinear relationship between SWC and SWP
Water limitation in a substrate leading to drought needs to be quantified in MPa, giving the exact water potential. Only on this basis can different experimental approaches, for example, hydroponics versus soil cultivation, can directly be compared. Whereas, it is easy and straight forward to measure water potential in hydroponics, it is complex in soil. This is due to the fact that relative SWC (in %) versus SWP (in MPa) is not a linear function and this curve is strongly influenced by various factors such as soil texture, organic matter content, and soil moisture patterns (Groenevelt & Grant, 2004; Hewelke et al., 2015). Due to this nonlinearity (Chen et al., 1998), shown here for soil used in our rhizotron experiments, already minor changes in relative SWCs can lead to major changes in SWPs (Figure 1). Decreasing the relative SWC by 1.3-fold (from 54% to 41%) resulted in a decrease of the SWP by nearly threefold (from −0.37 to −1.04 MPa). This shows how important it is to first establish an exact calibration curve correlating SWP with SWC (Nimah & Hanks, 1973; Or et al., 2002). This is also confirmed by our study, with the soil initially drying out to have a relative SWC of approximately 50%, it finally turned out after the experiment 12 days later that relative SWC was only 54.3% in 2021 and 41.3% in 2022, resulting in SWPs of −0.37 MPa (mild WS) and −1.04 MPa (strong WS). SWCs and SWPs were homogeneous in the rhizotron from top to bottom (Supporting Information S1: Figure S1). Thus, in our experiments roots were exposed over their whole length, from tip to base, to nearly the same water deficit. This is still somewhat artificial compared with natural environmental conditions, with the soil drying out from top to bottom leading to an increasing water potential gradient.
4.2 Comparing root development between wild barley and modern barley
Breeding programmes mostly focus on aboveground plant traits and not on root morphology or architecture (Koevoets et al., 2016). However, root length is an important trait of plants when dealing with water stress (Bengough et al., 2011; Boudiar et al., 2020; Sahnoune et al., 2004). With Pakistan, as the wild barley cultivar, compared with the highly cultivated modern cultivar Scarlett, there was a tendency that in either control or stress conditions, average root lengths (Figure 2a), maximum root system depth (Supporting Information S1: Figure S2a) and total seminal and nodal root lengths (Supporting Information S1: Figure S2b) were higher. Root length is directly correlated to the total root surface area that is accessible to soil water volume and thus dissolved nutrients (Dara et al., 2015). In hydroponic cultivation, similar results were previously observed for different wild cultivars when compared with modern cultivars (Kreszies et al., 2020; Paschen et al., 2022). The formation of longer roots in wild cultivars is obviously genetically fixed and will offer an advantage under drought conditions as the availability of water in deeper soil layers will be higher (Ahmed et al., 2018; Lynch & Wojciechowski, 2015; Naz et al., 2014). Roots of 12-days-old barley plants grown hydroponically under control and osmotic stress were approximately about 1.5–3-fold shorter for both cultivars (Kreszies et al., 2019, 2020) compared with soil grown roots (Supporting Information S1: Figure S9a,b). This clearly indicates that soil cultivation significantly affects root development. A possible explanation might be the fact that in hydroponic cultivation, roots are growing in a homogeneously mixed nutrient solution, which does not require an extensive root system for soil exploration and nutrient and water uptake. The root/shoot ratios increased (Figure 2c) in response to water stress, which was also observed recently with barley cultivated in hydroponics (Kreszies et al., 2019, 2020).
4.3 Comparing suberization between wild barley and modern barley
In both cultivars, endodermal root suberization detected by histochemistry was already clearly visible in control conditions between 5% and 10% distance from the root tip (Figure 3a). Only in the zone between 0% and 5% from the root tip, no suberized cells were histochemically detected (data not shown). At 25% from the root tip, nearly all endodermal cells in both cultivars were fully suberized in control as well as stress conditions (Figure 3a). These histochemical results are very different from hydroponically grown roots (Kreszies et al., 2019, 2020). In hydroponic cultivation, under control conditions as well as in response to osmotic stress (−0.4, −0.8, and −1.2 MPa) first suberized cells could only be detected earliest at 25% from the root tip in hydroponic experiments. Thus, in soil-grown roots endodermal suberization is extending significantly closer to the root tip, it starts already at 5% from the root tip and 75%–80% of the root length are nearly fully suberized. This observation was confirmed by the detailed chemical analysis (Figure 4; Supporting Information S1: Figure S4). Whereas the qualitative suberin composition (substance classes and chain lengths of the detected monomers) was similar between the two cultivars and the cultivation conditions (soil vs. hydroponic cultivation; Supporting Information S1: Figure S9c), total amounts of suberin were significantly (about twofold) higher in each of the three root zones in soil-cultivated roots. Thus, soil-environment under control conditions stimulates the root to a much higher and much faster root suberization compared with hydroponic cultivation.
4.4 Comparing lignification between wild barley and modern barley
Besides suberization, lignification represents another well-known nonspecific response of plant cell walls to abiotic stress, which includes oxidative stress besides water limitation (Cabané et al., 2004). Histochemistry (Figure 3b) as well as chemical analysis (Figure 5; Supporting Information S1: Figure S5) showed that the lignification of endodermal cell walls and xylem vessels was significantly increased in response to increasing water deficits. An enhanced lignification of root cell walls in response to water deficit was described earlier in different crop species (Fan et al., 2006; Kováč et al., 2018; Ouyang et al., 2020; Steudle, 2000a; Yang et al., 2006). The increased levels of cell wall lignification can help to prevent embolism of xylem vessels (Lens et al., 2016), stabilize dehydrated tissue (Sharma et al., 2020; Yamaguchi et al., 2010), and provide support and protection against mechanical stress in dehydrating soil (Schneider et al., 2021). The induction of the tertiary developmental state of the endodermis was observed at 90% of the root length close to the base (Supporting Information S1: Figure S10). Histochemically, the inner U-shaped endodermal cell walls (Enstone et al., 2002; Esau, 1953; North & Nobel, 1995; Ouyang et al., 2020) were strongly responding to lignin staining (Supporting Information S1: Figure S10) whereas the suberin signal was limited to the outer periclinal cell walls (Supporting Information S1: Figure S10). Probably due to a strong lignification of the added U-shaped cell wall the suberin signal in the inner periclinal cell wall was masked. This was also observed in roots of other plant species (Zeier & Schreiber, 1998; Zeier, Goll, et al., 1999; Zeier, Ruel, et al., 1999).
4.5 Comparing differential gene expression between wild barley and modern barley
The enhanced lignification and suberization was also supported by the transcriptomic analyses. Several genes related to the biosynthesis of aliphatic monomers of suberin and to the phenylpropanoid pathway were upregulated in both Scarlett and Pakistan (Figure 7; Supporting Information S5: Table S4). This supports the important function of suberization and lignification in dealing with water stress in barley. Apoplastic suberization is also described to prevent the passive backflow of water from the xylem vessels in the central cylinder into the soil, which is of major importance under water stress conditions (Steudle, 2000a; Steudle & Peterson, 1998). The upregulation of quite a number of genes related to suberization and lignification in soil-grown roots confirmed recent RNAseq studies conducted with hydroponically grown roots (Kreszies et al., 2019, 2020).
Besides the upregulation of suberin- and lignin-related genes, the RNAseq analysis revealed a series of other additional genes that were differentially expressed in both cultivars in response to water stress (Supporting Information S7: Table S6). Additionally, ubiquitous transcription factors (WRKY, MYB, NAC, ERF, etc.) were upregulated, having multiple roles in a variety of plant processes such as development, stress response, and acclimatization to abiotic stress (Dasauni & Nailwal, 2020; Gangola & Ramadoss, 2020; Ramadoss et al., 2020; Wang et al., 2023). Besides osmotic adjustment, tolerance to water deficit also requires that the mechanical stability of the cells and tissues is ensured (Dutta et al., 2016; Izanloo et al., 2008). This explains why besides lignification, many GO terms related to cell wall, plant-type cell wall, plant-type cell wall organization or biogenesis, cell wall organization or biogenesis are differentially enriched in water-stressed roots (Supporting Information S4: Table S3).
Recent studies with hydroponically grown roots showed that the apoplastic water transport in roots decreased with increasing suberization (Kreszies et al., 2019; Ranathunge et al., 2017) and that the nonsuberized or partially suberized root zone close to the root tip is mainly be responsible for water and nutrient uptake. In addition, water transport in roots can be significantly facilitated by aquaporins (Gambetta et al., 2017), which were in fact upregulated in the stressed plants in the root tip (NIP5;1, NIP1;2 and TIP4;1; Supporting Information S1: Figure S8). In parallel genes related to nutrient uptake and transport, including phosphate, ammonium, iron, and magnesium transport, were upregulated. Macro and micronutrients are particularly crucial for plant growth and development, and they are also essential for contributing to several aspects of stress tolerance as osmotic adaptation (Kumari et al., 2022).
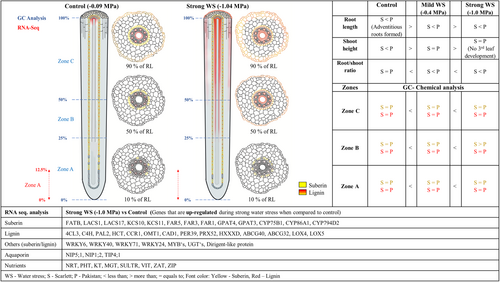
Overall, upon decreasing SWP, root lengths decreased, amounts of aliphatic suberin and lignin increased, and genes related to suberin and lignin biosynthesis were upregulated (Figure 8). Compared with hydroponic cultivation, soil-grown roots were longer, suberization started much closer to the root tip and amounts of suberin were higher indicating clear differences between both ways of cultivation (Supporting Information S1: Figure S9). Comparing the drought stress response of the cultivar Scarlett (H. vulgare ssp. vulgare) with the wild barley accession Pakistan (ICB181243; H. vulgare ssp. spontaneum) it is obvious that Pakistan developed longer roots. This will be of major advantage under water limited conditions, since it should offer better access to deeper, less dehydrated soil horizons. This aspect of root lengths should be considered in future breeding approaches improving drought resistance in crops.
ACKNOWLEDGEMENTS
Thanks to Tino Kreszies and Kosala Ranathunge for discussing the data with us and to the NGS Core Facility of the Bonn University Hospital for performing the transcriptomic sequencing. The work was funded by the Deutsche Forschungsgemeinschaft (DFG, German Research Foundation) – Projektnummer: 511193270, and through POF-Funding of the Helmholtz Association. The authors declare that they have no competing interests. Open Access funding enabled and organized by Projekt DEAL.
CONFLICT OF INTEREST STATEMENT
The authors declare no conflict of interest.
Open Research
DATA AVAILABILITY STATEMENT
The data that support the findings of this study are openly available in NCBI at https://www.ncbi.nlm.nih.gov/, reference number PRJNA1063280.


