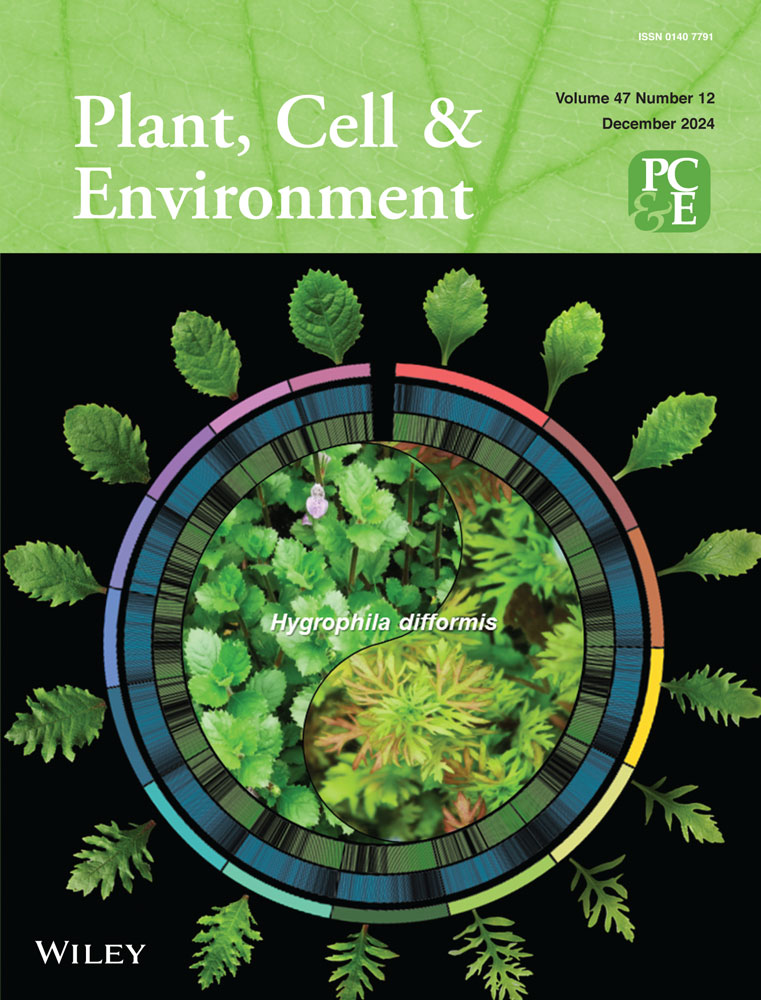
The invertase gene PWIN1 confers chilling tolerance of rice at the booting stage via mediating pollen development
Abstract
Pollen fertility is a primary regulator of grain yield and is highly susceptible to cold and other environmental stress. We revealed the roles of rice cell wall invertase gene PWIN1 in pollen development and chilling tolerance. We uncovered its preferential expression in microspores and bicellular pollen and identified its knock-down and knock-out mutants. pwin1 mutants produced a higher proportion of abnormal pollen than wild-type plants. The contents of sucrose, glucose, and fructose were increased, while ATP content and primary metabolism activity were reduced in the mutant pollen. Furthermore, the loss of function of PWIN1 coincided with an increase in SnRK1 activity and a decrease in TOR activity. Under chilling conditions, pwin1 mutants displayed significantly reduced pollen viability and seed-setting rate, while overexpressing PWIN1 notably increased pollen viability and seed-setting rate as compared with the wild-type, indicating that PWIN1 is essential for rice pollen development and grain yield under cold stress. This study provides insights into the molecular mechanisms underlying rice pollen fertility during chilling stress, and a new module to improve chilling tolerance of rice at the booting stage by molecular design.
1 INTRODUCTION
It is estimated that food production will need to increase by 60% in 2050 to cope with the increasing population (Tian et al., 2021). Rice (Oryza sativa L.) is grown in more than 100 countries, and is an important staple crop for about half of the world's population. It originates from tropical and subtropical regions, and is highly sensitive to cold stress. The cold stress, which includes chilling and freezing stress, frequently occurs in the rice growing area, and threatens the productivity of rice (Arshad et al., 2017). Therefore, developing new cold-tolerant rice varieties with high-yielding potential is urgently needed through molecular design, which depends on understanding the molecular mechanisms underlying the regulation of cold tolerance (Zhang et al., 2019).
Cold stress causes yield loss by affecting source set-up and sink formation, such as seedling survival and pollen development at the booting stage. A variety of genes involved in cold tolerance have been cloned in rice. OsTPP1 (Pramanik and Imai, 2005), LTG3-1 (Fujino et al., 2008), COLD1 (Ma et al., 2015), OsICE1 (Zhang, Li, Li, et al., 2017), OsPP2C27 (Xia et al., 2021), OsCNGC9 (Wang et al., 2021), COG1 (Xia et al., 2023), OsUBC12 (Zhang et al., 2024), and OsNAC5 (Li et al., 2024) were involved in cold tolerance at the seedling or seed germination stage. F-box protein CTB1 interacted with E3 ubiquitin ligase Skp1 to participate in cold tolerance at the booting stage (Saito et al., 2010). In addition, leucine-rich repeat receptor-like kinase CTB4a (Zhang, Li, Pan, et al., 2017), transcription factor bZIP73 (Liu, Schläppi, et al., 2019), WRKY53 (Tang et al., 2022) and the PHD-finger domain-containing protein qCTB7 (Yang et al., 2023), UDP-glucose sterol glucosyltransferase CTB2 (Li et al., 2021), OsMKKK70 (Mei et al., 2022), and LTT1(Xu et al., 2020) have also been shown to associated with cold tolerance at booting stage. Pollen fertility is highly sensitive to cold and other environmental stress. Cold stress-induced pollen sterility can result from aberrant pollen development and pollen tube dysfunction (Arshad et al., 2017; Shimono et al., 2016). The early development of pollen is the most sensitive to cold stress. However, little is known about molecular mechanisms underlying the cold tolerance of pollen.
Pollen development from microspores involves two rounds of mitosis. Young microspores released from tetrads first undergo size enlargement, vacuolization and polarization. The polarized microspore experiences asymmetrical mitosis to generate two daughter cells with distinct identities and fates. The large vegetative cell acts as a companion cell of germ cells and transports nonmotile sperm cells to the embryo sac for double fertilization via a polarly growing pollen tube during pollination, while the small generative cell swallowed in the vegetative cell undergoes further mitosis to generate two sperm cells. Microspore mitosis is determinant for programmed pollen development (Berger and Twell, 2011; Hackenberg and Twell, 2019). Studies of Arabidopsis have revealed several genetic factors required for microspore mitosis. Lateral organ boundary domain (LBD) protein SCP was required for the orientation of microspore division, and mutation in this gene led to an extra vegetative cell; protein kinase TIO or kinesin-12A/B was implicated in phragmoplast formation and expansion, and their defects led to two nuclei in one cell, thus failure in germ cell differentiation; GEM1 and GEM2 were required for microspore polarity and division, their defects caused equal division of microspores (Lee et al., 2007; Oh et al., 2005; Oh et al., 2010; Park et al., 1998; Park et al., 2004). Thus, correct compartmentation is necessary for the development and specification of microspore daughter cells, and subsequent sperm cells.
Pollen develops within anthers which supply nutrition for developing pollen by the innermost tapetum (Jung et al., 2005; Niu et al., 2013). Sucrose (Suc) is transported from photosynthesis sources to sinks, and utilized as the primary carbon and energy for sink organs. In sinks, unloaded sucrose is hydrolyzed irreversibly into glucose (Glc) and fructose (Fru) by invertase or reversibly into UDP-Glc and Fru by sucrose synthase (Braun et al., 2014), which are channeled into primary metabolism to generate energy and carbon skeleton fueling growth and development. According to subcellular location, invertases (INVs) are classified as cytoplasmic invertase, vacuolar invertase, and cell wall invertase (cwINV) (Juárez-Colunga et al., 2018; Wan et al., 2018). cwINVs ionically bind to the cell wall with a pH optimum of 3.5–5.0, and generally are considered for supplying sink sugar. cwINVs from different plants including rice appeared expression in specific tissues or cells, such as in the endosperm transfer cell of maize, phloem of rice grains, and tomato fruits; elevating cwINV activity in tomato seeds or expression levels in rice and maize seeds increased seed weight, and vice versa (Cheng et al., 1996; Jin et al., 2009; Ruan et al., 2010; Wan et al., 2018; Wang et al., 2008). Studies also showed that the limitation of carbohydrate supply in tobacco anthers by antisense repression of anther-expressed cwINV NIN88 led to pollen sterility (Engelke et al., 2010; Goetz et al., 2001). These data demonstrated the importance of cwINV in the carbohydrate supply of sinks (Ruan et al., 2010; Wan et al., 2018). Impressively, recent studies demonstrated the implication of cwINVs in signaling beyond carbohydrate supply. In tomato fruit, increasing cwINV activity suppressed heat shock-induced programmed cell death, and induced expression of resistant genes (Liu et al., 2016b; Ru et al., 2017). In Arabidopsis, cwINV was required for ovule initiation by modulating a set of genes including auxin response genes and transcription factors (Liao et al., 2020). But, we know very little about the essence of cwINVs-mediated signaling.
The evolutionarily conserved kinase complexes SnRK1 and TOR are central regulators of plant growth, development, and environmental adaption in response to nutrient and energy status. Generally, SnRK1 is activated by energy deficiency and mainly functions in stress response, while sugar supply activates TOR to promote cell proliferation and growth (Baena-Gonzalez and Hanson, 2017; Lastdrager et al., 2014; Margalha et al., 2019). Sucrose- and glucose-mediated TOR activation was involved in root and shoot meristem function in Arabidopsis (Li et al., 2017; Xiong and Sheen, 2012, 2013; Xiong & McCormack, Li, et al., 2013). Yeast SNF1 and animal AMPK, the homologs of plant SnRK1, have been confirmed as upstream negative regulators of TOR; but in plants, SnRK1 and TOR appeared to act independently, only partial downstream effects of SnRK1 were probably mediated by TOR (Lastdrager et al., 2014; Margalha et al., 2019; van Dam et al., 2011).
Here, we revealed preferential expression of PWIN1, a member of the rice cell wall INVs group, in microspores and bicellular pollen, and identified its knock-down and knock-out mutants, and overexpression lines. PWIN1 was required for pollen development and chilling tolerance. It appeared to regulate pollen development and chilling tolerance not through directly targeting sugar supply, but through affecting primary metabolism, energy homeostasis, and SnRK1 and TOR signaling. PWIN1-mediated chilling tolerance of pollen was associated with the seed setting rate of chilling-treated rice plants, thus indicating the essential roles of PWIN1 in chilling tolerance of rice at the booting stage.
2 RESULTS
2.1 PWIN1 is preferentially expressed in microspores and bicellular pollen
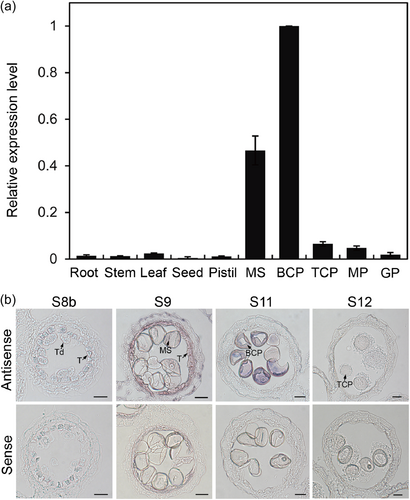
Our transcriptomic study of rice pollen from the microspore to germinated pollen stages revealed a microspore- and bicellular pollen-preferential cwINV gene (Fig S1A) (Wei et al., 2010). The gene encoded a polypeptide of 586 amino acid residues with the sequence characteristic of cwINVs (Fig S1B), thus termed PWIN1 (pollen wall invertase 1). This gene was previously reported to be highly expressed in young anther walls, but undetectable in tapetal cells and mature anthers (Oliver et al., 2005). Here, We further isolated microspores (MS), bicellular (BCP), tricellular pollen (TCP), mature pollen (MP), and germinated pollen (GP), to examine PWIN1 expression in developing pollen and different tissues. We demonstrated its absence in pistils and seeds along with vegetative tissues. In developing pollen, PWIN1 was expressed preferentially in microspores and bicellular pollen, whereas almost undetectable at other stages (Figure 1a). The preferential expression of PWIN1 in microspores and bicellular pollen was confirmed by in situ hybridization which also showed the transient presence of PWIN1 transcripts in tapetal cells at the microspore stage of anther development (Figure 1b).
2.2 PWIN1 is implicated in pollen development
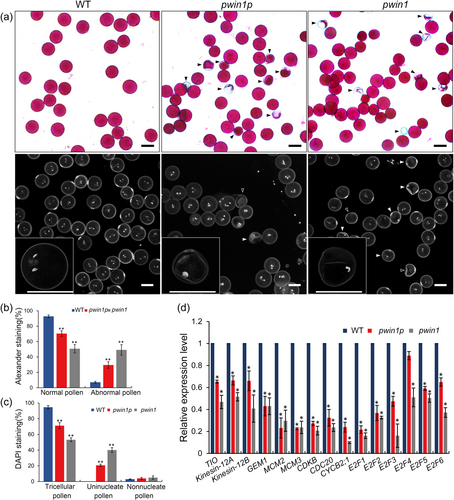
To dissect the function of PWIN1, we obtained two independent allelic mutants: pwin1p and pwin1. The former has a 49 bp deletion in the promoter region, which significantly reduced the expression of PWIN1, and the latter harbored a premature stop codon at the target site (Fig S2A and S2B). These mutants grew normally, and displayed normal panicles, floral organs, and flowering (Fig S2C and S2D); their seed-setting rate appeared not different from the WT (Fig S2E and S2F). Thereafter, we examined pollen viability using Alexander staining. Most WT pollen grains (about 94%) were viable (stained purple) and looked round and uniform in size, however, a remarkable proportion of mutant pollen grains were abnormal (no stained, lightly stained, small in size, empty or/and wrinkled) (Figures 2a and 2b). This indicated the involvement of PWIN1 in pollen development. To clarify which cytological events of pollen development were affected, we examined nuclei of mature pollen using DAPI staining. About 94% of WT mature pollen grains had two condensed sperm nuclei and one loosely vegetative nucleus, characteristic of normal mature rice pollen, whereas the three-nuclei pollen grains were markedly reduced in pwin1p and pwin1; most of these abnormal pollen grains appeared only to have one condensed nucleus (Figures 2a and 2c), indicating defective pollen cell division. The genetic transformation of WT PWIN1 successfully rescued the defective pollen development in the mutants (Fig S3). Moreover, we showed significant downregulation of rice homologs of TIO, kinesin-12A/B and GEM1 which are essential for the microspore division (Lee et al., 2007; Oh et al., 2005; Oh et al., 2010; Park et al., 1998; Park et al., 2004), and cell cycle genes MCM2/3, CDKB, CDC20, CYCB2;1, and E2Fs in the mutant pollen as compared with WT pollen (Figure 2d). Collectively, these data indicated that PWIN1 affected pollen development.
2.3 Mutations in PWIN1 appear not to affect sugar supply but compromise primary metabolism and energy homeostasis of pollen
Generally, cwINVs are considered to function mainly in supplying carbohydrates to sinks by irreversibly hydrolyzing Suc into Glc and Fru (Wan et al., 2018). Thus we detected Suc, Glc, and Fru in MS, BCP, TCP, and MP from WT and mutant plants. Mutant pollen from MS to MP stages accumulated higher levels of Suc, Glc, and Fru than WT (Figure 3a-c), which indicated that mutations in PWIN1 did not affect the sugar supply of pollen. This suggested a possible defect in primary metabolism.
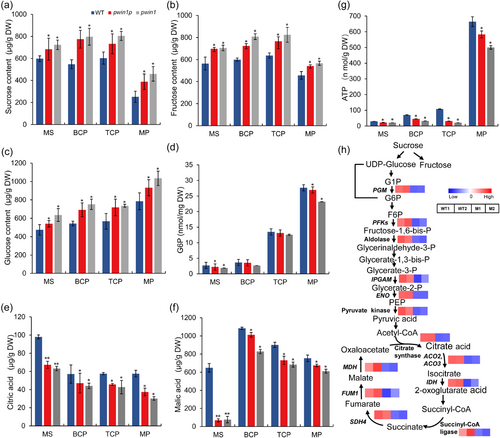
To flow into primary metabolism in a cell, Glc first needs to be phosphorylated by hexokinase into Gluc-6-phosphate (G6P), which is further channeled into glycolysis and tricarboxylic acid (TCA) cycle to generate ATP and carbon skeleton by the synergistic action of multiple enzymes (Ruan, 2014). We thus examined the contents of G6P, citric, and malic acids which are two important intermediates of the TCA cycle, and ATP in developing pollen. The content of G6P was lower only in MS and MP of mutants than in WT (Figure 3d). The contents of citric and malic acids were significantly reduced in all mutant pollen as compared with WT, with a reduction of 33.42% and 88.83% in mutant MS, respectively (Figures 3e and 3f). Consistently, ATP content was lower in mutant pollen than in WT pollen at all tested stages (Figure 3g). Citric acid is synthesized by citrate synthase-mediated irreversible condensation of acetyl-CoA with oxaloacetate; the acetyl-coA is from glycolysis, and the oxaloacetate is from malate dehydrogenation catalyzed by malic dehydrogenase. The deficiency of the two TCA intermediates in mutant pollen urged us to investigate genes related to glycolysis and the TCA cycle. We found that glycolysis- and TCA cycle-related genes including those encoded citrate synthase and malic dehydrogenase were significantly downregulated in the mutant (Figure 3h). Our data also revealed the dynamic of energy during rice pollen development (Figure 3g). ATP was generally at low levels in MS, BCP and TCP, while at a high level in MP (Figure 3g), which may reflect different developmental status of the pollen. The early pollen has an active energy-consuming biosynthetic process, while mature pollen mainly stores nutrients and energy ready for pollination. Collectively, these results demonstrated that mutations in PWIN1 compromised primary metabolism and energy homeostasis.
2.4 Mutations in PWIN1 affect SnRK1-TOR activity and pollen transcriptome
SnRK1 and TOR are central regulators to shape plant growth and development, and environmental adaption by sensing nutrient and energy homeostasis (Baena-Gonzalez and Hanson, 2017; Broeckx et al., 2016). SnRK1 activity requires phosphorylation of its catalytic α subunit (SnRK1α), while TOR phosphorylates its conserved target 40 S ribosomal S6 protein kinase (S6K), which in turn phosphorylates ribosomal protein S6 (RPS6), and the phosphorylation of S6K and RPS6 is generally used to evaluate TOR activity in vivo (Dobrenel et al., 2016; Rodriguez et al., 2019; Xiong and Sheen, 2012). The defective primary metabolism and energy homeostasis in the mutants inspired us to assess the activity of SnRK and TOR by detecting the phosphorylation of SnRK1α and S6K/RPS6, respectively. Western blot analysis revealed protein levels of SnRK1α, S6K, and RPS6 were similar in WT, pwin1p and pwin1, but the phosphorylated form of SnRK1α (p-SnRK1α) was significantly increased in pwin1p and pwin1, whereas phosphorylated S6K (p-S6K) and RPS6 (p-RPS6) were notably decreased in pwin1p and pwin1 (Figures 4a and 4b). This suggested that mutations in PWIN1 appeared to cause SnRK1 activity increase and TOR activity reduction, respectively. To examine the roles of TOR in pollen development, we generated OsTOR-RNAi lines, and 7 out of 8 knockdown lines (OsTOR expression reduced to below 50%) displayed partial pollen sterility and increased proportions of uninucleate or no nucleus pollen as compared with WT (Figure S4), thus demonstrating that TOR was required for pollen development.
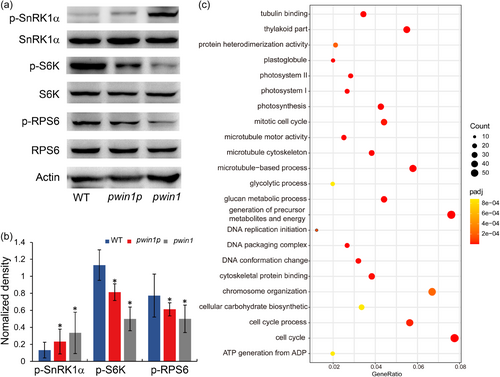
To further understand how PWIN1 regulates pollen development, we revealed 6458 differentially expressed genes between young pwin1 and WT anthers (Padj <0.001) with 3495 down- and 2963 upregulated in the mutant (Fig S5A). This indicated that the mutation affected the transcriptome. These downregulated genes had enriched Gene Ontology (GO) terms DNA and chromosome organization, cell division, tubulin skeleton, and primary metabolism, while the upregulated genes contained enriched GO terms mitochondrial organization, respiratory electron transport, and structural molecule activity (Figure 4c, Fig S5B). Thus, the changed transcriptome had the characteristic of gene expression profiles mediated by activated SnRK1 and/or inhibited TOR (Kim et al., 2014; Margalha et al., 2019; Ren et al., 2011; Rodriguez et al., 2019; Shin et al., 2012; Xiong and Sheen, 2013; Xiong & McCormack, Li, et al., 2013). These results suggested the involvement of the two kinase complexes in PWIN1-mediated pollen development.
2.5 PWIN1 improves the seed yield of chilling-treated rice at the booting stage
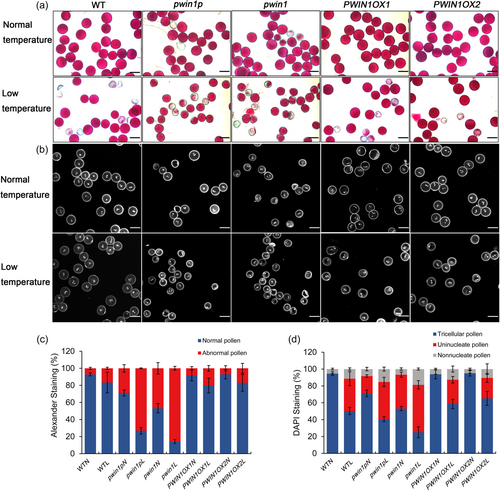
We showed that mutations in PWIN1 slowed down pollen primary metabolism, decreased ATP content, and caused SnRK1 activity increase and TOR activity reduction. Metabolic machines generally have a strong buffer capacity to let organisms adapt to changing internal and external environments, and the defective primary metabolism and energy homeostasis might compromise the environmental stress tolerance of developing pollen. The two kinase complexes are involved in multiple stress including cold stress responses (Margalha et al., 2019; Rodriguez et al., 2019). Thus, we further dissected whether PWIN1 played a role in the chilling tolerance of rice. To do this, we obtained independent transgenic lines over-expressing PWIN1 (PWIN1OX) (Figure S6), and evaluated the chilling tolerance of WT, mutant and PWIN1OX plants at the booting stage by examining pollen activity and seed setting rate (Figures 5 and 6, Figure S6). The chilling treatment did not affect rice growth and panicle development, but affected pollen development (Figure 5, Figure S6). Under normal temperatures, most pollen grains of WT and PWIN1OXs were normal (stained purple, and uniform in size) in Alexander staining, and trinuclear in DAPI staining, while pwin1p and pwin1 mutants had much more abnormal pollen (no stained, lightly stained, wrinkled, small in size) in Alexander staining, and more non-trinuclear pollen in DAPI staining than WT and PWIN1OXs (Figure 5). Compared with the control, the chilling treatment markedly reduced the percentage of Alexander-stained normal pollen (Figures 5a and 5c), and significantly increased the proportion of non-trinuclear pollen in mature pollen of these genotypic plants (Figures 5b and 5d). The sensitivity of pollen to chilling was genotype-dependent: pwin1 was the most sensitive, pwin1p the second, WT the third, and PWIN1OXs the least (Figure 5). This demonstrated that chilling stress significantly affected pollen cell division and development. Collectively, these results indicated that PWIN1 was required for chilling tolerance of developing pollen.
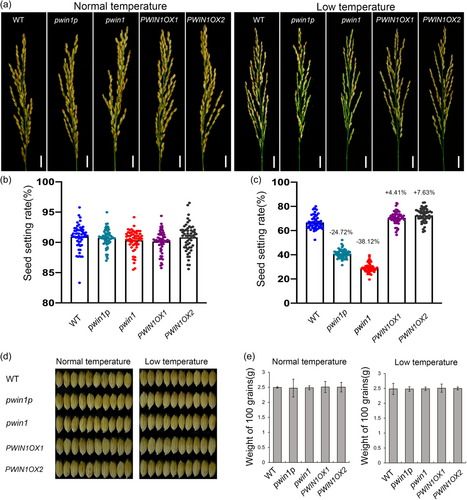
The output of reproductive development is grain yield in food crops such as rice, which is crucial for grain production. Thus, we finally evaluated grain yield by seed setting rate. All these PWIN1 genotypes of rice showed normal seed setting (more than 91%) under normal temperatures, but displayed reduced seed setting rate when subjected to chilling stress (Figures 6a, 6b and 6c). The seed setting rate was reduced by 61.56% in pwin1, 49.06% in pwin1p, 24.48% in WT, 19.43% in PWIN1OX1, and 16.47% in PWIN1OX2 under chilling treatment as compared to the control. The sensitivity of seed setting to chilling was also genotype-dependent. Furthermore, the mutations in PWIN1 significantly decreased the seed setting rate (by 38.12% in pwin1 and 24.72% in pwin1p), while overexpressing PWIN1 appeared to increase the seed setting rate (by 4.41% in PWIN1OX1, and 7.63% in PWIN1OX2) as compared with WT under chilling stress (Figure 6c). Because the chilling treatment appeared not to affect grain size and hundred seed weight (Figures 6d and 6e), the difference among the seed setting rates of different genotypic rice represented their difference in grain yield. Therefore, these data demonstrated that PWIN1 deficiency greatly decreased grain yield, while overexpressing PWIN1 markedly increased grain yield as compared with WT under chilling stress. Thus, PWIN1 was required for the grain yield of chilling-treated rice.
3 DISCUSSION
We have revealed preferential expression of PWIN1 in microspores and bicellular pollen during rice pollen development and showed that this gene affected pollen cell division and development, and chilling tolerance of developing pollen. In contrast to observations on the general roles of cwINVs in fruit and grain development through supplying sink sugar (Jin et al., 2009; Liu et al., 2016; Liu, Schläppi, et al., 2019; Wang et al., 2008), the content of sucrose, glucose, and fructose showed a concurrent increase in pwin1 pollen. We proposed two possible explanations. First, the early pollen has an active energy-consuming biosynthetic process, and PWIN1 deficiency slowed down pollen primary metabolism, and in turn affected sugar consumption. Consistent with this explanation, our data demonstrated that ATP was generally at low levels in MS, BCP and TCP, while at a high level in MP. Alternatively, there may be other invertases or sucrose synthases channeling sugar into pollen. Second, PWIN1 might affect pollen development and chilling tolerance not through directly targeting sugar supply, but through influencing primary metabolism, energy homeostasis, and SnRK1 and TOR signaling. Evidenced were below: mutations in PWIN1 appeared to lead to (1) accumulation of sucrose and hexose in pollen, (2) defective primary metabolism and energy homeostasis, (3) SnRK1 activity increase and TOR activity reduction, (4) wide-range transcriptomic changes. The transcriptomic changes repressed genes associated with cell cycle and its related process, and primary metabolism, and induced genes related to mitochondrial organization and respiratory electron transport, which seems agree with characteristics of gene expression profiles mediated by activated SnRK1 and/or inhibited TOR (Kim et al., 2014; Margalha et al.,2019; Ren et al., 2011; Rodriguez et al., 2019; Shin et al., 2012; Xiong and Sheen, 2013; Xiong, McCormack, Li, et al., 2013).
In plants, SnRK1 and TOR generally act independently, SnRK1 is activated by energy deficiency, while TOR is activated by sugar supply (Margalha et al., 2019; Rodriguez et al., 2019; Xiong and Sheen, 2013; Xiong, McCormack, Li, et al., 2013). We showed that deficient PWIN1 appeared to increase SnRK1 activity and reduce TOR activity. The active pattern was compatible with defective ATP and primary metabolism, but not with the accumulation of Suc and Gluc in the mutants. It is possible that energy deficiency may be a potential inhibitor of TOR. Alternatively, SnRK1 might act as an upstream negative regulator of TOR in pollen, at least in rice pollen; the energy deficiency-activated SnRK1 in turn inhibited TOR activity. This notion might explain the coordination of changes in the activity of SnRK1 and TOR. In addition, evidence from Arabidopsis has revealed enhanced phosphorylation of P6K in snrk1 mutants (Nukarinen et al., 2016). Our study thus provides insights into the roles of SnRK1 and TOR in plants, however further study needs to dissect the mechanism underlying their synergistic action.
Consistent with the involvement of SnRK1 and TOR in multiple stress responses, a recent study showed increased cold sensitivity of Arabidopsis TOR-RNAi lines (Dong et al., 2019), but little is known about the roles of the two kinase complexes in the cold tolerance of plants. We showed that PWIN1 conferred chilling tolerance of developing pollen, and thus was required for pollen fertility and seed setting. The PWIN1 expression level positively correlated with the chilling tolerance of developing pollen and grain yield under chilling stress. This seemed to associate with its roles in affecting SnRK1 and TOR activity and transcriptomic changes, and this changed transcriptome was skewed to cell cycles and related processes (see above). In rice, regulation of the cell cycle was crucial for cold tolerance (Ma et al., 2009). This study revealed a mechanism underlying the chilling tolerance of rice at the booting stage, and suggested that the microspore minght be a primary site highly sensitive to chilling stress. In addition, we found that cold treatment of 24 h at the booting stage decreased PWIN1 expression at certain levels (Fig S7), but the biological significance of this expression regulation in cold stress response remains unknown.
We do not know how PWIN1 regulates pollen development and chilling tolerance through primary metabolism, energy homeostasis, and SnRK1 and TOR signaling, but the discussion above appears to support the model below. The extracellular matrix-localized PWIN1 might integrate extracellular information into cells by unknown partner(s), then affect primary metabolism, energy homeostasis, and SnRK1 and TOR activity by other unknown factors. The signaling pathway further regulates pollen development and chilling tolerance. Further work needs to identify these factors.
4 MATERIALS AND METHODS
4.1 Plant materials and growth conditions
Rice pwin1p and pwin1 mutants were obtained through editing PWIN1 of cultivar Nipponbare (Oryza sativa L. ssp. japonica) with the CRISPR/Cas9 system. The two mutants were genetically complemented with pPWIN1::PWIN1-FLAG, which was constructed by inserting the 6.8 kb genomic sequence of PWIN1 fused with FLAG into the BamH I site of pCAMBIA1301 vector. PWIN1-overexpressed lines were generated by genetically transforming Nipponbare with Ubi::PWIN1-GFP. The sequences of the primers used in these constructs were listed in Table S1. Rice plants were cultivated in an experimental field of the Institute of Botany, Chinese Academy of Sciences, Beijing, China, or in crop growth chambers under a 12 h photoperiod at 25°C for night and 35°C for day.
4.2 Chilling treatment
For testing the roles of PWIN1 in the chilling tolerance of rice at the reproductive stage, rice plants at the pollen mother cell stage were transferred to 18°C until the end of flowering. Subsequently, they were moved to normal growth conditions. For testing the expression of PWIN1 under cold treatment, Nipponbare plants were grown at 30°C(day)/20°C(night) under 12 h(light)/12 h(dark) cycles until rice panicles were pre-emerging. Rice plants were transferred to 20°C(Day)/12°C(night) for 24 h and apical spikelets at the uninucleate stage (checked by DAPI staining) were pooled for RT-PCR detection.
4.3 In situ hybridization
RNA probes were prepared with a DIG RNA Labeling Kit (Roche, Cat. 11175025910). A 247 bp template from the 3' end of PWIN1 cDNA was PCR amplified with primers WINF2 (CATAAGCTTCGACATCGCCAAGAACAAACAA) and WINR2 (CGTGAATTCTGCTGCTTGCTACTGCTGCTAC). DIG-labeled antisense and sense probes were transcribed using the pSPT18 vector, with RNA polymerase T7 and SP6, respectively. Rice anthers at different developing stages were fixed in ice-cold FAA fixative [48% ethanol, 5% (v/v) acetic acid 3.7% (v/v) formaldehyde, 0.1%(v/v) Trixton x-100], dehydrated in a graded ethanol series, cleared in ethylene substitute (Solarbio, Cat. YA0031), and embedded in Paraplast (Sigma, Cat. P3558). The hybridization and detection steps were largely performed as described in the DIG application manual for nonradioactive in situ hybridization (4th Edition), except that HCl treatment was omitted and 5 μg/mL proteinase K was used to increase the accessibility of tissue sections.
4.4 Alexander and DAPI staining
For pollen viability observation, mature pollen at anthesis was stained in Alexander's solution overnight at room temperature. For nuclei observation, mature pollen grains were fixed in Carnoy's solution (ethanol: acetic acid = 3:1) for 2 h at room temperature, then stained with 1 μg/mL DAPI solution (in 50% glycerol, 140 mM NaCl, 2.7 mM KCl, 10 mM Na2HPO4, 1.8 mM KH2PO4, pH 7.3). Stained pollen grains were observed under a microscope (Leica TCS SP5).
4.5 Determination of carbohydrates and organic acids
Pollen was collected, dried briefly at room temperature, and stored at −80°C until use. 100 µg ribitol was added to 100 mg pollen grains as an internal standard. These samples were homogenized in 0.75 mL 80% MeOH with the FastPrep-24 for 1 min, and centrifuged to collect the supernatant. The extraction was repeated three times. Combined supernatant was evaporated to dryness and re-dissolved in 500 µL ddH2O, then extracted with chloroform (1:1). A volume of 50 µL aqueous phase and dilutions of the standards (Sigma) were dried and derivatized with 50 µL (20 mg/mL) methoxylamine hydrochloride (Sigma) in anhydrous pyridine (Sigma) at 30°C for 1.5 h, then 80 µL N-methyl-N-(trimethylsilyl)-trifluoroacetamide (Sigma) was added and incubated at 37°C for 30 min. Derivatives were analyzed by GC-TOF-MS. The data were processed by using LECO Chroma TOF v3.32 (Leco Co) and the selected analyte ion masses were used to quantify the target compounds. Quantitative ions for ribitol, citric acid, fructose, glucose, and sucrose were at 217, 273, 217, 319, and 361 m/z according to fragments of standard compounds, respectively. Peak areas were collected for quantification.
4.6 Measurement of glucose-6-phosphate
The glucose-6-phosphate content was measured by using the Glucose-6-Phosphate Assay Kit (Abnova). 50 mg pollen grains were rapidly homogenized with 2–3 volumes of ice-cold PBS (0.1 M Na2HPO4, 0.1 M KH2PO4,0.1 M KCl,0.1 M NaCl, pH 6.5–8) with the FastPrep-24 for 1 min. After removing insoluble materials by centrifuge, 1–50 µL supernatant was added into duplicate wells of a 96-well plate, supplemented with 50 µL assay buffer, and mixed enough. The mixture was incubated in the dark at room temperature for 30 min and measured with a DU730 spectrophotometer at 450 nm (Beckman Coulter).
4.7 Measurement of ATP
The ATP content was measured based on the luciferase reaction of the ENLITEN ATP assay kit. For ATP extraction, 50 mg pollen supplemented with 0.2 mL of 5% trichloroacetic acid (w/v) was ground with the FastPrep-24 for 1 min, and centrifuged at 20,000 g for 5 min. The extraction was repeated three times and the supernatant was combined. 10 μL of the resultant supernatant was transferred into a tube containing 490 μL of 25 mM Tris-acetate buffer (pH 8.0). The bioluminescence was detected using a fluorometer.
4.8 RT-PCR and qRT-PCR analyses
Total RNAs were extracted from rice tissues by using the RNeasy Plant Mini Kit (QIAGEN). Isolated RNA was reversely transcribed by using SuperScript III reverse transcriptase (Invitrogen). The rice TUBULIN gene was used as the internal control of RT-PCR. qRT-PCR was performed by using SYBR Green Master Mix (Thermo Fisher) on an AB StepOne Plus system, and relative expression levels were calculated with the 2-ΔΔCT method (Livak and Schmittgen, 2001). 18 S gene was used as the reference. The sequences of the primers used in the experiments were listed in Table S1.
4.9 Transcriptomic analysis
RNA extracted from anthers around the microspore stage was dissected on a cBot Cluster Generation System by using TruSeq PE Cluster Kit v3-cBot-HS (Illumia). Differential expression was detected by using the DESeq. 2 R package. The resulting p-values were adjusted with Benjamini and Hochberg's approach for controlling the false discovery rate. Genes with Padj <0.001 found by DESeq. 2 were assigned as differentially expressed. Gene Ontology (GO) enrichment of differentially expressed genes was implemented by the clusterProfiler R package. GO terms with corrected p-value less than 0.05 were considered significantly enriched by differentially expressed genes.
4.10 Protein isolation and immunoblot
To detect the phosphorylation status of SnRK1α, S6K, and RPS6, total proteins were isolated from young panicles with extraction buffer [150 mM NaCl, 2 mM EDTA, 0.5% NP-40, 0.1% SDS, protease inhibitor cocktail (Roche) and PhosSTOP phosphatase inhibitor (Roche)]. Homogenates were centrifuged at 20,000 g for 5 min at 4°C to collect supernatant. Proteins were denatured at 100°C for 5 min, resolved on a polyacrylamide gel with a 4.5% stacking gel and a 10% separating gel, and transferred to a PVDF membrane. Thereafter, the PVDF membrane was blocked in Tris-buffered saline supplemented Tween 20% and 5% BSA for 1 h at room temperature with gentle shaking, then immunodetected according to the methods described previously (Zhang et al., 2006). Primary rabbit antibodies used were against SnRK1α (Cohesion, 1:1000), S6K (Abcam, 1:1000), RPS6 (Abcam, 1:1000), SnRK1α-phosphorylated (Cohesion, 1:1000), S6K-phosphorylated (Abcam, 1:1000) or RPS6-phosphorylated(Abcam, 1:5000), and Actin (Cohesion, 1:3000). Signals were visualized by using secondary HRP conjugated goat anti-rabbit antibody (Abcam, 1:10000).
ACKNOWLEDGEMENTS
We thank Fengqing Dong, Lu Wang, Jingquan Li, and Bing Han for their technical assistance, and Kang Chong, Yunyuan Xu, and Dongfeng Liu for their assistance with chilling treatment of rice. This work was supported by National Natural Science Foundation of China (Grant No. 32270370), and Chinese Academy of Sciences (grant XDA24010103, the Youth Innovation Promotion Association).
CONFLICT OF INTEREST STATEMENT
The authors declare no conflict of interest.
Open Research
DATA AVAILABILITY STATEMENT
All relevant data are provided in this article and its supporting information.


