Ghosts of dry seasons past: Legacy of severe drought enhances mangrove salinity tolerance through coordinated cellular osmotic and elastic adjustments
Abstract
The incidence and severity of global mangrove mortality due to drought is increasing. Yet, little is understood of the capacity of mangroves to show long-term acclimation of leaf water relations to severe drought. We tested for differences between mid-dry season leaf water relations in two cooccurring mangroves, Aegiceras corniculatum and Rhizophora stylosa before a severe drought (a heatwave combined with low rainfall) and after its relief by the wet season. Consistent with ecological stress memory, the legacy of severe drought enhanced salinity tolerance in the subsequent dry season through coordinated adjustments that reduced the leaf water potential at the turgor loss point and increased cell wall rigidity. These adjustments enabled maintenance of turgor and relative water content with increasing salinity. As most canopy growth occurs during the wet season, acclimation to the ‘memory’ of higher salinity in the previous dry season enables greater leaf function with minimal adjustments, as long-lived leaves progress from wet through dry seasons. However, declining turgor safety margins - the difference between soil water potential and leaf water potential at turgor loss - implied increasing limitation to water use with increasing salinity. Thus, plasticity in leaf water relations contributes fundamentally to mangrove function under varying salinity regimes.
1 INTRODUCTION
Mangroves occur in saline wetlands subject to periodic tidal inundation and variable freshwater input from rain, and must therefore cope with large fluctuations in salinity, hypoxic soil water and partial submersion (Duke et al., 1998). Such environmental variability is likely to be exacerbated as higher temperatures, drier atmospheres and changes to the frequency and intensity of rainfall become more severe as climate change progresses (IPCC, 2022; Lawrence et al., 2022). Under warmer, drier atmospheres mangrove leaves would experience greater evaporative demand. At the same time, estuarine salinity would concentrate due to greater evaporation together with lower freshwater input, reducing the capacity of roots to supply water to the leaves. Such changes in environmental conditions are altering the diversity and distribution of mangrove forests and inducing widespread forest mortality (Babcock et al., 2019; Duke et al., 1998; IPCC, 2022; Oliveira et al., 2014). Thus, it is essential to better understand how mangroves respond to extreme heat, low rainfall and concentrating salinity (Martinez-Vilalta et al., 2019; Osland et al., 2018) as mangroves like all plants, must access water to maintain hydration and carbon gain.
Mangroves live in saline conditions that limit the ability of roots to absorb water (Ball, 1988b), as root water potential (ψ, Table 1) must be lower than that in the soil (Scholander et al., 1964). Solute concentration in standard seawater is 35 parts per thousand (ppt), including 483 mM Na+ and 558 mM Cl−, with a ψ of −2.4 MPa (Harvey, 1966). Thus, for a mangrove growing in seawater, root ψ must be more negative than −2.4 MPa. This means mangroves must maintain turgor at very negative ψ, a process essential for survival and growth (Cabon et al., 2020; Peters et al., 2021; Potkay et al., 2022; Steppe et al., 2006). Mangroves achieve this through plastic adjustments of intracellular (symplastic) solute concentrations, reflected in increasingly negative osmotic potentials at full turgor (πFT) and ψ at the turgor loss point (ψTLP), as salinity increases (Nguyen, Meir, Sack, et al., 2017; Sobrado, 2007; Suárez & Sobrado, 2000; Suárez et al., 1998). Indeed, across a wide range of species and biomes, πFT and ψTLP correlate with tolerances of both drought and salinity (Bartlett et al., 2012), including in mangroves (Naidoo, 1985; Naidoo et al., 2011; Nguyen, Meir, Sack, et al., 2017). Therefore, these leaf water relations parameters are useful to assess acclimation to extreme environmental changes affecting salinity and root water availability.
Leaf water relations are often characterised through pressure−volume (PV) curves, that is, the relationship of ψ to relative water content (RWC, water content as a percentage of saturated water content) during dehydration (Cheung et al., 1975; Nguyen, Meir, Wolfe, et al., 2017; Scholander et al., 1964; Tyree & Hammel, 1972). This relationship typically yields a two-domain curve where in the first domain the change in ψ with dehydration is dominated by decreasing turgor until turgor is lost, and the second domain reflects decreasing osmotic potential.
PV parameters provide information of drought tolerance. Within and across species, ψTLP correlates strongly with πFT, and ψTLP is associated with interspecific and intraspecific variation in tolerance to drought (Bartlett et al., 2012) and salinity (Naidoo, 1985; Naidoo et al., 2011; Nguyen, Meir, Sack, et al., 2017). By contrast, the bulk modulus of elasticity (ε) tends not to correlate with ψTLP and plays no direct role in maintaining turgor during drought (Bartlett et al., 2012). Rather, ε primarily functions to maintain the RWC at the turgor loss point (RWCTLP) as ψTLP is adjusted during water stress to maintain cell water contents and volume above a threshold for damage. Indeed, the maintenance of a constant RWCTLP as drought progresses is indicative of a threshold below which drought mortality increases (Martinez-Vilalta et al., 2019). Therefore, coordinated adjustments in ψTLP and ε maintain RWCTLP and thus increase drought tolerance (Martinez-Vilalta et al., 2019; Sapes & Sala, 2021).
As the estuarine salinity at the roots (ψsalinity) sets the upper limit for rehydration through the roots, it is also important to consider the turgor safety margin (TSM), defined here as the difference between ψsalinity and ψTLP. The TSM gives a measure of the range of ψ over which turgor can be maintained with access to root water alone. For example, while ψTLP values were lower than soil water ψ in leaves of three subspecies of the mangrove Avicennia marina growing along gradients in salinity and aridity, the extent to which leaves could rehydrate (and hence generate turgor) based on access to root water declined with increasing salinity (Nguyen, Meir, Sack, et al., 2017). In other words, ψTLP did not decline in proportion to increasing salinity. Such a decline in the TSM indicates increasing constraints on turgor-dependent plant function with increasing salinity.
Prior exposure of plants to minor environmental stress can improve tolerance when exposed to more severe stress, an effect known as ‘ecological stress memory’ (ESM; Ahrens et al., 2021; Walter et al., 2013). For example, a diversity of plants showed greater tolerance to extreme heatwaves or severe drought when primed by prior heat or drought stress, compared to plants without prior exposure (Ahrens et al., 2021; Backhaus et al., 2014; Tankari et al., 2021; Walter et al., 2011; Whittle et al., 2009). ESM may occur even when the initial priming stress differs from the subsequent stress, a phenomenon known as cross-tolerance (Llorens et al., 2020). For example, drought exposure can improve salt tolerance (Singha et al., 2022); heat shock can improve heat, cold, salt and drought tolerance (Gong et al., 2001); and cold priming can improve salt and drought tolerance (Hossain et al., 2013). As acclimation to severe water stress may require structural and biochemical changes (e.g., Ahrens et al., 2021; Tomasella et al., 2019), acclimation that lasts beyond a single climatic event would enable greater leaf function with minimal osmotic and structural adjustments as conditions progress (Gessler et al., 2020).
In mangroves, interactions of low rainfall, salinity stress and heat in the dry season could influence acclimation to salinity in the next cohort of leaves grown primarily under wet season conditions, if, for example, epigenetic changes (Bruce et al., 2007; Hilker & Schmülling, 2019; Lira-Medeiros et al., 2010; Miryeganeh et al., 2021; Sharma et al., 2022) were initiated during early leaf development. This would enhance survival and function over a wider range of conditions through modification of leaf traits associated with water relations. Consequently, ψTLP as a measure of salinity tolerance (Nguyen, Meir, Sack, et al., 2017), would be more negative in the subsequent dry season at any given site along an estuary, even if salinities were lower than the previous dry season.
We investigated the combined effects of an extreme drought and its relief in the wet season on leaf water relations in two widespread mangroves Aegiceras corniculatum (L.) Blanco and Rhizophora stylosa Griff., cooccurring at three estuarine positions along the Daintree River, Queensland. These species differ in salinity tolerance and salt management strategies (Ball, 1988a), with optimal growth salinities ranging from 10% to 20% seawater in the salt secretor A. corniculatum (Ball, 1988b) to 25%−50% seawater in the non-salt secretor R. stylosa (Clough, 1984). Nevertheless, at a given estuarine site both species must prevent the majority of salt from entering the plant during water uptake, while accumulating ions for vacuolar osmotic adjustment regardless of biochemical differences in organic compounds used for osmotic adjustment of cytoplasmic compartments (Ball, 1988a). Indeed, Nguyen, Meir, Sack, et al. (2017) showed that coordinated adjustments in πFT, and ψTLP in the salt secreting mangrove A. marina followed the same trend found in a meta-analysis of 317 species from a wide range of biomes (Bartlett et al., 2012). Thus, species tolerant of a wide range of salinities are likely to show similar osmotic adjustment in response to drought due to the shared requirement to maintain a positive water balance under water stress regardless of the biochemical particulars of their salt management strategy.
We addressed four hypotheses:
H1.Bulk osmotic adjustment in response to drought will be similar in a salt secreting and a non-secreting species distributed over a broad salinity gradient due to the shared cellular requirements to maintain a positive water balance under water stress.
H2.Coordinated adjustment in ψTLP and ε maintain turgor and water content, respectively, with increasing water stress.
H3.Adjustments in turgor loss points with increasing salinity, while enabling maintenance of water uptake, will not be sufficient to prevent a decline in turgor safety margins.
H4.Severe but nonlethal dry season conditions lead to greater leaf salinity tolerance in the subsequent dry season, as predicted from ecological stress memory.
| Parameter | Unit | Symbol |
|---|---|---|
| Fresh mass | g | FM |
| Dry mass | g | DM |
| Leaf mass area | gDM m−2 | LMA |
| Saturated water content per area | g m−2 | WCA |
| Saturated water content per dry mass | g g−1DM | WCDM |
| Water potential | MPa | ψ |
| Full turgor | FT | |
| Turgor loss point | TLP | |
| Water potential at turgor loss point | MPa | ψTLP |
| Osmotic potential at full turgor | MPa | πFT |
| Bulk modulus of elasticity | MPa | ε |
| Relative water content | % | RWC |
| Relative water content at turgor loss point | % | RWCTLP |
| Water storage | mol m−2 | WS |
| Water storage capacitance | mol m−2 MPa−1 | C |
| Turgor safety margin | MPa | TSM |
2 MATERIALS AND METHODS
2.1 Study site and species
Sun-exposed terminal branches <1 m were collected from mature trees of A. corniculatum and R. stylosa from similar canopy positions <3 m in height from the ground and growing naturally along the banks of the Daintree River, Daintree National Park, Far North Queensland, Australia (16.1700°S, 145.4185°E). PV curves were constructed for the youngest, healthiest, fully expanded leaf from each branch. Three estuarine sites (designated Upper, Middle and Lower, Figure 1a) were selected along the river banks where the geographical position in the estuary and the mangrove vegetation were indicative of different ranges of salinity, driven largely by differences in tidal influence combined with seasonal variation in river discharge. The Upper estuarine site (typically low salinity, 2−9 ppt) was located near the upstream limits of mangrove distribution (16.257421°S, 145.343296°E), the Middle estuarine site (typically mid salinity, 10−24 ppt) was located near the Daintree ferry crossing (16.260275°S, 145.393811°E) and the Lower estuarine site (typically high salinity, 25−26 ppt) was located near the river mouth (16.283785°S, 145.451308°E).
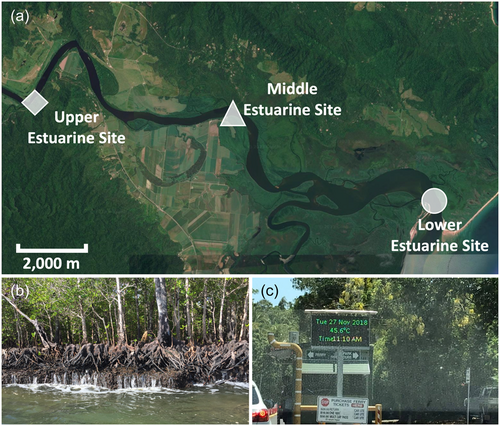
The study was limited to trees on the river bank margins of a tidal system (tidal range approximately 3 m) for three reasons. First, safety restrictions for working in a saltwater crocodile (Crocodylus porosus) habitat necessitated rapid sampling of mangroves that could be accessed by boat at high tide. Second, the conditions along the river bank are more similar to each other than to sites even a few metres inland. Finally, along river margins where sediment is loosely consolidated (accreting banks) or where the river banks are well drained and reflooded with successive tides (eroding banks, Figure 1b), the estuarine surface water salinities are likely to be representative of those used by root systems which were partially exposed to river water, consistent with split root studies of mangroves and other halophytes (Bazihizina et al., 2009, 2012; Reef et al., 2015).
Measurements of mid-dry season leaf water relations in A. corniculatum and R. stylosa were made in August 2019 after a severe dry-season heatwave and low rainfall event (late 2018, please see ‘Climate’ for further details) and its relief in the following wet season. To take advantage of this event, we compared the data collected in 2019 with prior mid-dry season leaf water relations data collected during 2016 and 2017 for R. stylosa, and 2018 for A. corniculatum. These prior measurements captured multiple years of typical estuarine saline conditions and were thus considered baseline measurements for before/after analysis of the effects of the severe drought.
Leaf samples of R. stylosa were collected from three trees (n = 3) from each of the Lower and Middle estuarine sites in October 2016 and the Upper estuarine site in late July of 2017, and samples of A. corniculatum (n = 5 trees) were collected from all three estuarine sites in July of 2018 early in the drought (Supporting Information: Table S1), hereafter called the pre-drought condition. A. corniculatum (n = 5) and R. stylosa (n = 5 except Upper estuarine site where n = 2) were then resampled at all sites in August of 2019 hereafter called the post-drought condition (Supporting Information: Table S1). Different individuals from the same cohorts of trees at the same three estuarine sites were sampled for each collection period.
Estuarine surface water samples were collected at each sampled tree and salinity was measured with a hand-held refractometer (A. S. T. Co. Ltd). ψsalinity (Table 2) was calculated as a fraction of seawater, where standard seawater has a salinity of 35 ppt and a ψ of −2.4 MPa. Values for ψsalinity in the 2016−2017 and 2018 collection periods were reflective of the average range of conditions in this ecosystem. Values for ψsalinity collected in 2018 were more negative than those collected in 2016−2017 as these measurements were made at the onset of the 2018 dry-season drought.
| 2016−2017 | 2018 | 2019 | ||||||
|---|---|---|---|---|---|---|---|---|
| Site | ppt | MPa | Site | ppt | MPa | Site | ppt | MPa |
| Upper | 2 ± 0.5 | −0.14 ± −0.03 | Upper | 9 ± 0.5 | −0.62 ± −0.03 | Upper | 0 ± 0.5 | 0 ± −0.03 |
| Middle | 10 ± 0.5 | −0.69 ± −0.03 | Middle | 24 ± 0.5 | −1.65 ± −0.03 | Middle | 0 ± 0.5 | 0 ± −0.03 |
| Lower | 25 ± 0.5 | −1.71 ± −0.03 | Lower | 26 ± 0.5 | −1.78 ± −0.03 | Lower | 24 ± 0.5 | −1.65 ± −0.03 |
- Note: Estuarine water salinity was measured in parts per thousand (ppt) and averaged from five measurements at each site. The estuarine water potential was calculated as a fraction of seawater, where standard seawater has a salinity of 35 ppt and a water potential of −2.4 MPa. There was no variation in salinity measurements within each estuarine site due to the proximity of sampled trees and water being well mixed. Consequently, values presented are mean estuarine water salinity ± instrument resolution. Values for Upper and Middle sites measured in 2019 reflect high watershed discharge bringing estuarine salinity to zero at these sites.
2.2 Climate
The 2018 drought was characterised by higher minimum and maximum temperatures (Supporting Information: Figure S1), greater solar exposure (Supporting Information: Figure S2) and reduced rainfall (Supporting Information: Figure S3) relative to the long-term mean (data from: http://www.bom.gov.au/climate accessed 16/02/2021). As the drought developed, August through October experienced higher average maximum daily temperatures than the previous 30-year average (p < 0.01); similarly, July, August and November experienced significantly higher average minimum daily temperatures than the 30-year average (p < 0.001) (Supporting Information: Figure S1). The Australian Bureau of Meteorology reported a record air temperature of 42°C in Cairns, 105 km from the field site (data from: http://www.bom.gov.au/climate accessed 17/08/2021), while Daintree River Crossing recorded 45.6°C on 27 November 2018 (Figure 1c).
In addition to the higher temperatures, and record-breaking heatwave, little rain was received from June through October 2018. Both during this period (p < 0.0001), and in November (p < 0.001) rainfall was lower than the previous 30-year average (Supporting Information: Figure S3). Consequently, water discharge (mL/day) measured at Bairds Crossing, a water monitoring site on the Daintree River, was smaller from August to November in 2018 than the 30-year average since 1988 (p < 0.0001) and reached a low of 105 mL/day in November. Mean river height was lower (~7 cm) in 2018 from August through November than the 30-year average river height since 1990 (p < 0.0001) (data from: https://water-monitoring.information.qld.gov.au accessed 24/02/21, comparisons made using t-tests).
Extremely high temperatures and drier atmospheres imposed greater evaporative demand, which would have increased water use from trees, reduced the water level of the Daintree River and concentrated estuarine salinity. Reduced water discharge due to low rainfall would have allowed tidal seawater intrusion farther upstream further increasing estuarine salinity at all three sites. Thus, drought here refers to the combined effects of atmospheric drought and low rainfall that increased estuarine salinity, inducing severe limitations on water available for hydration at all field sites as the dry-season drought progressed.
A wet season relieved the 2018 drought. In January 2019, total rainfall was 1007 mm (data from: http://www.bom.gov.au/climate accessed 16/02/2021). This wet season had a prolonged effect on the river system as the volume of freshwater discharged from the watershed delayed the upstream penetration of a tidal salt wedge. This was shown by the persistence of fresh water at the Upper and Middle estuarine sites in the mid-dry season of 2019, even though the average salinity had recovered at the river mouth (Lower estuarine site, Table 2).
2.3 Leaf water relations
One sun-exposed terminal branch <1 m from each of 2−5 trees was collected at midday from the Daintree River from Upper, Middle and Lower estuarine sites and transported to the field lab in plastic bags to prevent moisture loss. The youngest, fully expanded, healthy leaf from each branch was cut at the petiole under perfusion solution (1% seawater for R. stylosa and 5% seawater for A. corniculatum) and rehydrated overnight with the petiole immersed in perfusion solution in a beaker. Each beaker was covered by a wet paper towel and plastic wrap to increase humidity and prevent transpiration. The composition of the perfusion solution was based on analyses of the ionic composition of xylem sap in A. corniculatum and R. stylosa grown under lab (Ball, 1988b) and field conditions (Scholander et al., 1966; Stuart et al., 2007). A PV curve was constructed and analysed for each of the leaves as described by (Nguyen, Meir, Wolfe, et al., 2017). Upon completion of the measurements, leaf area was measured using the ‘LeafScan' app (Anderson & Rosas-Anderson, 2017) and the leaves were oven dried at 70°C for 24 h and to constant mass before determining the leaf dry mass (DM).
The πFT and ψTLP were determined by standard methods (Tyree & Hammel, 1972) as shown in Supporting Information: Figure S4. Data for leaf physical traits (Supporting Information: Table S2) were determined as described by Nguyen, Meir, Wolfe, et al. (2017) and combined with PV parameters determined from the PV relationships to calculate three additional PV parameters, ε, C and water storage (WS). Bulk modulus of elasticity was calculated as per Nguyen, Meir, Sack, et al. (2017). Capacitance was calculated according to Tyree and Hammel (1972), estimated as the linear slope of an appropriate region in the PV curve above the TLP (Supporting Information: Figure S5), normalised by leaf WCA (Brodribb & Holbrook, 2003; Koide et al., 2000). WS was here estimated as the total amount of water released with drying from a fully hydrated state to the TLP (Nguyen, Meir, Sack, et al., 2017). Average PV curves for each species, pre- and post-drought from each estuarine site can be found in Supporting Information: Figure S6. Converting salinities to ψ (Table 2) enabled positioning of environmental conditions on respective PV curves to estimate, for example, the extent of WS that could be achieved through root water uptake alone, calculated as per Nguyen, Meir, Sack, et al. (2017); Nguyen, Meir, Wolfe, et al. (2017).
2.4 Statistical analysis
In this design there were two species by three estuarine sites by two conditions (i.e., pre-drought and post-drought) with varying numbers of replicate trees. This design contrasts data collected during the mid-dry season in the succession of years when a gradual salinity gradient was present (Table 2) with data collected after a severe drought had been relieved by the subsequent wet season.
Statistical analyses were performed using the R statistical software package (R Core Team, 2020; version 4.0.2). The basic model for all dependent variables was a linear mixed model using the lmer() function in the lmerTest package (Kuznetsova et al., 2017) with condition, species, estuarine site and all two-way interactions as fixed effects, and a variable indicating the unique combinations of estuarine site, condition and species as a random intercept. For some measurements, within-unit variation was so low that the linear mixed model failed to converge; to improve model convergence, we added some random noise to these measurements. In comparison to a fixed-effects linear model, this approach is a more conservative analysis that better identifies estuarine site effects by accounting for the repeated measures made at estuarine sites, leading to larger standard errors (SE).
The anova() function was used to assess the significance of main effects and interactions at the p < 0.05 level. Model fit was assessed through a number of diagnostic tests including the Shapiro−Wilk test for normality of residuals. Where necessary dependent variables were log-transformed to improve model fit. Model estimated marginal means, trendlines and SE for figures were produced post hoc using the emmeans R package (Lenth, 2020), with the Tukey method used for p-value adjustment. Figures were produced using the package ggplot2 (Wickham, 2016). Observed means ± SE and ANOVA tables are given in supporting information. All data are publicly accessible [(data set) Beckett et al., 2021].
3 RESULTS
3.1 Physical properties of leaves
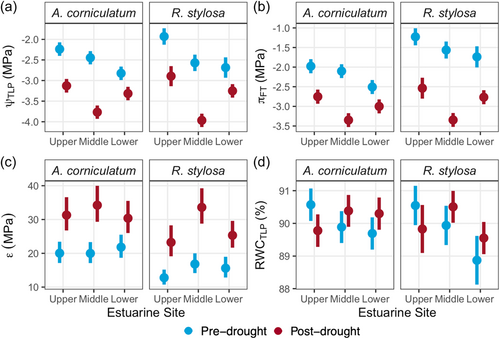
R. stylosa leaves were larger in area, mass, leaf mass per area and water content than A. corniculatum leaves (p < 0.04, Figure 2). Yet, with the exception of leaf area which for both species was smaller post-drought (p = 0.016), neither species' physical properties differed in response to drought. Leaf area in both species differed with estuarine site (p < 0.0001), with the smallest leaf area occurring at the Lower estuarine site where salinity was highest both pre- and post-drought. Saturated leaf WCDM in both A. corniculatum and R. stylosa responded differently to drought depending on the estuarine site of leaf growth (p = 0.004, Figure 2). At the Upper estuarine site, WCDM was greater in both species post-drought than pre-drought, while the opposite trend occurred at the Lower estuarine site.
3.2 Turgor loss point and its components
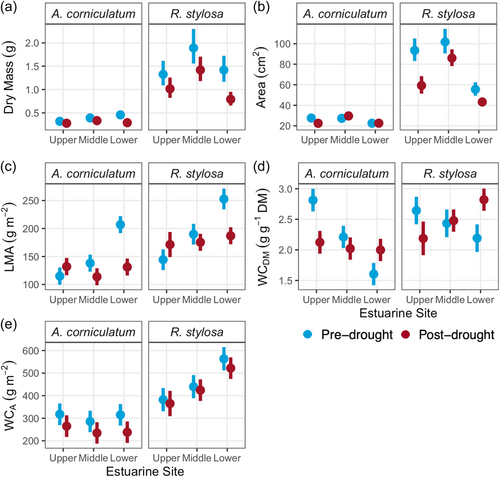
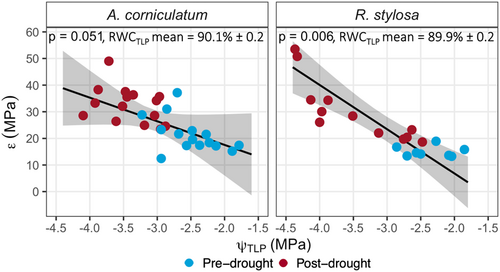
There were no significant differences in PV parameters between A. corniculatum and R. stylosa within either the pre-drought or post-drought samples (Figures 3 and 5). Both A. corniculatum and R. stylosa showed strong shifts in all PV parameters between pre- and post-drought (p < 0.05), except for RWCTLP where there were no significant drought effects (Figure 3). Post-drought values for ψTLP and πFT were more negative than pre-drought (p < 0.0001), while ε increased between pre- and post-drought (p = 0.047). At the Upper estuarine site, ψTLP pre- and post-drought was less negative than in Middle or Lower estuarine sites (p = 0.0002); however, the effect of estuarine site on ψTLP differed pre- and post-drought (p = 0.01, Figure 3a). Pre-drought ψTLP became increasingly negative across Upper, Middle and Lower estuarine sites, while post-drought ψTLP was most negative at the Middle estuarine site. Similar trends occurred in πFT, which was less negative at the Upper estuarine site relative to the Lower estuarine site pre- and post-drought (p = 0.04). Values for ε correlated significantly with ψTLP (Figure 4) such that RWCTLP averaged 90.1% and 89.9% for A. corniculatum and R. stylosa, respectively (Figure 3d).
3.3 WS and capacitance
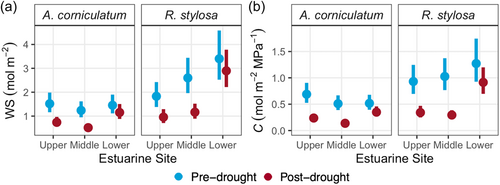
Leaf C was significantly lower post-drought than pre-drought (p = 0.03, Figure 5). However, there were no significant species or site effects for leaf C. Similarly, despite mean values of leaf WS decreasing between pre- and post-drought, there were no significant species, site or drought effects for leaf WS (Figure 5). Both leaf C and WS tended to increase across Upper, Middle and Lower estuarine sites in R. stylosa pre- and post-drought, with no strong site trend present in A. corniculatum.
3.4 The TSM
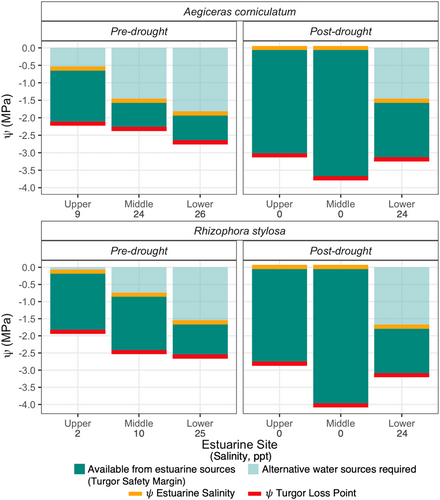
Figure 6 shows the maximum range of leaf ψ over which turgor could be maintained from saturation (0 MPa) to ψTLP (indicated in red). However, due to the requirement to maintain favourable ψ gradients for uptake of water through roots, the ψ of the estuarine water in which the roots reside (ψsalinity) sets the upper limit to leaf hydration achievable through roots. The difference between ψTLP and the ψsalinity (indicated in yellow) gives a measure of the TSM, the range of ψ over which turgor can be maintained with access to root water alone. The TSM (shown in the dark green) pre- and post-drought was smallest at the Lower estuarine sites compared to Upper estuarine sites (p = 0.04, Figure 6), despite more negative values for ψTLP at Lower than Upper estuarine sites. In other words, TSM were smaller at high than low salinity both pre- and post-drought because TLPs varied less than salinity. Therefore, the hydration deficit—the range of ψ that could not be filled by root water in the absence of a lower salinity water source—increased between low and high salinity. However, the lower TLPs post-drought than pre-drought enabled greater TSM at all sites following relief from the drought (p = 0.01, Figure 6).
3.5 The salinity-induced WS deficit
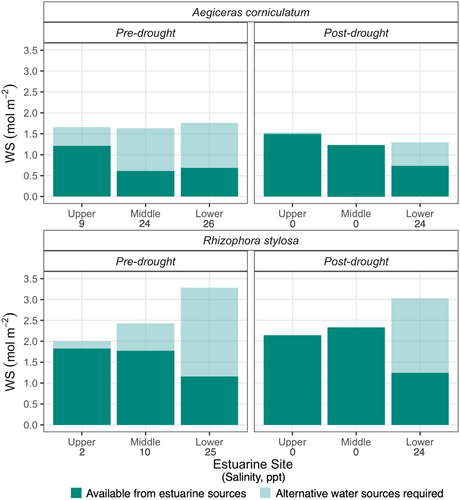
Just as ψsalinity sets the upper limit of turgor pressure in the absence of alternative sources of low salinity water, it also sets the upper limit on WS that can be filled through the roots. Accordingly, the WS attainable through the roots as set by ψsalinity (dark green) was considered in relation to the total WS (i.e., WS at saturation, see Figure 7). Although there was no significant difference in total WS between the species, the attainable WS was larger in R. stylosa than in A. corniculatum (p = 0.03), with a trend in both species towards attainable WS decreasing between Upper and Lower estuarine sites (p = 0.05). Pre-drought, there was a WS deficit at all sites as attainable WS was less than total WS, with a greater WS deficit in leaves grown at the Lower compared to the Upper estuarine site both pre- and post-drought (Figure 7). In contrast, there was no deficit between attainable WS and total WS in leaves from Upper and Middle estuarine sites post-drought where saline conditions had not yet re-established after the wet season. Hence, plants could achieve total WS through the uptake of estuarine water alone. The results obtained pre- and post-drought imply a greater requirement for alternative low-salinity water sources to achieve total WS in high than low-salinity environments (p = 0.04) as evidenced by the difference between attainable and total WS.
4 DISCUSSION
Water relations parameters were investigated in A. corniculatum and R. stylosa under both a typical salinity regime and following its destabilisation by drought in which high air temperature, low humidity and low rainfall would all have contributed to water stress from both atmospheric drought and associated increases in salinity. The results highlighted the central role of the TLP in salinity tolerance, the importance of dry season ‘memory’ for determining the TLP in long-lived leaves, and identified factors that might constrain function under drought and salinity stress during extreme dry season conditions. These results advance our understanding of how mangroves cope with varying salinity.
4.1 Osmotic adjustment in response to drought was similar in species distributed over a broad salinity gradient
Physical properties revealed substantial physical differences between the species, where R. stylosa had larger leaf DM, area, LMA and WC than A. corniculatum leaves (Figure 2). However, while A. corniculatum and R. stylosa may have differed in the scale of their responses pre- and post-drought, the species did not differ in their adjustment of key water relations characteristics in response to drought, including in ψTLP, πFT, ε, RWCTLP, WS and C (Figures 3 and 5), as hypothesised. Furthermore, despite different collection periods, there were no significant differences in ψTLP, πFT, ε and RWCTLP between the species pre-drought.
In a global meta-analysis, Bartlett et al. (2012) found that ψTLP was strongly associated with water availability and drought tolerance. Further, Nguyen, Meir, Sack, et al. (2017) identified soil water salinity as the key variable driving ψTLP adjustment in mangroves, such that leaf ψTLP varies with salinity (Bryant, Fuenzalida, Brothers, et al., 2021; Paliyavuth et al., 2004; Suárez & Sobrado, 2000; Suárez et al., 1998) to maintain a water balance favourable for maintenance of turgor and water uptake. Here, we suggest that species made similar adjustments in ψTLP and its components due to the requirement to maintain turgor and favourable gradients for water uptake under increasing salinity, both along a salinity gradient and in response to severe water stress. Indeed, although drought responses differed from those in the present study, Fajardo and Piper (2021) found that all angiosperm tree species studied responded similarly to drought such that there was functional coordination in drought acclimation. Thus, although A. corniculatum and R. stylosa differ in salinity tolerance and salt management, their water relations characteristics revealed no fundamental differences in the nature of acclimation to salinity variation and related drought drivers. As such, species are discussed collectively below.
4.2 Coordinated adjustment in ψ TLP and ε maintained turgor and water content with increasing water stress
The maintenance of turgor and cell volume is essential for growth, cellular and intracellular communication, maintenance of cellular function and sugar transport (Cabon et al., 2020; Fricke, 2017; Peters et al., 2021; Potkay et al., 2022; Steppe et al., 2006). Additionally, loss of turgor and cell volume can impact structural integrity, cellular function and carbon gain, and eventually lead to cell death (Guadagno et al., 2017; Lamacque et al., 2020; Lambers & Oliveira, 2019; McDowell et al., 2022; Nguyen, Meir, Wolfe, et al., 2017; Sapes & Sala, 2021). Consequently, the TLP is recognised as an important indicator of both soil water availability and drought tolerance (Bartlett et al., 2012). Given this, the plasticity to adjust ψTLP to more negative values with dynamic variation in salinity over time and space would contribute to defining the salinity range over which a plant can maintain hydraulic functions, gas exchange and growth. Both mangrove species adjusted ψTLP sufficiently to enable the maintenance of water uptake by the roots (Figure 3). Indeed, adjustments in TLP in the present study were consistent with the prediction of ψTLP with adjustment in πFT (Supporting Information: Figure S6) as shown in the Bartlett et al. (2012) meta-analysis of a wide range of species across biomes and environments.
Through adjustments in ψTLP, πFT and ε (Figure 3), both A. corniculatum and R. stylosa maintained RWCTLP at ~90% across the range of salinities and environmental conditions (Figure 3). This highlights the eco-physiological importance of maintaining both volume and a high hydration state. It has been noted in previous studies that RWC below 75% inhibits protein, ATP and RuBP production (Lawlor & Cornic, 2002). Indeed, the Bartlett et al. (2012) meta-analysis revealed no species with a RWCTLP below 75%. Furthermore, drought-induced mortality increased as RWC declined below TLP (Sapes & Sala, 2021). Thus, maintenance of RWCTLP at 90% during drought could provide a buffer from cellular damage incurred at lower RWC (Martinez-Vilalta et al., 2019).
The constant RWCTLP across sites pre- and post-drought (Figure 3), was largely a consequence of proportional adjustments in ψTLP and ε (Figure 4) consistent with the cell water conservation hypothesis (Bartlett et al., 2012; Cheung et al., 1975). Under this hypothesis, more rigid cells will show a greater change in ψ for a given change in RWC, allowing for the maintenance of cellular water content at more negative values of ψ (Cheung et al., 1975). If leaves had decreased only πFT and ψTLP then the RWCTLP would have lowered with potential negative impacts on cellular function, geometry (Bartlett et al., 2012) and survival (Sapes & Sala, 2021). Thus, leaf plasticity enabling adjustments in water relations minimised changes in cellular hydration in an environment of strongly varying soil water availability.
4.3 Adjustments in turgor loss points with increasing salinity enabled maintenance of water uptake but were not sufficient to prevent a decline in TSM
The TSM gives the range of ψ over which leaves can function with turgor if the only source of water was that absorbed by roots. A greater leaf TSM would enable longer periods of carbon gain under greater salinities. Under extreme conditions when stomata may be closed, uptake of soil water would be sufficient to maintain a minimal level of turgor unless there was a substantial decrease in ψsalinity, as turgor loss points were always more negative than ψsalinity (Figure 3). However, the decrease in ψTLP was not proportionate to the decrease in ψsalinity between Upper and Lower estuarine sites. As a result, the TSM tended to be smallest at the Lower estuarine site where salinity was highest. This was consistent with findings for A. marina grown along gradients in salinity and aridity (Nguyen, Meir, Sack, et al., 2017).
Similarly, total leaf WS capacity tended to be greatest in leaves grown at high salinity at the Lower estuarine site (Figure 5). However, due to the more negative ψ at highly saline sites, leaves grown under these conditions would realise the smallest fraction of total leaf WS capacity based on root water uptake alone. If the water supply from the roots becomes restricted due to increasing salinity, then the availability of stored water may become increasingly important for carbon gain and maintenance of cellular functions (Scholz et al., 2011). Indeed, total WS alone was sufficient to support substantial transpiration rates in A. marina for up to 2 h before turgor loss (Nguyen, Meir, Wolfe, et al., 2017) and contributes to the maintenance of stem hydraulic function during the late dry season in A. marina (Coopman et al., 2021) and Sonneratia alba (Bryant, Fuenzalida, Brothers, et al., 2021).
Limitations of decreasing TSM and increasing WS deficits might be offset by foliar water uptake as suggested by Nguyen, Meir, Sack, et al. (2017). Indeed, widespread capacity for foliar water uptake occurs in mangroves (Bryant, Fuenzalida, Zavafer, et al., 2021; Hayes et al., 2020) including A. corniculatum (Schaepdryver et al., 2022), enabling recovery of leaf hydraulic conductance (Fuenzalida et al., 2019), embolism repair (Fuenzalida et al., 2022), protection of stem hydraulic function (Coopman et al., 2021) and long-term benefits to turgor-dependent growth (Schreel et al., 2019; Steppe et al., 2018). However, greater reliance on atmospheric water may result in greater vulnerability to drought conditions that lead to increased estuarine salinity, while drier atmospheric conditions would also reduce the occurrence of foliar uptake of atmospheric water. Future studies are needed to address the relative contribution of foliar water uptake to plant hydration.
There may be costs associated with maintaining a large TSM driven by a low ψTLP year-round. These include osmotic adjustment of cytoplasmic compartments (Flowers & Colmer, 2008) and wall reinforcement to increase rigidity, both of which reduce carbon that might otherwise be available for growth. These carbon costs are small at an individual leaf level but could be significant at whole canopy scales. However, a greater cost linked to increasing ε may be reductions in mesophyll conductance, incurring a long-term cost to assimilation rates. For example, studies have shown a trade-off between cell wall properties and mesophyll conductance, whereby decreasing diffusivity across thicker or less permeable walls could impede carbon gain (Carriquí et al., 2020; Niinemets et al., 2009; Onoda et al., 2017). This suggests that a high ε is associated with increased diffusive resistance to CO2 (Nadal et al., 2018). However, the benefits of increasing ε together with decreasing ψTLP to enable maintenance of both turgor and the RWCTLP at greater salinities may outweigh the potential cost of reduced maximum assimilation rates.
4.4 Severe but nonlethal dry season conditions lead to greater leaf salinity tolerance in the subsequent dry season, consistent with ESM
When mid-dry season samples were collected post-drought, freshwater conditions occurred at the Upper and Middle estuarine sites (Table 2) likely due to increased freshwater discharge from the watershed following the wet season. Despite leaf growth mainly occurring over the much lower ranges of salinities during the wet season (Saenger & Moverley, 1985), post-drought measurements of both πFT and ψTLP were lower while ε was greater at all three sites in both A. corniculatum and R. stylosa relative to the pre-drought measurements (Figure 3). We know of no evidence in the literature of a lowering of ψTLP together with an increase in ε in response to decreasing salinity. Rather, the leaves collected post-drought possessed water relations characteristics consistent with osmotic adjustment to increase drought and salinity tolerance (e.g., Bartlett et al., 2012; Bryant, Fuenzalida, Brothers, et al., 2021; Naidoo et al., 2002; Nguyen, Meir, Sack, et al., 2017; Paliyavuth et al., 2004; Suarez & Medina, 2008) and thus we hypothesise that these shifts in ψTLP and ε occurred in response to the severe 2018 dry season drought.
Post-drought results imply acclimation to higher salinity may have been initiated either in meristematic tissue or during leaf primordium development in response to the 2018 drought. There is precedent in the physiological literature for priming of salinity tolerance through ESM of prior exposure to heat, drought and salinity stresses (Caparrotta et al., 2018; Gong et al., 2001), where stress may induce epigenetic responses involving modification of DNA (Bruce et al., 2007; Hilker & Schmülling, 2019; Sharma et al., 2022). For example, exposure to environmental stress during early development can induce lasting enhancement of stress tolerance in the tissue or plant, as demonstrated by epigenetic determination of traits characterising provenances of Picea abies (Johnsen et al., 1996, 2005; Kvaalen & Johnsen, 2008). Indeed, mangroves exhibit a correlation between epigenetic methylation and morphological variation along salinity gradients (Lira-Medeiros et al., 2010; Miryeganeh et al., 2021). Thus, the influence of the preceding drought on the development of leaf traits, which resulted in enhanced salinity tolerance in the subsequent dry season as hypothesised, was consistent with ESM.
In the long-lived leaves (15−21 months) of A. corniculatum and R. stylosa (Saenger & West, 2016), ESM of the higher salinities of the previous dry season would enable greater leaf function with minimal osmotic and structural adjustments as conditions progressed from wet through dry seasons. Indeed, Galiano et al. (2017) suggested that long-term acclimation to the legacy of drought reflected the prioritisation of long-term survival over improved performance in the short-term following drought relief. For example, a decrease in leaf area and adjustment of vessel anatomical traits reduced water use during drought, reduced plant daily water loss and increased resistance to subsequent drought (Tomasella et al., 2019), and may explain the significant reduction in individual leaf area post-drought in both species measured here. Furthermore, ESM may explain observations of little difference between wet and dry season water relations parameters in coexisting mangroves Avicennia germinans and Laguncularia racemosa (Sobrado & Ewe, 2006). Notably, if acclimation occurs primarily in response to the previous dry season, then plants experiencing a prolonged period of cool, moist conditions (e.g., La Niña) would be more vulnerable to drought with a rapid switch to hot dry conditions (e.g., El Niño).
4.5 Limitations of the study
Our results do not distinguish between water stress from atmospheric drought, extreme temperature and associated stress from increased salinity, all of which would produce similar effects on leaf water relations. Furthermore, due to the remote nature of the field site, detailed environmental data are limited. We thus cannot distinguish a particular driver and so have discussed the results in terms of salinity tolerance, recognising that changes in salinity do not occur in isolation from other factors that affect it and the response of plants to salinity.
Despite different years of collection, the lack of significant differences in PV parameters of leaves among samples collected pre-drought indicates the suitability of our pre-drought samples as a baseline for comparison with samples collected over time, which included a drought superimposed upon year-to-year variability. Our field-based study thus captured responses to complex conditions as indicated by statistically significant differences in water relations parameters measured pre- and post-drought, which did not differ significantly between species. However, this study is limited in both the time span and scale of measurements. Consequently, ESM of drought that influenced salinity tolerance of future leaf growth remains a hypothesis, strongly supported by our data. Due to the implications for mangrove acclimation and survival under future extreme weather and the design of future work, the results presented here urgently warrant further investigation into this phenomenon in mangroves.
5 CONCLUSION
Increasing frequency of extreme temperatures and drought can drive fluctuations in salinity that affect the growth and survival of mangroves. Thus, there is an urgent need to better understand the acclimation of mangrove trees to dynamic salinity gradients. We quantified responses that highlighted four linked aspects of the acclimation of leaf water relations under dynamic environmental conditions. Coordinated adjustments in osmotic potential and cell wall rigidity enabled maintenance of turgor and RWC with increasing salinity, regardless of the salinity tolerance or salt management strategy of the species. Late dry season conditions, likely during leaf primordium development, enhanced salinity tolerance in the subsequent dry season, indicative of ESM. However, these benefits of acclimation were counterbalanced by a decline in TSM and increased requirements for absorption of atmospheric water with increasing salinity, both of which may increase the vulnerability of mangroves to drought. The complexity of acclimation under field conditions where mangroves experience daily, seasonal and year-to-year variations in concurrent stresses that affect salinity tolerance will thus influence mangrove responses to climatic extremes.
ACKNOWLEDGEMENTS
The authors acknowledge the Kuku Yalanji and the Ngunnawal and Ngambri peoples, the traditional custodians of the land on which this work was conducted. We pay our respects to them and their cultures, and elders both past and present. The authors thank the Australian Research Council for support through Discovery Project Grant DP180102969 awarded to M. C. B. and L. S. Australian Government Research Training Programme (RTP) Scholarships supported H. A. A. B. and C. B., and T. I. F. was supported by the Becas Chile PhD scholarship programme granted by CONICYT. We thank Catherine Bone and Nigel Brothers for exceptional field support and accommodation at the Daintree River, Richard Hunt and Paul Hoye for their assistance with Daintree weather records, and Matt Bowes, Prue Beckett and Penny Bonnell for thoughtful comments on the manuscript. Open access publishing facilitated by Australian National University, as part of the Wiley - Australian National University agreement via the Council of Australian University Librarians.
Open Research
DATA AVAILABILITY STATEMENT
The data that support the findings of this study are openly accessible at the Australian National University Data Commons, doi: 10.25911/61566961e8f69


