Prolonged low temperature exposure de-sensitises ABA-induced stomatal closure in soybean, involving an ethylene-dependent process
Abstract
Chilling can decrease stomatal sensitivity to abscisic acid (ABA) in some legumes, although hormonal mechanisms involved are unclear. After evaluating leaf gas exchange of 16 European soybean genotypes at 14°C, 6 genotypes representing the range of response were selected. Further experiments combined low (L, 14°C) and high (H, 24°C) temperature exposure from sowing until the unifoliate leaf was visible and L or H temperature until full leaf expansion, to impose four temperature treatments: LL, LH, HL, and HH. Prolonged chilling (LL) substantially decreased leaf water content but increased leaf ethylene evolution and foliar concentrations of the ethylene precursor 1-aminocyclopropane-1-carboxylic acid, indole-3-acetic acid, ABA and jasmonic acid. Across genotypes, photosynthesis linearly increased with stomatal conductance (Gs), with photosynthesis of HH plants threefold higher than LL plants at the same Gs. In all treatments except LL, Gs declined with foliar ABA accumulation. Foliar ABA sprays substantially decreased Gs of HH plants, but did not significantly affect LL plants. Thus low temperature compromised stomatal sensitivity to endogenous and exogenous ABA. Applying the ethylene antagonist 1 methyl-cyclopropene partially reverted excessive stomatal opening of LL plants. Thus, chilling-induced ethylene accumulation may mediate stomatal insensitivity to ABA, offering chemical opportunities for improving seedling survival in cold environments.
Abbreviations
-
- 1-MCP
-
- 1 methylcyclopropene
-
- ABA
-
- abscisic acid
-
- ACC
-
- 1-aminocyclopropane-1-carboxylic acid
-
- An
-
- photosynthesis
-
- GA3
-
- gibberellic acid
-
- Gs
-
- stomatal conductance
-
- H
-
- high
-
- IAA
-
- indole-3-acetic acid
-
- iP
-
- isopentenyl adenine
-
- IT
-
- initial temperature
-
- JA
-
- jasmonic acid
-
- L
-
- Low
-
- LWC
-
- leaf water content
-
- MT
-
- measurement temperature
-
- SA
-
- salicylic acid
-
- T
-
- temperature
-
- tZ
-
- trans-Zeatin
1 INTRODUCTION
Compared with other crops, soybean has experienced the largest increase in harvested area in the last 40 years (Hartman et al., 2011). Projections show this expansion will continue towards higher latitudes including the North of Canada, Europe and Russia (Fodor et al., 2017). Meanwhile, in temperate regions earlier sowings are becoming more common due to the yield benefit obtained (Grassini et al., 2015; Vitantonio-Mazzini et al., 2021; Williams, 2022). These trends should be supported by higher crop tolerance to chilling stress, especially at early stages when seedling survival may be compromised.
Cold temperatures consistently occur during spring, which coincides with the early stages of crop development. During germination and emergence, low T decreases imbibition rate, tissue expansion and mitochondrial respiration (Duke et al., 1977; Vertucci and Leopold, 1983). Afterwards, seedling establishment is compromised because low T decreases membrane fluidity, resulting in lower root hydraulic conductance (e.g., Markhart et al., 1980), and thus leaf turgor, leaf expansion and finally, leaf area, which can be reduced by sevenfold even under relatively mild low T regimes (20/12°C) (Alsajri et al., 2019). Chilling can cause parallel declines in photosynthesis (An) and stomatal conductance (Gs) which help to maintain leaf water status by restricting transpiration (Van Heerden et al., 2003). However Gs can also be unaffected even when the plant wilts (Purcell et al., 1987) although this response is not consistent across different studies (Table S1). Various mechanisms have been proposed to account for this disrupted stomatal regulation (Eamus and Wilson, 1983; Wilkinson et al., 2001).
Chilling effects are partially modulated by changes in the concentrations of endogenous hormones. Downregulation of growth-promoting hormones occurs in Triticum aestivum L., where cold exposure (1 day at 4°C) decreases foliar levels of bioactive cytokinins and auxins and increases deactivation of gibberellins (Kosová et al., 2012). Chilling-induced decreases in root hydraulic conductance (e.g., Markhart et al., 1979) rapidly (within minutes) cause foliar turgor loss (Lee et al., 1993; Melkonian et al., 2004; Pardossi et al., 1992), which can ultimately (hours later) trigger foliar abscisic acid (ABA) accumulation (Lee et al., 1993; Pardossi et al., 1992). Chilling can also increase ethylene emission (in tomato, Ciardi et al., 1997; in bean, Guye et al., 1987; in wheat, Kosová et al., 2012), which may enhance chilling tolerance of cold-sensitive species (Ciardi et al., 1997; Guye et al., 1987). Whether these phytohormonal changes are consistent under different T regimes involving chilling has not been thoroughly explored.
Although the root system can acclimate to chilling by increasing root hydraulic conductance (Vernieri et al., 2001), maintaining an adequate plant water status also requires optimal stomatal control, which is sometimes not achieved. To elicit stomatal closure at low T, higher ABA levels must be accumulated in detached bean (Phaseolus vulgaris) leaves when ABA was supplied via the transpiration stream (Pardossi et al., 1992), or detached epidermis must be incubated in higher ABA concentrations (Honour et al., 1995). Collectively, these observations indicate a loss of stomatal sensitivity to ABA that occurs in both whole leaves and individual guard cells. In some cases, stomata can “lock open” at low temperatures, causing sustained wilting (e.g., Eamus and Wilson, 1983), with xylem supplied ABA causing stomatal opening in detached bean leaves at 5°C, but stomatal closure at 22°C (Eamus and Wilson, 1983). Thus, under specific chilling circumstances, decreased stomatal sensitivity to ABA may determine plant fitness and survival, but the involvement of other phytohormones in this response is not clear.
Physiological responses to chilling partially depend on the T which plants were exposed to before chilling. For example, chill-hardening in sensitive species such as bean can induce similar stomatal closure to chill-resistant species such as pea (Pisum satvium), but non-hardened plants maintained open stomata despite wilting (Eamus and Wilson, 1984). Here, we investigate whether the T during early seedling development modifies physiological responses to low T, using a reciprocal T-transfer experiment in controlled environment chambers. Initially, 16 European soybean genotypes were exposed to chilling temperatures to choose genotypes that varied in leaf gas exchange responses. From these experiments, six genotypes were selected to assess the impact of two growth temperatures (14°C and 24°C) imposed throughout seedling germination until the first unifoliate leaf emerged, on subsequent physiological responses at those temperatures. We hypothesised that the initial growing T affects later leaf gas exchange by modulating leaf water status and hormonal concentrations. Since prolonged chilling caused substantial accumulation of the ethylene precursor ACC coincident with stomatal opening and low leaf water content (LWC), we also hypothesised that applying the ethylene antagonist 1-MCP could partially reverse this maladaptive stomatal response. Taken together, our analyses reveal that ethylene is involved in stomatal insensitivity to chilling temperatures.
2 MATERIALS AND METHODS
2.1 Experimental design
- (i)
Assessing genotypic variation:
Experiments I and II tested 16 European soybean genotypes to analyse their gas exchange response to L and H. Seeds were germinated and grown at H until the tip of the unifoliate leaf was visible, and then transferred to L or maintained at H (these treatments are denoted as HL and HH). The following commercial varieties (usually cropped at high latitudes in Europe) were tested: Alexa, Viola, Marquise and Aurelia from ‘Dutchsoy’ (Netherlands), Merlin, Abelina and Regina from ‘Saatbau Linz’ (Austria); Amarok, CH 22511, Toutatis, Obelix, Gallec and Tiguan from ‘Delly seed and plants’ (Switzerland); Vilshanka and Pripyat from ‘Soya UK’; and Melanie from ‘Saatzucht Gleisdorf’ (Austria). All genotypes belong to maturity group 000 except Vilshanka and Pripyat, which are 0000. Experiments I and II measured 3 and 6 replicate plants per genotype respectively. From these experiments, six genotypes aiming to represent the range of photosynthetic performance at low T were chosen for further experiments.
- (ii)
Combined temperature experiments:
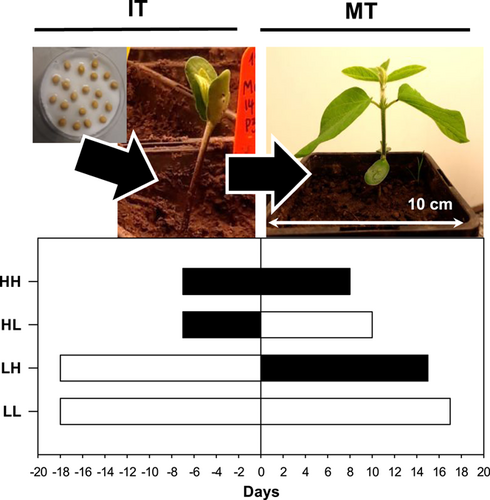
Experiments III, IV and V germinated seeds and grew seedlings at either H or L initial temperature (IT) and, once the tip of the first unifoliate leaf was visible, maintained at the same T or transferred to the other T (measurement temperature [MT]). These treatments are denoted as LL, LH, HL and HH. Because T affects development rates, the duration of exposure to IT and MT depended on each T combination (Figure 1). In Experiments III and IV, in each T combination, six genotypes were tested: Alexa, Gallec, Marquise, Obelix, Vilshanka and Viola. Experiment V used the genotype Viola with a typical response to low T. In each experiment, for each IT × MT × G (genotype) combination, 6–10 replicate plants were used.
- (iii)
Abscisic acid and ethylene-specific experiments
| Experiment | Initial T | Treatment T | Final T combination | Genotypes | Replicates per treatment | Additional treatment | Reported measurements |
|---|---|---|---|---|---|---|---|
| I | 24 | 14 + 24 | HL + HH | 16 | 3 | No | Gas exchange |
| II | 24 | 14 + 24 | HL + HH | 16 | 6 | No | Gas exchange |
| III | 14 + 24 | 14 + 24 | LL + LH + HL + HH | 6 | 10 | No | Gas exchange + LWC |
| IV | 14 + 24 | 14 + 24 | LL + LH + HL + HH | 6 | 6 | No | Gas exchange + hormones |
| V | 14 + 24 | 14 + 24 | LL + LH + HL + HH | 1 | 10 | No | Gas exchange + hormones |
| LL + HH | 1 | 6 | 1-MCP spraying | Gas exchange | |||
| VI | 14 + 24 | 14 + 24 | LL + HH | 1 | 10 | 1-MCP spraying | Gas exchange |
| VII | 14 + 24 | 14 + 24 | LL + HH | 1 | 7 | No | Ethylene emission |
| VIII | 14 + 24 | 14 + 24 | LL + HH | 1 | 6 | ABA spraying | Stomatal conductance |
- Note: In experiments I and II, 16 genotypes were tested, from which 6 were selected based on contrasting photosynthetic performance at low temperature. Experiments V and VI applied the ethylene antagonist 1 methylcyclopropene (1-MCP) while experiment VII measured foliar ethylene emission and Experiment VIII applied ABA.
- Abbreviations: ABA, abscisic acid; LWC, leaf water content.
Experiments V, VI, VII and VIII used plants grown and maintained at either continuously low or high T (LL and HH, respectively), to analyse the specific roles of ABA and ethylene in regulating stomatal responses. Experiments V and VI used the genotype Viola. After full leaf expansion, the plants were removed from the controlled environment cabinet for mid-morning (10:00) foliar treatments. Half of the plants of each T treatment were sprayed with a control solution (1% ethanol) and half with 1-methylcyclopropene (1-MCP) at 9.25 mg active ingredient L−1 (AgroFresh Ltd.) dissolved in 1% ethanol until the spray dripped from the leaves. Preliminary dose-response experiments established this concentration was sufficient to induce ethylene insensitivity, without any phytotoxicity symptoms. Six hours after spraying, leaf gas exchange was measured as described below. Experiments VII and VIII used the genotype Alexa (Viola seed was unavailable) with similar physiological responses at LL and HH temperature combinations. Experiment VII measured foliar ethylene evolution as described under the “hormone analysis” section. Experiment VIII sprayed half of the plants in each T treatment with a control solution (1% ethanol) and half with 3 mM ABA (dissolved in 1% ethanol) after full unifoliate leaf expansion. Stomatal conductance was measured 3 h later with a transient time porometer (Model AP4, Delta-T Devices) placed in each controlled environment cabinet (to equilibrate) at least 30 min before measurements.
2.2 Growing conditions
Plants were grown in Microclima 1750 controlled environment cabinets (Snijder Scientific) with 1.4 m2 of growing space, and set at 12 h photoperiod (08:00–20:00) and 65% relative humidity in all the treatments (Figure S1). The cabinets provided approximately 300 µmol m−2 s−1 of photosynthetically active radiation at top of the pot by a combination of Sylvania: T5 FHO/54W/840/1149mm, T5 FHO/24W/840/549mm and Brite GrowT8/58W/1200mm fluorescent tubes. In all experiments, soil T, air T and air relative humidity were monitored with EasyLog sensors (Lascar electronics) using at least 6 sensors per cabinet. Sensors for soil T were placed in the middle of pots (10 cm depth) lacking plants, to avoid the sensor constraining root growth. Sensors for air T and relative humidity were placed 10 cm above the pot surface. Average air T in the cabinets set at 14°C was 16.25°C, while for the cabinets set at 24°C, final average T was 25.25°C (Figure S1A) due to defrosting cycles that raised T during the night. Within cabinets, spatial variation in air T never exceeded 1°C. Average soil T was 24.14°C for the cabinets set at 24°C and 14.35°C for the cabinets set at 14°C, and T fluctuations within the cabinets were always lower than 2°C (Figure S1A). Relative humidity was maintained between 50% and 60% across experiments and treatments (Figure S1B), thus average VPD was 0.8 and 1.45 kPa in the cabinets set at 14°C and 24°C, respectively.
In all experiments, seeds were pre-germinated inside the cabinets allocated to each treatment, on Petri Dishes with moistened filter paper, and distilled water was added twice a day until germination. Once germinated, three seedlings were transplanted to each pot at 2 cm depth, and thinned to one seedling after emergence. Plastic pots of 2 L and 20 cm depth were used, filled with sieved John Innes No 2 compost. Plants were distributed in a randomised complete block design (1 replicate plant per block) inside each cabinet, and irrigated as needed throughout the experiment to keep the soil moist.
2.3 Gas exchange measurements
Leaf length was measured daily to determine when leaves had reached full expansion, allowing subsequent leaf gas exchange measurements using infrared gas analysis (Model Li-6400XT, Li-Cor) set at 400 μmol photons m−2 s−1, 400 ppm of CO2, and a T of 14 or 24°C depending on the treatment. In temperature transfer experiments (I–V) measurements were made between 11:00 and 14:00 on fully expanded unifoliate leaves in at least five plants per each IT × MT × G combination. In the ethylene-antagonist experiments (V, VI), leaf gas exchange measurement began at 16:00 (6 h after foliar treatments were applied). To minimise environmental fluctuations during the measurements, the Li-Cor instrument was placed inside the cabinets and remotely managed from outside (Figure S2).
2.4 LWC measurements
Plants were harvested after full expansion of the unifoliate leaves. Seedlings were dissected into stems (with cotyledons), unifoliate leaves, and trifoliate leaves when present. Each plant part was weighed separately immediately after cutting (fresh weight [FW]) and then dried in an oven at 60°C until constant weight (dry weight [DW]).
2.5 Hormone analyses
After full leaf expansion, an entire and intact unifoliate leaf was cut from the plant and frozen in liquid N2. Afterwards, samples were freeze dried and weighed before hormone determinations. Phytohormones including cytokinins (trans-zeatin, tZ, zeatin riboside, ZR, and isopentenyl adenine, iP), gibberellins (GA1, GA3, and GA4), indole-3-acetic acid (IAA), ABA, salicylic acid (SA), jasmonic acid (JA), and 1-aminocyclopropane-1-carboxylic acid (ACC) were analysed according to a protocol adapted from Albacete et al. (2008) using each unifoliate leaf as an independent sample.
Freeze-dried leaf material (0.01 g DW) was extracted with methanol/water/formic acid solution (15/4/1 by volume, pH 2.5) with 10 μL of an internal standard mix, comprising deuterated phytohormones ([2H5]tZ, [2H5]tZR, [2H6]iP, [2H2]GA1, [2H2]GA3, [2H2]GA4, [2H5]IAA, [2H6]ABA, [2H4]SA, [2H6]JA, [2H4]ACC, Olchemim Ltd.) at 1 μg mL−1, added to each sample. After adding the standards, samples were extracted at 4°C overnight. Solids were then separated by centrifugation (20 000 g) for 15 min and extracted again for 30 min in an additional 5 mL of the extraction mixture. The supernatants were filtered through a Sep-Pak Plus C18 cartridge (SepPak Plus) to remove interfering lipids and plant pigments, and evaporated at 40°C under a vacuum until samples were near dryness or all solvents were removed. Any remaining residue was dissolved in 1 mL methanol/water (20/80, vol/vol) in an ultrasonic bath. Samples were filtered through 13 mm diameter Mylex filters with 0.22 μm pore diameter nylon membrane (Millipore). Filtered extracts (10 μL) were injected into a U-HPLC-MS system comprising an Accela Series U-HPLC (ThermoFisher Scientific) using a heated electrospray ionisation interface. Xcalibur software version 2.2 (ThermoFisher Scientific) was used to obtain mass spectra. Calibration curves were constructed to quantify each plant hormone (1, 10, 50, 100 μg L−1) corrected for 10 μg L−1 deuterated internal standards.
Experiment VII measured foliar ethylene emission. A fully expanded unifoliate leaf was removed from each plant at its junction with the main stem, immediately weighed, then placed into a 50 mL boiling tube containing moistened paper, with the petiole base at the end of the tube. The tube was made airtight by stoppering with a rubber Suba-Seal (Chemglass Life Sciences) and the leaf incubated at 24°C (±2°C) for 120 (±10) minutes (precisely recorded to the minute) in the same orientation as it was on the plant. Ethylene evolution was measured using an ETD-300 real-time ethylene analyser (Sensorsense) and quantified as nL g−1fresh weight h−1.
2.6 Statistical analyses
Data were analyzed with the STATISTICA 5.1 software (StatSoft, Inc.), using analysis of variance (ANOVA) to detect statistical differences between factors and their interactions. In Experiments I and II, T and genotype were analyzed as fixed factors. In Experiments III and IV, initial (IT) and measurement (MT) temperatures and genotype were analyzed as fixed factors. Since Experiment V had a single genotype, it was analyzed separately using IT and MT as fixed factors. In experiments where ABA or the ethylene antagonist 1-MCP were applied to a single genotype (V, VI and VIII) grown under LL and HH treatments, two-way ANOVA determined effects of T, foliar treatment and their interaction. In all cases, replicate experiments and plants within each T combination and genotype (and foliar treatment when present) were treated as statistical replicates. LWC, Gs and An were measured in both unifoliate leaves of each plant, and data were averaged within the same plant for the statistical analyses. When factors or their interactions were significant, means were compared by the LSD test (p < 0.05). Regression analyses utilised genotypic means (at least five plants per T combination) and significance was assessed through the F-test (p < 0.05).
3 RESULTS
3.1 Leaf gas exchange and water status
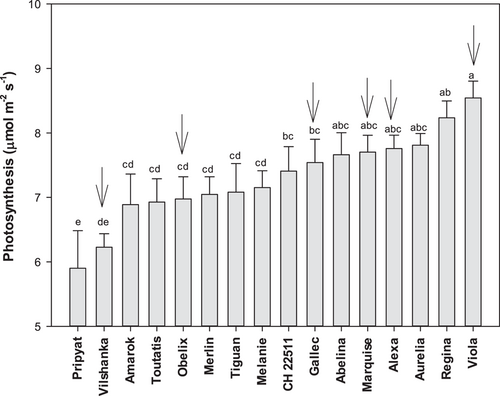
In Experiments I and II comprising 16 genotypes, low temperature (14°C) approximately halved photosynthesis (An) compared to 24°C. Photosynthesis at low T was 30% higher in the best (Viola) than worst (Pripyat) performing genotype (Figure 2), and significantly related with An at high T (r2 = 0.65, p < 0.001, n = 16). Low temperature also significantly decreased stomatal conductance (Gs) by 64%, with greater variation than An across genotypes (Figure S3). There was no relationship between Gs at high and Gs at low T (r2 = 0.21, not significant, n = 16), due to a significant T x genotype interaction. Based on these results, 6 genotypes comprising the range of photosynthetic performance at low T were chosen for further experiments (Figure 2).
Experiments III and IV comprised contrasting T from sowing until the tip of the unifoliate leaves was visible, combined with contrasting T thereafter, resulting in 4 T combinations (LL, LH, HL and HH) across 6 different genotypes (Table S2). Photosynthesis (An) of plants maintained at high T was 85% higher than plants maintained at low T (Figure 3a). When plants were measured at low T, An was independent of the initial T. By contrast, when plants were measured at high T, An of plants maintained at high T (HH) was 46% higher than plants initially grown at low T (LH). Thus, initial low T did not enhance An at low T, but did diminish An of plants transferred to high temperatures. Unexpectedly, stomatal conductance (Gs) of LL plants was 16% higher than Gs of HH plants (Figure 3b). Under low T, Gs more than doubled in plants maintained at low T than those originally grown at high T (HL). In contrast, under high T, plants maintained at high T (HH) had 25% higher Gs than those originally grown at low T (LH). Thus, while early chilling reduced Gs under high T (LH vs. HH) as with An, it increased Gs under continuous low T (LL vs. HL) suggesting a loss of stomatal control. Indeed, plants maintained at low T had strikingly lower LWCs, less than 60%, whereas plants kept at high T had much higher values (84%) (Figure 3c). When measured at low T, LWC of plants that were originally exposed to high T was much higher (HL, 80%) than that of plants maintained at low T (LL, 58%). Paradoxically, when measured at high T, LWC of plants maintained at high T was lower (HH, 84%) than that of plants originally exposed to low T (LH, 92%). Thus, T during leaf initiation affected the response of LWC to chilling.

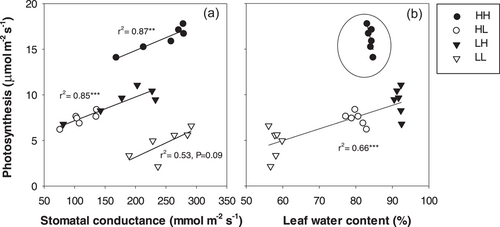
Generally, An was linearly related to Gs in all T combinations (Figure 4a). At a given Gs, An of plants maintained at high T (HH) was higher than plants exposed to a reciprocal T transfer (LH and HL). In turn, plants maintained at low T had the lowest values of An despite high Gs, implying that non-stomatal limitations restricted photosynthesis under chilling. Furthermore, An declined with leaf water status in plants that experienced low T at some point in their development (r2 = 0.66***, Figure 4b). Thus, continuous exposure to low T in LL plants decreased An even though Gs was the highest of all T combinations.
3.2 Phytohormone concentrations and interactions
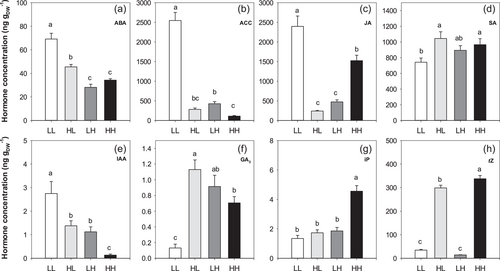
In most cases, both IT and MT significantly affected hormone concentrations in the unifoliate leaves (Table 2). Since GA4 concentration was stable across T treatments, these data are not shown. Very low frequencies of detection of ZR and GA1 precluded their statistical analyses. Most hormones and their precursors (ABA, ACC, JA, SA, IAA) showed qualitatively similar effects of the low T treatment between replicate experiments in a single cultivar Viola (Figure S4). Across 6 genotypes in Experiment IV (Table S3), chilling increased foliar ABA, ACC and JA concentrations, with initial T having a variable effect (Figure 5). ABA concentrations of LL plants were consistently twofold higher than HH plants in two independent experiments (Figure 5a and Figure S4). Under low T, ABA levels were 51% higher in plants maintained at low T (LL) than plants originally grown at high T (HL), whereas ABA levels at high T were independent of initial growth T (HH = LH). Foliar ABA concentration increased as LWC declined (r2 = 0.75***, Table 3) and also increased with ACC concentration (r2 = 0.71***, Table 3) across all treatments. Thus, low T increased foliar ABA concentrations.
| Gs | An | LWC | ABA | ACC | GA3 | GA4 | IAA | iP | JA | SA | tZ | |
|---|---|---|---|---|---|---|---|---|---|---|---|---|
| IT | *** | *** | *** | * | *** | ** | NS | *** | *** | *** | *** | *** |
| MT | ** | *** | *** | *** | *** | * | NS | *** | *** | * | NS | NS |
| G | *** | *** | NS | NS | NS | NS | NS | *** | *** | NS | *** | NS |
| IT × MT | *** | *** | *** | *** | *** | *** | NS | NS | *** | *** | NS | * |
| IT × G | * | NS | NS | NS | NS | NS | NS | NS | NS | NS | ** | NS |
| MT × G | NS | ** | NS | NS | NS | NS | NS | NS | NS | NS | * | NS |
| IT × MT × G | ** | NS | NS | NS | NS | NS | NS | NS | NS | NS | NS | NS |
- Note: Initial temperature (IT) and measurement temperature (MT) denote the T from sowing until the tip of unifoliate leaf was visible, or thereafter until full leaf expansion, respectively, and genotype (G) includes six European soybean genotypes. Gas exchange was measured in Experiments III and IV, LWC was measured in Experiment III and hormone concentration was measured in Experiment IV. Statistical significance represented as: *p < 0.05; **p < 0.01, and ***p < 0.001, and NS indicates no significant relationship.
- Abbreviation: ANOVA, analysis of variance.
| ABA | ACC | IAA | iP | GA3 | GA4 | JA | SA | tZ | An | Gs | LWC | |
|---|---|---|---|---|---|---|---|---|---|---|---|---|
| ABA | 1 | 0.71*** | 0.38** | (−)0.2* | (−)0.21* | NS | 0.39** | NS | NS | (−)0.42*** | NS | (−)0.75*** |
| ACC | 1 | 0.52*** | (−)0.42*E | (−)0.39* | NS | 0.48*** | NS | (−)0.36** | (−)0.41*** | 0.16* | (−)0.76*** | |
| IAA | 1 | 0.24* | 0.11 | NS | 0.11 | NS | 0.24* | (−)0.45*** | 0 | (−)0.32** | ||
| iP | 1 | NS | NS | 0.2 | NS | 0.34** | 0.69*** | 0.17* | 0.08 | |||
| GA3 | 1 | NS | (−)0.58*** | NS | NS | NS | (−)0.53*** | 0.46*** | ||||
| GA4 | 1 | NS | NS | NS | NS | NS | 0.05 | |||||
| JA | 1 | NS | NS | NS | 0.74***(L) | 0.56*** | ||||||
| SA | 1 | NS | NS | NS | 0.07 | |||||||
| tZ | 1 | 0.34** | NS | 0.06 | ||||||||
| An | 1 | NS | 0.32 | |||||||||
| Gs | 1 | 0.14 | ||||||||||
| LWC | 1 |
- Note: Each r2 value comprised mean values (5 plants per genotype) of 6 genotypes × 4 temperature combinations. Significant correlations are indicated by asterisks (*p < 0.05, **p < 0.01, ***p < 0.001) and not significant relationships are denoted by NS. Letters denote nonlinear fits (E: exponential; L: logarithmic) and (−) indicates negative correlations.
ACC concentrations of LL plants were consistently 16- to 23-fold higher than HH plants (Figure 5b and Figure S4). Prolonged chilling enhanced ACC levels, being ninefold higher in LL plants than those initially grown at high T (HL), and fourfold higher in plants initially grown at low T (LH) than HH plants. Foliar ACC levels increased with decreasing LWC (r2 = 0.76***, Table 3) and with increasing IAA levels (r2 = 0.52***, Table 3). Thus, low T increased foliar ACC concentrations. Since ACC accumulation is not always correlated with ethylene emission, Experiment VII measured ethylene emission in plants exposed to continuously low (LL) or high T (HH) temperature. Leaf ethylene evolution was significantly (p < 0.05) higher (0.50 ± 0.11 nL g FW−1 min−1; mean ± SE, n = 4) in LL plants than in HH plants (0.15 ± 0.07 nL g FW−1 min−1; mean ± SE, n = 4). Thus chilled plants had 3.3 times higher ethylene emission.
JA concentrations of LL plants were 57%–84% higher than HH plants (Figure 5c and Figure S4). When measured at low T, JA levels were 10-fold higher in LL plants than plants initially grown at high T (HL). By contrast, at high T, JA levels were threefold higher in HH plants than plants initially grown at low T (LH). Thus, JA concentrations of plants that were transferred between temperatures were much lower (and statistically similar) than plants exposed to a single T. Across treatments, JA levels were negatively correlated with GA3 (r2 = 0.58***, Table 3). Foliar SA levels were much more similar across the four T combinations, with similar or slightly lower SA concentration in LL plants than in plants early developed at high T (Figure 5d and Figure S4). Thus, T dramatically changed the concentrations of stress-related hormones.
Auxin (IAA) levels increased with duration of exposure to low T, with LL plants consistently having 20- to 33-fold higher IAA levels than HH plants (Figure 5e and Figure S4). At low T, IAA levels of LL plants was double that of plants initially grown at high T (HL), whereas at high T, plants initially grown at low T (LH) had eightfold higher IAA levels than those maintained at high T. Gibberellic acid (GA3) levels in Viola plants showed variable temperature responses in replicate experiments (Figure S4), but in Experiment IV (comprising all 6 genotypes) plants maintained at high T had fivefold higher GA3 levels than plants maintained at low T (Figure 5f). GA3 levels were ninefold higher in plants previously exposed to high T (HL) than in LL plants, whereas the initial T had no effect on GA3 levels measured at high T. Likewise, temperature responsiveness of cytokinin (iP and tZ) levels of Viola varied between experiments (Figure S4). In Experiment IV, low T exposure during leaf development decreased cytokinin levels, especially for iP (Figure 5g). Plants maintained at high T had 2.8-fold higher iP levels than all other treatments (Figure 5g). For tZ, concentrations of HH plants were 10-fold higher than LL plants (Figure 5h). When measured at low T, plants originally exposed to high T (HL) had ninefold higher tZ concentrations than LL, whereas at high T, HH plants had 24-fold higher tZ concentrations than those initially grown at low T. Thus, the T treatments substantially altered hormones associated with cell division and expansion (IAA, GA3, cytokinins). In Experiment IV with 6 different genotypes, continuous high T (HH) resulted in higher concentrations of tZ (10-fold), GA3 (5-fold), iP (3-fold) and SA (30%) than in LL plants. While leaf hormone concentrations of plants transferred between T were generally intermediate between those maintained at a single T (except for JA, tZ and GA3) in Experiment IV, hormones could also be grouped according to their response at a single T. Across two independent experiments, continuous low T (LL) consistently increased ACC (16- to 23-fold), IAA (20- to 33-fold), ABA (2-fold) and JA (by 70%) concentrations.
3.3 Hormonal modulation of physiological responses
Overall, photosynthesis and stomatal conductance were significantly related to hormone levels with plants maintained continuously under low T (LL) often showing a distinct behaviour, which justified their exclusion in the fitted regressions. Stomatal conductance declined with leaf ABA concentration across T combinations (r2 = 0.61***) except in the LL treatment, in which higher ABA levels showed no correlation with Gs (Figure 6a). No significant relationship was detected between Gs and ACC levels (Figure 6b), whereas Gs was positively related with iP (r2 = 0.51***, Figure 6c) and with JA levels (r2 = 0.53***, Figure 6d). Thus, multiple phytohormones were correlated with stomatal responses.
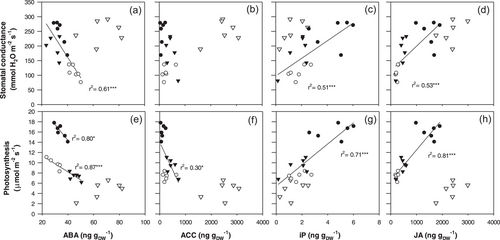
Photosynthesis declined with ABA concentration across T combinations (r2 = 0.87***) with a higher slope in plants maintained continuously under high T (r2 = 0.80*, Figure 6e). Photosynthesis also decreased as ACC levels increased (r2 = 0.30*, Figure 6f). In contrast, An was positively related to iP (r2 = 0.71***, Figure 6g) and to JA (r2 = 0.81***, Figure 6h). Generally, stomatal and photosynthetic responses to endogenous hormone concentrations were similar, with plants exposed to prolonged chilling (LL plants) behaving differently.
3.4 ABA and ethylene-specific experiments
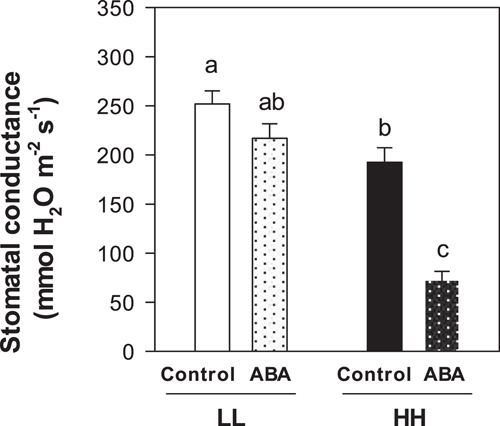
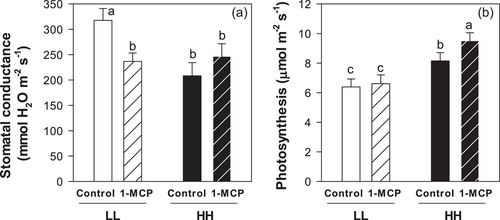
An independent experiment tested stomatal sensitivity to foliar ABA spraying, with Gs of LL plants 31% higher than in HH plants. Foliar ABA application significantly decreased stomatal conductance of HH plants (by 62%), but did not significantly decrease Gs of LL plants (Figure 7). Since Gs of plants exposed to prolonged low T was less sensitive to exogenous ABA, we hypothesised that ethylene could be involved. Two additional independent experiments applied the ethylene-antagonist 1-MCP after full leaf expansion. Again, Gs of LL plants was 52% higher than HH plants (Figure 8a) whereas An was reduced by 27% in LL plants (Figure 8b). After foliar 1-MCP application, Gs decreased by 25% in LL plants but did not change in HH plants (Figure 8a). This stomatal response was not related to changes in An, which remained stable at low T and showed a slight yet significant increase (+17%) after 1-MCP application in HH plants (Figure 8b).
4 DISCUSSION
4.1 Stomatal regulation in chilled plants
Of the applied T treatments, prolonged chilling caused the highest Gs of soybean as observed in other species (bean, Eamus and Wilson, 1983, 1984; Pardossi et al., 1992; rice, Lee et al., 1993; pea, Cooper et al., 2018) and the lowest leaf water status (Figure 3c here, 75% RWC in Bagnall et al., 1983; 60% RWC in Vernieri et al., 1991). While this response has been associated with diminished stomatal sensitivity to ABA (Honour et al., 1995; Pardossi et al., 1992) and even ABA promotion of stomatal opening (Eamus and Wilson, 1984), here we show that multiple changes in foliar hormone concentration were related to this maladaptive stomatal response (Figure 5). Especially prominent was the accumulation of the ethylene precursor ACC (Figure 5b and Figure S4), consistent with increased ethylene evolution (3.3 times higher in LL plants). Foliar applications of the ethylene antagonist 1-MCP to chilled plants decreased Gs to the levels of plants grown at high T (Figure 8a), as in reports where its application restored stomatal sensitivity to soil drying in aged wheat leaves (Chen et al., 2013) and stomatal sensitivity to exogenous ABA in ozone-fumigated plants (Wilkinson and Davies, 2009). To our knowledge, this is the first report where 1-MCP partially restores stomatal regulation in chilled plants, suggesting that pre-emptive chemical treatments could overcome the deleterious effects of a chilling stress on plant water relations, and potentially, improve survival.
Nevertheless, the duration and temporal sequence of chilling events substantially altered leaf gas exchange responses and hormone concentrations. Prior exposure to optimal temperatures (HL plants) allowed chilling-induced stomatal closure (e.g. Markhart et al., 1980; Strauss et al., 2007; Van Heerden et al., 2004; Figure 3b here), related to a small decrease in LWC that stimulated modest ABA accumulation. Importantly, these plants showed a similar relationship between Gs and ABA as plants measured under high T (Figure 6a) and limited ACC accumulation (Figure 5b), indicating that dynamic changes in hormone accumulation and sensitivity in response to fluctuating temperatures are important in mediating leaf gas exchange. To fully understand stomatal regulation, it is important to investigate chilling effects on plant hormone status.
4.2 Changes in hormone concentrations
Chilling-induced foliar ABA accumulation (Figure 5a here; in bean, Eamus and Wilson, 1983; Pardossi et al., 1992; Vernieri et al., 1991; in rice, Lee et al., 1993) could be related with reduced leaf turgor (Pierce and Raschke, 1981) or cell volume (Sack et al., 2018) stimulating leaf ABA biosynthesis (r2 = 0.75*** for LWC vs. ABA, Table 3). Indeed, chilling plants in a water-saturated atmosphere (to prevent turgor loss) suppressed leaf ABA accumulation (Eamus et al., 1983; Vernieri et al., 1991, 2001). While prior exposure to high T (HL plants) allowed normal stomatal closure as in bean (Eamus and Wilson, 1983; Pardossi et al., 1992) and rice (Lee et al., 1993), much higher ABA accumulation in LL plants coexisted with high stomatal conductance (Figure 6a), and stomata were unresponsive to exogenous ABA spraying (Figure 7). This loss of stomatal sensitivity to ABA at low T has been reported in thermophilic (maize, Rodriguez and Davies, 1982; bean, Eamus and Wilson, 1983; Pardossi et al., 1992) and cold tolerant species (Honour et al., 1995; Wilkinson et al., 2001), with many potential mechanisms proposed.
A complete ABA response may require other antitranspirants such as JA to accumulate (de Ollas and Dodd, 2016). However, prolonged chilling also stimulated substantial foliar JA accumulation (being 10-fold higher in LL than HL plants, Figure 5c), as in wheat (Kosová et al., 2012) and rice (Du et al., 2013; Maruyama et al., 2014), with cold temperatures upregulating genes involved in JA biosynthesis and signalling (Du et al., 2013). While exogenous JA promotes stomatal closure (Gehring et al., 1997; Suhita et al., 2004), an opposite correlation occurred here (Figure 6d) requiring further work with JA biosynthesis/signalling inhibitors to determine its physiological significance. Since JA and ABA have overlapping signalling pathways involving reactive oxygen species and nitric oxide as second messengers (Acharya and Assmann, 2009), and stomata of the ABA insensitive mutant abi2-1 do not respond to exogenous JA (Munemasa et al., 2007), an analogous loss of stomatal response to JA may also occur.
Alternatively, other hormones such as cytokinins, gibberellins, auxins, and ethylene can antagonise ABA-induced stomatal closure (Dodd, 2003; Tanaka et al., 2005, 2006). Of these, only IAA and the ethylene precursor ACC accumulated with prolonged chilling (LL plants) compared to HL plants that responded normally to ABA. As in our work, chilling induced foliar auxin accumulation (in wheat, Kosová et al., 2012; Veselova et al., 2005; in rice, Du et al., 2013) and ethylene emission (in wheat, Kosová et al., 2012; in tomato, Ciardi et al., 1997), although stomatal responses were not always measured. Since auxins (and cytokinins) inhibit ABA action by promoting ethylene biosynthesis (Tanaka et al., 2006), further experiments are needed to resolve whether auxin is involved.
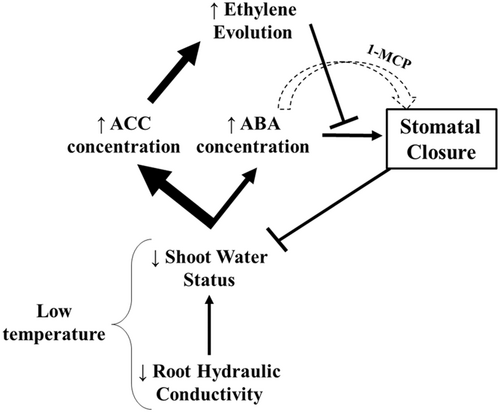
Here, ACC accumulation may play a major role in stomatal insensitivity to ABA of LL plants, since it attenuates ABA-induced stomatal closure in Arabidopsis epidermal strips (Tanaka et al., 2005). Furthermore, the ethylene antagonist 1-MCP restored stomatal sensitivity to ABA in epidermis of the ethylene overproducing Arabidopsis mutant eto1-1 (Tanaka et al., 2005) and stomatal sensitivity to drying soil of aged wheat leaves (Chen et al., 2013). Further, treating wild type tomato plants with ethylene (5 μL L−1 during 24 h) increased guard cell flavonol accumulation and thus, decreased levels of reactive oxygen species and ABA-induced stomatal closure, which was not observed in the ethylene insensitive Neverripe (Nr) mutant (Watkins et al., 2017). Since ethylene-mediated stomatal insensitivity to ABA has not been reported before in chilled plants, its potential significance was tested by supplying the ethylene antagonist 1-MCP to HH and LL plants. Although stomata of HH plants were unresponsive to 1-MCP, stomatal conductance of LL plants decreased (Figure 8a), suggesting that ethylene prevents stomatal closure of chilled plants. Disentangling the role of downstream second messengers such as reactive oxygen species (Watkins et al., 2017), cytoplasmic alkalinization (Shi et al., 2017) and calcium ions (Zhao et al., 2007) in this ethylene-mediated stomatal response requires further experiments. Taken together, prolonged chilling throughout leaf development (LL) produced a maladaptive stomatal response not observed in leaves that initially developed at high T (HL), related to ninefold higher ACC accumulation in the former. Although prolonged low T exposure stimulated accumulation of multiple foliar hormones, ACC seemed especially important in preventing normal stomatal closure (Figure 9).
4.3 Photosynthetic limitations in chilled plants
Unlike stomatal responses, chilling at any time during leaf development decreased An. At the same Gs, photosynthetic rates declined in the order: HH > HL = LH > LL (Figure 4a), suggesting non-stomatal limitations of thylakoid electron transport and/or carbon reduction (Allen and Ort, 2001). Night-chilling (23/8°C) and high day-time irradiance (1000 μmol m−2 s−1) halved soybean photosynthesis (compared to plants maintained at 23/20°C) with decreased O2 evolution rate and RuBP regeneration capacity (Van Heerden et al., 2004). Here, the mild low temperature (14°C) and low irradiance (300 μmol m−2 s−1) suggests limited photoinhibition, with thylakoid electron transport (although not measured) unlikely to restrict An.
While low T acclimation can enhance An at low T (e.g., Huner et al., 1993; Stitt and Hurry, 2002; Strand et al., 1999), An of plants always (LL) or transiently (HL) exposed to low T was similar (Figure 3a), and initial growth at low T penalised An at high T (An of LH plants was 31% lower than HH plants, Figure 3a). In contrast, Arabidopsis leaves developed at 5°C had higher An than leaves developed at 23°C when both were measured at 23°C, related to a shift in the partitioning of carbon from starch and towards sucrose, higher protein concentration and increased phosphate availability (Strand et al., 1999). Critically low leaf water status likely restricted An of LL plants (Figure 3c), since An drops sharply at leaf relative water contents below 75%, with decreased cell volume and increased anion (phosphate and sulfate) concentrations in the chloroplast stroma non-specifically inhibiting the activity of many enzymes such as Rubisco (Kaiser et al., 1986). Thus, leaf dehydration could have inhibited An of LL plants.
Direct hormonal effects, such as increased foliar ACC concentrations, may also limit An (Figure 6f), consistent with ethylene inhibiting soybean photosynthesis (Taylor and Gunderson, 1988) by decreasing electron transport capacity (Wullschleger et al., 1992) as well as Calvin Cycle activity (Xie et al., 2017). This may also explain that 1-MCP application significantly increased soybean photosynthesis by 17% in HH plants (Figure 8b) similar to Djanaguiraman et al. (2011). Residual ACC accumulation (and ethylene evolution) from prior low T exposure may also have limited An of LH plants, although substantially lower cytokinin levels (iP and tZ), which seem to alleviate stress-induced degradation of photosynthetic proteins (Chernyad'ev, 2009), may also be involved. Although our hormone analyses could not distinguish trans-zeatin (tZ), and cis-zeatin (cZ) which likely have different biological activity, the latter had much lower concentrations and was barely detectable in soybean leaves irrespective of leaf water status (Le et al., 2012). Taken together, chilling differentially affected photosynthesis depending on initial growing T, with low LWCs most likely limiting An of LL plants and hormones directly reducing An in HL and LH plants, additional to any stomatal limitation.
5 CONCLUSIONS
Soybean expansion into higher latitudes as well as the observed shift to earlier sowing dates in temperate regions expose this crop to lower temperatures during its initial stages. Understanding how these low temperatures affect crop establishment is critical to rationally design future genotype × management combinations for these cropping systems. Chilling decreased leaf water status and photosynthetic rates of the unifoliate leaf of soybean seedlings, with variable effects according to the initial growing T. Altered hormone concentrations seem to modulate these responses, with prolonged low T exposure causing massive ACC accumulation, likely preventing stomatal closure despite high ABA levels (Figure 9), exacerbating water loss. Applying the ethylene antagonist 1-MCP reversed chilling-induced stomatal opening, thereby mitigating this maladaptive response. While genetic variation in ethylene accumulation and sensitivity may allow more effective stomatal control, our results also suggest chemical opportunities to minimise the deleterious effects of prolonged chilling.
ACKNOWLEDGEMENTS
MA thanks UUKi Rutherford Fund Strategic Partner Grants (Grant Number RF-2018-78) and the UK Department for Business, Energy & Industrial Strategy (BEIS) for a Fellowship to conduct this research. We also thank the Royal Society (IEC\R2\170288) and N8 Agrifood programme for funding this collaborative project.
Open Research
DATA AVAILABILITY STATEMENT
The data that support the findings of this study are available from the corresponding author upon reasonable request.


