Age-related Differences in Volumetric Bone Mineral Density, Structure, and Bone Strength of Surgical Neck of Humerus in Postmenopausal Women
Disclosure: All authors state that they have no conflicts of interest.
Abstract
Objective
Postmenopausal changes in bone mass and structure compromise the mechanical properties of proximal humerus, predisposing it to low-energy fractures with complex morphology. The aim of the study is to investigate associations of bone quality and estimated bone strength of the surgical neck with age after menopause.
Methods
A total of 122 healthy postmenopausal women were recruited from December 2016 to December 2022 and assigned to three groups: the 50–59 years group, the 60–69 years group, and the older than 70 years group. Bone properties of the surgical neck, including volumetric bone mineral density (vBMD), cortical thickness (CTh), the periosteal and medullary size, and estimated indices of bone strength were evaluated by quantitative computed tomography.
Results
Compared to the 50–59 years group, postmenopausal women aged over 70 years were characterized by lower cortical thickness (13.9%) and vBMD (6.65%), as well as reduced strength indices including the minimum and maximum section modulus (Zmin 18.11%, Zmax 21.71%), polar section modulus (Zpol 20.21%), and the minimum and maximum second moments of area (Imax 21.01%, Imin 21.43%). Meanwhile, the difference in periosteal diameter and perimeter, total area in three groups did not reach statistical significance. Both cortical thickness and vBMD value were inversely associated with age, showing 10.56% and 23.92% decline. Imax showed the greatest age-related decrease between age of 54 and 86 years (39.08%), followed by Zmax (−35.77%), Imin (−35.73%), Zpol (−34.90%) and Imin (−23.92%).The strength indices had stronger correlations with cortical thickness than with bone size or density.
Conclusion
In postmenopausal women, aging is associated with a significant decline in cortical bone thickness and mechanical strength of the proximal humerus, especially over the age of 70 years.
Introduction
Proximal humerus fractures, the second most common upper-extremity fractures, are commonly observed in postmenopausal women.1-3 Estrogen deficiency after menopause, mediated mainly through excessive endosteal resorption, gradually produce microstructural deterioration and reduction of bone mass. There is accumulating evidence showing that bone mechanical behavior depends not only on bone mass, but also structural properties as size, shape, and microarchitecture.4-8 In a 15-year prospective study using single-photon absorptiometry, the correlation of endocortical loss and enlarged periosteal diameter at the radius was detected in postmenopausal women.6 In later studies, changes in the outer diameter of the femoral neck parallel the continuous decline of bone mineral density (BMD) during the menopausal transition.7, 8 These results have revealed that the changes in bone geometry following menopause-associated bone loss could contribute to a significant increased risk of fractures. The incorporation of these features into fracture prediction has become the focus of current research. Furthermore, recent high-resolution peripheral quantitative computed tomography (HR-pQCT) data have shown that measurements of cortical and trabecular bone density and morphology at the distal radius and tibia may improve identification of those at highest risk for fracture.9-11 Therefore, a comprehensive evaluation of bone stiffness at a specific skeletal site would be wise to include measurements of local bone structure in addition to BMD.
Although the proximal humerus is a common site of fragile fractures, it has been relatively underexplored. Previous investigators have focused on the regional variation in trabecular microarchitecture at the proximal humerus.12-14 Although some studies have provided tentative evidence that exercise and loading may enhance overall bone dimensions by additional bone deposited on the periosteal surface,15-17 little data is available for age-related changes of morphological and material traits of the proximal humerus in postmenopausal women. The aims of this study were: (i) to determine associations of bone properties of the surgical neck with age and the correlation of bone strength with bone geometry and bone mineral density; and (ii) to explore changes in external bone size at the surgical neck level during aging in postmenopausal women. We hypothesized that bone loss and cortical thinning would result in reduced estimates of bone strength in postmenopausal women.
Methods
Participants
The goal of this study was to explore structural and material changes of the surgical neck of the humerus in the dominant arm. A total 147 postmenopausal women were eligible for enrollment and agreed to participate from December 2016 to December 2022. The inclusion criteria included: (i) independently community-dwelling women and in good general health; and (ii) women who underwent CT scanning of the shoulder for trauma to rule out tiny fractures. The exclusion criteria included: (i) history or evidence of metabolic bone disease including osteomalacia, Paget disease, or primary hyperparathyroidism; (ii) exposure to chronic treatment that interferes with bone metabolism; (iii) history of previous humeral fractures and shoulder surgeries; and (iv) history of smoking. All subjects were Han Chinese. Women were defined as postmenopausal by the absence of normal menstruation for at least 12 consecutive months. . Fourteen women were excluded because of use of bisphosphonates and eleven women were also excluded due to missing data, leaving 122 women available for the analytic sample. The participants were divided into three age groups18: the 50–59 years group; the 60–69 years group; and the older than 70 years group. Arm dominance was confirmed by the performance of throwing of a ball to the target. All women gave written informed consent. Institutional Review Board (IRB) approval was obtained from the ethics committee of Tianjin Hospital (2023-YLS-130).
Quantitative Computed Tomography
Computed tomography of bilateral shoulder was performed using a spiral CT scanner (Mx 8000 IDT; Philips Medical Systems, Best, the Netherlands). Scan parameters for CT scanner were 120 kV (peak), 168 milliampere seconds, slice thickness of 2.00 mm, a resolution of 0.566 × 0.566 mm/pixel, and a field of view of 29 × 29 cm. The range of CT scanning was from the top of acromion to inferior angle of scapula. The scan volume included a calibration phantom containing calcium hydroxyapatite standards embedded in water-equivalent resin (Mindways Software Inc., Austin, TX, USA). Volumetric bone mineral density (vBMD) was computed with the linear relationship between Hounsfield units and densities of the calcium hydroxyapatite standards within the co-scanned phantom used to determine voxel density (mg/cm3).
The character of the cortical bone was acquired from a tomographic image of 50% of the scan length distal from proximal end of humerus, and it corresponded to the surgical neck. The cross-sectional images were imported into Fiji and analyzed using theBoneJ2 plugin (National Institutes of Health, Bethesda, MD, USA).19 The measured parameters included volumetric bone mineral density (mg/cm3), average cortical thickness (CTh, mm), total area (mm2), medullary area (mm2), the periosteal perimeter and medullary perimeter (mm), the periosteal diameter, the medullary diameter (mm). Bone strength index included the minimum and maximum section modulus, polar section modulus (Zmin, Zmax and Zpol, mm3) and the minimum and maximum second moments of area (Imin and Imax, mm4).Section modulus (Z) and second moments of area (I) were estimates of bending strength, and were calculated from the external width and endocortical diameter.20
Statistical Analysis
Statistical analyses were performed using SPSS® 20.0 (SPSS Inc., Chicago, IL, USA). Normality of data distribution was detected with the Kolmogorov–Smirnov test. The analysis of covariance (ANCOVA) was used to determine the differences of bone mineral and morphological parameters between groups for normally distributed values, with the Kruskal–Wallis Test for non-normally distributed values. Age-related changes in bone dimensions, structure and strength parameters were examined by linear regression analyses. Correlation between continuous variables was performed using Pearson correlations and displayed by a HeatMap generated by Origin2021. A two-tailed p-value <0.05 was considered statistically significant.
Results
Age-related Changes in Morphology after Menopause
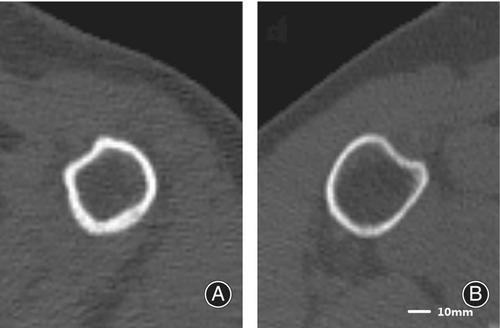
The 50–59 years group, serving as the baseline group, was comprised of 35 (28.68%) women with mean age of 57.06 years (range from 54 to 59 years). The 60–69 years group consisted of 45 (36.88%) women, with mean age of 64.76 years (range from 60 to 69 years).The older than 70 years group included 42 (34.43%) women, with average age of 75.17 years (range from 70 to 86 years). When compared to the 50–59 year group as a baseline, postmenopausal women aged over 70 years were characterized by a significantly lower cortical thickness (13.9%) and vBMD (6.65%), as well as reduced skeletal strength indices including the minimum and maximum section modulus (Zmin 18.11%, Zmax 21.71%), polar section modulus (Zpol 20.21%), and the minimum and maximum second moments of area (Imax 21.01%, Imin 21.43%). In 60–69 years group, there was a decrease in cortical bone thickness (14.49%), while Imax, Zmax and Zpol decreased by 17.21%, 14.69% and 14.77%, respectively. This suggested that there was an overall reduction in bone mechanical strength at the surgical neck level over the age of 70. Meanwhile, the difference in periosteal diameter and perimeter, total area in three groups did not reach statistical significance. Similar finding were seen in medullary cavity parameters (all ps > 0.05, Figure 1, Table 1).

| Variable | The 50–59 years group (n = 35) | The 60–69 years group (n = 45) | The older than 70 years group (n = 42) | p value |
|---|---|---|---|---|
| Age (years) | 57.06 ± 1.56 | 64.75 ± 2.84* | 75.17 ± 4.64** | 0.00 |
| BMD (mg/cm3) | 148.88 ± 12.537 | 148.79 ± 13.89 | 138.98 ± 15.91** | 0.00 |
| Cortical thickness (mm) | 3.45 ± 0.69 | 2.95 ± 0.64* | 2.97 ± 0.80** | 0.00 |
| Periosteal diameter (mm) | 42.53 ± 3.19 | 42.27 ± 2.61 | 41.50 ± 2.86 | 0.26 |
| Periosteal perimeter (mm) | 120.13 ± 8.96 | 119.38 ± 7.38 | 117.20 ± 8.16 | 0.26 |
| Total area (mm2) | 904.51 ± 134.90 | 891.34 ± 110.75 | 859.94 ± 122.11 | 0.25 |
| Medullary diameter (mm) | 28.46 ± 2.91 | 28.94 ± 3.12 | 27.86 ± 2.28 | 0.20 |
| Medullary perimeter (mm) | 80.28 ± 8.23 | 81.39 ± 8.82 | 78.38 ± 6.46 | 0.20 |
| Medullary area (mm2) | 404.80 ± 84.87 | 414.04 ± 88.72 | 382.30 ± 65.59 | 0.17 |
| Imin (mm4) | 23858.78 ± 9476.34 | 20135.00 ± 8871.37 | 18845.86 ± 6685.18** | 0.03 |
| Imax (mm4) | 18047.94 ± 7498.42 | 14941.21 ± 6981.31* | 13818.48 ± 5058.68** | 0.02 |
| Zmin (mm3) | 1454.87 ± 514.03 | 1261.96 ± 510.66 | 1191.33 ± 391.06** | 0.04 |
| Zmax (mm3) | 1234.76 ± 471.25 | 1053.31 ± 445.55* | 966.74 ± 335.96** | 0.02 |
| Zpol (mm3) | 2448.68 ± 799.10 | 2087.05 ± 723.41* | 1953.87 ± 631.10** | 0.01 |
- Abbreviations: BMD, bone mineral density; Imin, the minimum second moments of area; Imax, The maximum second moments of area; Zmax, The maximum section modulus; Zmin, The minimum section modulus; Zpol, Polar section modulus.
- * p < 0.05 for difference between group A and group B.
- ** p < 0.05 for difference between group A and group C.
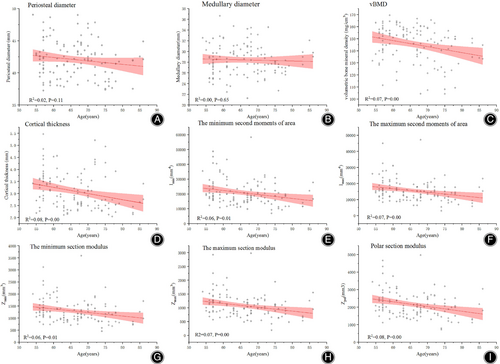
When pooled across all decades, no associations were found between the periosteal and medullary parameters and age (p > 0.05), suggesting that there were no notable changes in bone size of the surgical neck with increase in age. Both cortical thickness and vBMD value were inversely associated with age, showing 10.56% and 23.92% decline between age of 54 and 86 years (all ps < 0.01). In terms of mechanical parameters, the largest age-related difference was found in Imax, which showed nearly 40% difference between age of 54 and 86 years, followed by Zmax (−35.77%), Imin (−35.73%), Zpol (−34.90%) and Imin (−23.92%) (all ps < 0.01, Figure 2, Table 2).This indicated that as age advanced, varying degrees of fall in estimated strength of the proximal humerus were identified due to the lack of periosteal expansion and decline in cortical thickness and vBMD.

| Variable | Mean ± SD | Predicted change between 54 and 86 years old | Age correla | |
|---|---|---|---|---|
| Period <6 years after menopause | Absolute change | Percentage change | ||
| BMD (mg/cm3) | 146.62 ± 13.15 | −15.99** | −10.56** | −0.27* |
| Cortical thickness (mm) | 3.48 ± 0.79 | −0.82** | −23.92** | −0.28* |
Imin (mm4) |
23797.23 ± 9325.08 | −8580.01* | −35.73* | −0.25* |
Imax (mm4) |
18325.27 ± 8044.20 | −7085.07** | −39.08** | −0.26* |
Zmin (mm3) |
1479.65 ± 540.265 | −471.14* | −32.01* | −0.24* |
Zmax (mm3) |
1264.12 ± 504.52 | −445.11** | −35.77** | −0.26* |
| Zpol (mm3) | 2493.13 ± 842.53 | −862.70** | −34.90** | −0.29* |
- Abbreviations: BMD, bone mineral density; Imin, the minimum second moments of area; Imax, The maximum second moments of area; Zmax, The maximum section modulus; Zmin, The minimum section modulus; Zpol, Polar section modulus.
- ** p < 0.005,
- * p < 0.01.
- a Pearson correlation coefficient.
Association of Bone Strength with Skeletal Structure and Bone Mass
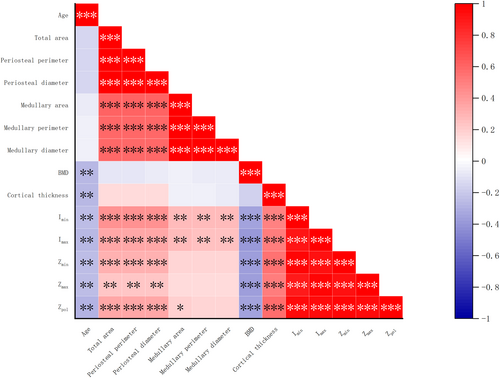
Periosteal diameter was moderately correlated with medullary diameter, area and perimeter (r = 0.59–0.61, p < 0.01). vBMD and cortical thickness had no significant correlation with periosteal diameter (p > 0.05). The periosteal diameter had association with Zmin, Zmax, Zpol, Imin and Imax (r = 0.23–0.44, p < 0.01), which is similar to results of vBMD (r = −0.37–0.39, p < 0.01). Whereas skeletal strength variables showed an even more pronounced dependence on cortical thickness (r = 0.5–0.58, p < 0.01), suggesting that the latter may be a more reliable indicator of changes in mechanical strength (Figure 3). Similar correlation results were found in total area and perimeter analysis.

Discussion
Analysis of acquired shoulder CT images in this study indicated that the major bone loss reflected in reduced vBMD and cortical thickness was seen in postmenopausal women aged over 70 years. Moreover, in this age group the estimated bone strength also showed a significant decrease. However, the external bone size at surgical neck did not change significantly with aging after menopause. The absence of periosteal expansion and rapid cortical loss accounts for the marked age-related decline in moment of inertia and structural resistance to bending. In addition, our study confirmed the positive correlation between endocortical and periosteal dimension at surgical neck. The mechanical strength parameters had stronger association with cortical thickness than with bone size or bone density.
Age-related Changes of Bone Traits at the Surgical Neck
A postmenopausal increase in bone loss accompanying decline of estrogen, and resulting in reduced bone strength, has been well documented.21-23 In this study, we found that vBMD and cortical thickness, which is an indication of bone loss in the humerus, sustained a marked decline after menopause. Moreover, such bone loss was more pronounced in the age group over 70 years. Our results correspond well to the data from radius and femur.24 We supported the notion that bone loss at peripheral sites was not limited to the first 15 years after menopause and did not lessen significantly in late postmenopause.24 In the meantime, cortical bone is the main determinant of the strength of the appendicular skeleton, and a reduction in thickness has been proved to have substantial impact on bone strength.5, 9 Our analysis also proved that the positive correlation between mechanical strength index and cortical thickness.
Theoretically, the factors that determine bone strength include the bone size and microstructure, in addition to its material properties. There is a general consensus that periosteal apposition is a remedial reaction to bone loss by gain in bone diameter. Our data confirmed that periosteal diameter was moderately correlated with medullary diameter, which was in agreement with previous reports that periosteal apposition is linked to postmenopausal bone loss.6, 7 However, we were incapable of confirming this concept experimentally in the present study. Our results suggested that periosteal apposition rate stayed steady with age. This observation is analogous with earlier quantitative CT analysis in which postmenopausal women had maintained femoral head and neck bone volume above the age of 50 years.18 The age-induced drops in the population and cytokinesis of osteoblasts and fibroblasts, together with the reduced vessels density in the periosteum, partially provide an explanation as to why bone formation in the periosteum diminishes with age.25 In addition, the humerus is the site of least periosteal apposition throughout the skeleton.25 In particular, we found that bone mechanical strength indexes continuously fall with increasing age after menopause. Especially in the age group over 70 years, there was an overall decrease in estimated strength indexes. These findings have reconciled the epidemiology and pathogenesis of surgical neck fractures; most of these fractures occur predominantly after the age of 65 years.4, 26, 27 Therefore, the increase in bone fragility at the surgical neck was supposed to be mainly attributed to the accelerated endocortical resorption and the absence of periosteal expansion.
The Correlation of Bone Strength and Bone Properties at the Surgical Neck
BMD which is measured with dual-energy X-ray absorptiometry (DXA) or quantitative computed tomography (QCT), has been shown to strongly predict fracture risk. However, the common locations for quantitative BMD analysis are the hip and lumbar spine. It has previously been shown that local bone status of the proximal humerus correlated weakly with any changes in BMD of the axial skeleton.28 Moreover, conventional bone densitometry did not allow prediction of the fracture type of proximal humeral fractures.29, 30 In consideration of the above facts, we use quantitative CT to assess the bone quality of the proximal humerus directly. The advantage of this three-dimensional technique over conventional dual-energy X-ray absorptiometry (DXA) is that it provides volumetric BMD and geometric parameters, as independent elements of fracture risk.6, 7 Furthermore, QCT can examine cortical and trabecular bone independently. Our findings showed that a moderate correlation (r = −0.35–0.39) between the local vBMD at the surgical neck and strength indices. And the BMD of surgical neck was negatively associated with age, suggesting that it might be a barometer of changes in bone mass at the shoulder. Furthermore, we found additional useful predictors of mechanical properties, including cortical thickness, total area, the periosteal perimeter and diameter, independently of surgical neck vBMD. Among them, cortical thickness had a higher correlation with strength indices than bone mineral density, or bone size. Consistent with prior work,11, 30 our study confirmed that cortical thickness was reliable to predict the ultimate fracture load.
Strengths and Limitations
The primary strength of this analysis lies in its focus on age-related bone quality in the surgical neck. It is well established that proximal humerus fractures in adults usually occur at an earlier age than hip or spine fractures,32 offering a unique opportunity to initiate treatment of structural and metabolic bone abnormalities. Therefore, we chose postmenopausal women as the study population. Our data demonstrated an age-related decline in estimated bone strength with age. Furthermore, this is the first time that changes in outer bone size had been found to be subtle in the surgical neck. This was critical in the setting of osteoporosis and fracture risk.
Our study has several limitations. First, design of this study limits the capacity of observation associated with age effects. We inferred bone loss from comparisons across age groups. The patterns of age-related change identified in our study need to be tested in longitudinal studies. Second, the cohort was all Han Chinese; therefore we were unable to assess potential racial/ethnic differences. Finally, microarchitectural changes of cortical bone at surgical neck could not be analyzed in the study. Biomechanical deficiencies arising from the cortical porosity had been demonstrated to increase substantially with age.4, 8, 9 Despite these limitations, we still found the absence of periosteal apposition was an essential determinant of bone fragility after menopause.
Prospect of Clinical Application
We found that bone loss at the surgical neck was not limited to early menopause, but was not substantially attenuated in the seventh decade. Therefore, it is suggested that the focus of osteoporosis prevention should be on the entire menopausal period rather than early menopause.24, 33 Meanwhile, quantitative bone mineral density of the humerus is difficult to determine, although the proximal humerus is a common site for fragile fractures.31, 34 In our study, cortical thickness had found to have a higher correlation coefficient with the strength index, although bone mineral density or total area, and periosteal perimeter and diameter were independently correlated with the bone strength index. Therefore, direct measurement of cortical thickness at the level of the surgical neck is a wise option to assess local bone status.
Conclusion
In summary, we observed that aging is associated with a considerable decline in bone mineral density, structure and estimated mechanical strength of the proximal humerus in postmenopausal women. The predominant vBMD loss and a concomitant reduced cortical thickness were found above the age of 70 years. The bone dimension of the surgical neck remained constant above the age of 50 years. Reduction of estimated bone strength following menopause resulted from endosteal bone loss and lack of periosteal apposition. The bone strength appeared to rely more on cortical thickness than bone size or bone density. These observations may also contribute to the understanding of the mechanisms regulating local bone loss in the proximal humerus in the elderly.
Acknowledgments
This study was supported by Tianjin National Science Foundation of China (18JCYBJC95200).
Author Contributions
All authors had full access to the data in the study and take responsibility for the integrity of the data and the accuracy of the data analysis. Conceptualization, Yeming Wang; methodology, Yeming Wang and Yutao Men; investigation, Yeming Wang, Yutao Men and Jian Li; formal analysis Yeming Wang and Yutao Men; resources, Jian Li and Wanfu Wei; writing—original draft, Yeming Wang and Yutao Men; writing—review and editing, Yeming Wang and Wanfu Wei; visualization, Jian Li; supervision, Wanfu Wei; funding acquisition, Yutao Men.
Open Research
Data Availability Statement
The data generated and analyzed during this study are set out in the tables provided in this article. Any further information on the data can be acquired from the corresponding author.


