Coastal mesozooplankton respond to decadal environmental changes via community restructuring
Abstract
Long-term ecological research has revealed the impact of climate on marine ecosystems at multiple time scales. Changes in the pelagic system have been detected at the LTER-MC site in the Gulf of Naples (Tyrrhenian Sea, western Mediterranean) since 1984. Here we analyzed the time series to determine whether zooplankton had significantly changed over the three decades 1984–2015. In addition to the seasonal cycle as the main mode of temporal variability, we observed long-term trends in the functional groups and species. Copepods, the most abundant group, declined over the years owing to a decrease in the abundance of Acartia clausi, Centropages typicus, the Paracalanus parvus complex, and Oithona spp. Increasing trends were observed for strict carnivores (chaetognaths) and typical filter feeders (cladocerans, appendicularians, and thaliaceans); the latter may be linked to a higher density of <5 μm phytoplankton. Two main temporal shifts were detected: (i) in 1985–87, similarly to the regime shifts registered in other basins of the Northern Hemisphere, and (ii) after 2011, likely related to local atmospheric forcing. The disappearance or decrease in some neritic copepods and the increased abundance of typical offshore species seem to reflect the enhanced influence of the open Tyrrhenian waters at the sampling site. Despite these changes, no significant trends were detected in the total zooplankton abundance and overall composition, which indicates restructuring within the whole community. These results underline the need to examine the entire zooplankton diversity spectrum and improve our knowledge of their ecological traits to detect and interpret long-term variability.
1 INTRODUCTION
Climate change and anthropogenic activities impact the Earth's systems in many different ways, and studies on this topic are uncountable (McKay et al., 2022). In the Mediterranean Sea, where climate is determined by the complex interplay of atmospheric processes originating from different continents and regions (Lionello et al., 2008; Ruti et al., 2016), significant increases in temperature and the frequency of extreme meteorological events have been widely reported (Lionello et al., 2012, 2022). In this basin, climate-related changes in marine biota have so far been highlighted mainly in benthos and nekton. Examples include an increase in thermophilic echinoderms (Francour et al., 1994); a decrease in hydroid diversity and arrival of species with southern affinity (Puce et al., 2009); a decline in size, lifespan, and morphological complexity in coralligenous assemblages (Gómez-Gras et al., 2021); mass mortality in numerous benthic species (Garrabou et al., 2022 and references therein); and changes in fish abundance and distribution according to species thermal affinities (Azzurro et al., 2019; Givan et al., 2018). Less information is available on long-term changes in Mediterranean zooplankton communities (e.g., Berline et al., 2012; García-Comas et al., 2011), despite their important role as primary and secondary consumers in biogeochemical cycles and carbon flux at sea (Steinberg & Landry, 2017). In addition, because of their short life cycles and tight coupling with environmental conditions, zooplankton can be effective sentinels of climate change (Hays et al., 2005).
Zooplankton distribution has revealed some important variations in relation to climate at the decadal scale. For instance, significant changes in calanoid copepod diversity (Beaugrand, 2003) and the increasing occurrence of blooming jellyfish (Licandro et al., 2010) observed in the northeastern Atlantic have been linked to an increasing trend in sea surface temperature. In the North Sea, the zooplankton standing stock has decreased owing to the decrease in Calanus finmarchicus population, with consequences for fish recruitment (Nicolas et al., 2014), whereas the increase in meroplanktonic larvae (echinoderms and decapods) has remarkably affected the benthic–pelagic coupling (Kirby et al., 2008; Kirby & Lindley, 2005). There is evidence of the appearance of zooplankton species in the North Sea (Greve et al., 2004; Johns et al., 2005) and changes in species and group abundance in the English Channel (Eloire et al., 2010). In Mediterranean zooplankton, long-term changes have been detected in the total and relative abundance of the main functional groups and species in the Ligurian Sea (Licandro et al., 2012; Molinero et al., 2008) as well as in the occurrence of various species in the northern (Bernardi Aubry et al., 2012) and southern (Batistić et al., 2014) sectors of the Adriatic Sea.
In the Tyrrhenian Sea, which is the most oligotrophic region of the western Mediterranean (D'Ortenzio & Ribera d'Alcalà, 2009), the Gulf of Naples is a large densely populated embayment. In the late 19th century, the foundation of Stazione Zoologica Anton Dohrn fostered pioneering research on zooplankton diversity (e.g., Giesbrecht, 1892), followed by sparse studies in the next century (e.g., Hure & Scotto di Carlo, 1968), until a regular monitoring program was established at a coastal site in 1984 (Scotto di Carlo et al., 1985). Since then, zooplankton investigations have highlighted recurrent seasonal patterns and regular species succession in key groups, including calanoid and cyclopoid copepods (Di Capua & Mazzocchi, 2004; Mazzocchi et al., 2012; Mazzocchi & Ribera d'Alcalà, 1995) and species associations (Mazzocchi et al., 2011). Phenological changes have been recorded in two species that dominate copepod abundance in spring-early summer, Acartia clausi and Centropages typicus, which have shortened their cycle in response to increasing temperature (Mackas et al., 2012). However, a general and detailed study of the decadal zooplankton variability in the Gulf of Naples is lacking.
In the present study, we analyzed the first three decades (1984–2015) of the ongoing zooplankton time series in the Gulf. The scope of our study was to assess whether zooplankton communities changed significantly during this period, particularly in response to increasing temperature trends and relevant changes recorded in the winter temperature and wind regime after 2010, concurrent with the shallowing of the mixed layer depth and enhancement of exchanges with open Tyrrhenian waters (Kokoszka et al., 2023). Our main hypothesis was that three decades were appropriate to detect significant changes in the community structure in the Gulf, considering the large-scale changes in meteorological forcing observed in the Northern Hemisphere over that interval, and taking into account the environmental variations recorded at our site. Given the latitudinal characteristics and smaller spatial scale of our study area in comparison with the northern European seas, we expected changes in zooplankton abundance, diversity, and structure to be more limited than those observed elsewhere. Therefore, we focused on identifying (i) the main modes of temporal variability in zooplankton abundance, group composition, and copepod diversity; (ii) the local environmental forces possibly driving the observed patterns and trends; and (iii) the occurrence of any significant discontinuity in zooplankton and their environment, which might indicate a temporal shift in the planktonic system.
2 MATERIALS AND METHODS
2.1 Study site
The Gulf of Naples is a heterogeneous environment in which complex hydrodynamics link eutrophic coastal areas affected by intense anthropogenic activities with outer areas occupied by oligotrophic waters (Cianelli et al., 2012 and references therein). The time series of plankton research MareChiara was established in January 1984 at a fixed site two nautical miles in front of the city of Naples (40°48.50 N, 14°15.0 E) at the border between the coastal area and offshore Tyrrhenian waters (Ribera d'Alcalà et al., 2004). Since 2006, the site has become part of the Italian (www.lteritalia.it), European (www.lter-europe.net), and international (www.ilter.network) networks of Long-Term Ecological Research (LTER), and has been named LTER-MC ever since (Zingone et al., 2019). The sampling frequency, which was biweekly until 1990, has been weekly since 1995. A major interruption occurred from January 1991 to February 1995, and other samplings were sparsely missed over the years owing to weather or technical problems.
2.2 Sampling and sample treatment
In this study, we focused on the mesozooplankton composition and abundance during the first 28 years of the time series (January 1984–December 2015). Samples were collected by vertical tows in the upper 50 m using an Indian Ocean net (200 μm mesh, 113 cm mouth diameter) and fixed with buffered formaldehyde (2%–4% final concentration).
In the laboratory, the samples were concentrated and resuspended in filtered seawater to a volume of 200 mL to remove the formaldehyde. Aliquots ranging from 1/4 to 1/32, according to the sample density, were initially taken using the Huntsman beaker subsampling technique (Van Guelpen et al., 1982) and successively with a large-bore graduated pipette after careful mixing. Aliquots were transferred to a mini-Bogorov chamber (10 mL) and examined under a stereomicroscope and all zooplankton taxa were identified and counted. The entire sample was checked for the presence of rare species. The average number of individuals counted in each sample was 2537 ± 2006. For all copepods, adult females and males were identified at the species level, with the exception of Calocalanus, Oithona, and Oncaeidae males, which were identified at the genus and family levels. Copepodites (CII-CV according to species were efficiently retained by 200 μm mesh) were identified at the species level in most cases or grouped at the genus or family level (e.g., Calocalanus, Oithona, Oncaeidae, and Corycaeidae). Juveniles of Clausocalanus spp. and the Paracalanus parvus complex, pooled until 1990, were separated after an increase in taxonomic expertise on these challenging developmental stages. The copepod abundances reported here correspond to the whole population (adult females and males, and copepodites), unless otherwise indicated. Among the other zooplankton species, some groups were identified at the species level during most years of the series (e.g., cladocerans, chaetognaths, and siphonophores), whereas others were identified at higher taxonomic levels. Homogeneity in the counting methods and the accuracy of taxonomic identification were ensured by intercalibration between the two analysts (MGM and IDC).
Temperature, salinity, depth of the mixed layer, chlorophyll a (Chl a), and four phytoplankton size classes were analyzed as environmental factors potentially affecting the temporal variability of zooplankton. Temperature was measured by reversing thermometers from 1984 to 1995. In the period 1995–2001, different multiparametric profilers and reversing thermometers were used, and a multiparametric profiler (Sea-Bird Electronics, 9–11 plus V2) was subsequently utilized. Salinity was determined using a salinometer from 1984 to 2001 and then a multiparametric profiler. Chlorophyll a concentration was determined at seven selected depths using a spectrophotometer until 1990, and a spectrofluorometer since 1995. Further details on the sampling, analytical procedures, instrumentation, and quality control procedures are reported in Sabia et al. (2019). The mixed layer depth (MLD), which identifies the vertical extension of the homogeneous surface layer, was calculated from in situ density profiles following the method of de Boyer Montégut et al. (2004). Further methodological details related to MLD are reported in Kokoszka et al. (2023).
Phytoplankton samples were collected at 0.5 m depth with a Niskin bottle and fixed with neutralized formaldehyde (0.8–1.6% final concentration). In the laboratory, cell count and identification were performed using an inverted microscope. Further details on the sampling and analytical procedures are reported in Ribera d'Alcalà et al. (2004).
2.3 Data analysis
2.3.1 Zooplankton time series
- richness (S), that is, the number of copepod species/taxa recorded in a sample;
- Shannon–Wiener diversity (H′ = −∑j spjlog(pj)), where pj is the proportion of the j-th species in the sample, to determine the abundance distribution among the various species/taxa;
- Pielou evenness (J = H′/log(S)), where H′ is the Shannon–Wiener diversity and S is the richness, to assess the extent to which the abundances are equally distributed among species/taxa.
2.3.2 Time series of environmental variables
To investigate the relationship between zooplankton and environmental variability, the time series of the following abiotic and biotic variables were considered (https://doi.org/10.5281/zenodo.7764671; https://doi.org/10.5281/zenodo.7764735): (i) Sea surface (0–2 m) temperature (SST, °C); (ii) sea surface salinity (SSS); (iii) mixed layer depth (MLD, m); (iv) total chlorophyll a concentration at surface (Chl a, mg m−3); and (v) abundance (cells mL−1) of four phytoplankton size classes (<5 μm, 5–15 μm, 15–30 μm, and >30 μm equivalent spherical diameter, ESD), selected to cover different size categories of potential zooplankton prey. Larger phytoplankton cells were pooled within the category of cells >30 μm because they were rare (cells 50–92 μm ESD were only found in 5.6% of samples) and not effectively enumerated using our counting method. The temperature, salinity, and Chl a values integrated over the 0–70 m water column were not considered, because they were highly correlated with surface values. While phytoplankton and zooplankton data were compared over the entire period, comparisons between zooplankton and SST, SSS, Chl a, and MLD were limited to the periods 1984–1990 and 1997–2015 because of the numerous missing records between 1995 and 1996.
2.3.3 Zooplankton long-term variability
The main patterns of temporal variability observed over the decades were extracted from the time series of the total zooplankton and main mesozooplankton groups using the eigen-vector filtering (EVF) method (Figure S1) adapted to time series with missing values (Ibanez & Conversi, 2002). EVF analysis was also applied to the S, H′, and J time series to investigate the long-term changes in copepod diversity. The main gap (January 1991–February 1995) was eliminated before the analysis and inserted again into the figures showing the filter variables.
The EVF consists of a PCA calculated on an autocovariance matrix based on the original time series Xt lagged by itself from 1 to n time units (here fortnights), choosing n according to the autocorrelation function of Xt. The EVF method extracts the “trends,” that is, the tendencies of any shape (e.g., interannual and annual trends) that are associated with the main variance of a series, identified in decreasing order of importance by the filtered variables F1, F2, F3…FN. The EVF method has the main advantage that no observations are lost at the boundary of the series and no arbitrary choice on the shape of the trend is operated a priori, as is the case with other methodologies (e.g., linear regression). Therefore, the EVF has been widely used in marine ecology to investigate the long-term variability of benthic and plankton communities (e.g., Ibanez & Dauvin, 1988; Ibanez, 1991: Souprayen et al., 1991; Licandro et al., 2001; Licandro et al., 2012). Ibanez and Etienne (1992) demonstrated that EVF corresponds to a weighted moving average with 2(n − 1) + 1 terms, with the weights of the moving averages allowing for the computation of the gain function that assesses the frequency bands that have been eliminated. Therefore, considering the strong seasonality characterizing zooplankton, n = 12 (which provides a weighted moving average of 23 successive observations) was chosen to filter out the annual signal from the data. When a long-term trend is present in the time series, it is generally identified by the first filtered variable (F1), whereas the second filtered variable (F2) corresponds to the seasonal cycle.
Following previous studies (Ibanez, 1991; Ibanez et al., 1993; Licandro et al., 2001; Souprayen et al., 1991), we analyzed F1 and F2 to characterize the main modes of temporal variability in the abundance of taxonomic groups and copepod species and in copepod diversity indices, called zooplankton descriptors hereinafter. Using harmonic analysis, we identified the most significant periodicities within F1 and F2 for each zooplankton descriptor (p < .05). Then, considering the correlation between F1 and F2 and the results of the harmonic analysis, we distinguished zooplankton descriptors characterized by significant long-term variability (∞ harmonic significant in F1, low correlation between F1 and F2) from those dominated by seasonal variability (24-month harmonic associated with the highest variance, ∞ harmonic not significant in F1, high correlation between F1 and F2). Long-term variability was also tested by applying linear regression to F1. Associated p-values were obtained from Student's t-tests with the number of degrees of freedom corrected for autocorrelation, according to Pyper and Peterman (1998).
Annual normalized anomalies (Ai) based on the complete series of zooplankton data were calculated to provide a complementary picture of the long-term variability of abundance for the comparison of interannual patterns. The annual means for the 28 years of the series were calculated, the average of these annual means () was subtracted from each of them, and the differences obtained (anomalies) were normalized by the standard deviation of the annual means .
2.3.4 Relationships between zooplankton and environmental factors
To understand the possible influence of environmental conditions on long-term zooplankton patterns, cross-correlations based on Spearman rank correlation coefficients were calculated between the F1s of zooplankton groups/taxa that showed significant interannual variability and the F1s of environmental variables, correcting the number of degrees of freedom for temporal autocorrelation according to Pyper and Peterman (1998). Abiotic and biotic variables (SST, SSS, MLD, Chl a) and phytoplankton size classes (<5 μm, 5–15 μm 15–30 μm, >30 μm) were treated separately because of the different numbers of observations available (N = 624 and N = 672, respectively). Considering that most copepods do not feed efficiently on cells <5 μm (Broglio et al., 2004; Hansen et al., 1994), this size fraction was not considered for the correlations between copepods and phytoplankton size classes. The correlation with phytoplankton was not calculated for chaetognaths, because they are carnivorous. Spearman's coefficient r was considered highly significant at p < .001.
2.3.5 Shift analysis
To identify major temporal discontinuities in the abundance of main zooplankton groups, we used the multivariate method of Hawkins and Merriam (1973, 1974) as applied by Ibanez (1984), from now onwards “shift analysis,” which separates the zooplankton time series into k distinct segments, that is, periods characterized by similar zooplankton communities. The methodology is based on the principle that, given a time series composed of m = 1,2…N observations divided into j = 1, 2…k segments, a measure of the homogeneity within each ki segment consisting of i, i + 1, i + 2…j observations is r(i,j) = sum of the square deviations of the j observations around their mean. If segment ki is homogeneous, r(i,j) is low. Through a stepwise procedure, considering all possible combinations, the time series was divided into a number of segments from k = 1 to N, starting from k1 segment covering the points between nk−1 and N (minimum N = 2), which gives the minimum within-segment sums of squared deviations. For each iteration, the variance associated with the selected segmentation was calculated, and the stepwise procedure was stopped when the gain in variance explained by a new iteration was relatively low (i.e., <10%). For a better understanding of zooplankton seasonal dynamics, shift analysis was applied separately for each astronomic season to annual normalized anomalies of six zooplankton groups × 28 years. The seasons were winter (December 21–March 20), spring (March 21–June 20), summer (June 21– September 21), and autumn (September 22–December 20). Shift analysis was also applied to the phytoplankton community (4 phytoplankton size classes × 28 years) and environmental variables (4 variables × 26 years) to verify whether shifts in the zooplankton community at LTER-MC coincided with significant habitat changes.
3 RESULTS
3.1 Seasonal and long-term patterns
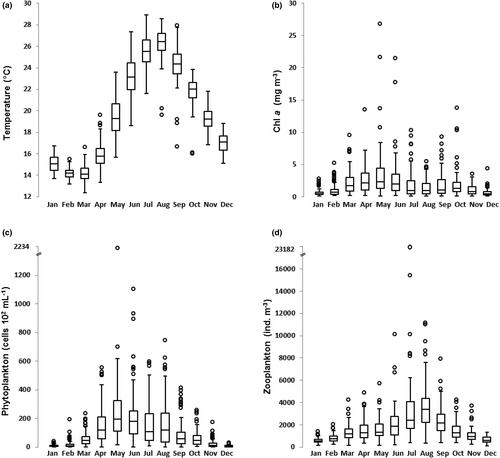
SST was lowest (median 13.7°C) in March and highest (median 26.4°C) in August (Figure 1a). Chl a had a main peak (median 2.3 mg m−3) in May and a lower peak in September–October (Figure 1b). Phytoplankton concentrations were lowest in December–January and highest in May–June (median around 20 × 104 cells mL−1), with secondary peaks in July–August (Figure 1c). The average monthly pattern of zooplankton abundance showed a minimum in January (573 ± 234 ind. m−3) and an increase from March to August, when the annual peak was recorded (3668 ± 2103 ind. m−3), followed by a gradual decrease until December (Figure 1d). Year-to-year variability in seasonal abundance was pronounced in spring–summer and low in winter.
The zooplankton communities were highly diversified, with 219 taxa identified at different taxonomic levels (Table S1). Copepods accounted for the highest relative contribution to total abundance in each sample (64.7 ± 23.7%) followed by cladocerans (15.2 ± 24.1%) and pelagic tunicates (13.6 ± 12.2%), which were mainly represented by appendicularians (Oikopleura spp. and Fritillaria spp.) and thaliaceans (mainly doliolids). Among the other numerous groups that regularly contributed to zooplankton assemblages, albeit with much lower abundances, it is worth mentioning meroplankton (4.9 ± 5.7%, mainly cirriped, bivalve and gastropod larvae), and chaetognaths (0.9 ± 1.1%). The two most abundant groups clearly shaped the average seasonal pattern of total zooplankton with their peaks marking different periods of the year, that is, copepods from April to June and cladocerans in July and August (Figure S2A). A seasonal signature was also observed in common but less abundant groups, such as appendicularians (peaks in March and late summer-autumn), thaliaceans (October), chaetognaths (autumn), and meroplankton larvae (late winter–early summer) (Figure S2B).
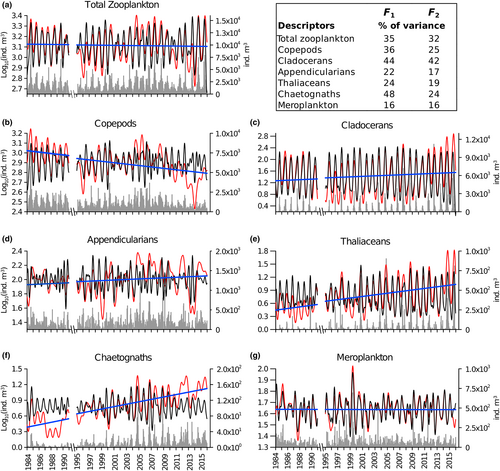
The seasonal cycle represented the main mode of variability of total zooplankton, as indicated by the harmonic of 24 fortnights, associated with the highest variance in both F1 and F2, and by the high correlation between F1 and F2 (Table 1). No significant long-term trend, but rather significant oscillations of 14 years and of 3, 6, and 9 years, were revealed in the total zooplankton F1 and F2 (Table 1, Figure 2a). In contrast, significant trends (the presence of the ∞ harmonic) characterized most taxonomic groups (Table 1, Figure 2b–g). Copepod abundances decreased significantly over time; in particular, their increase from 2004 to 2007 was followed by a sharp decline between 2008 and 2014 (Figure 2b). Cladocerans were mainly characterized by seasonal variability but showed a significant interannual trend driven by the increased abundance since 2011 (Figure 2c). A significant positive trend was observed in appendicularians, thaliaceans, and chaetognaths, mainly because of their increased abundance over the last decade (Figure 2d–f). Meroplankton larvae did not exhibit any significant trend (Figure 2g).
| Descriptors | F 1 | F 2 | r | Regression equation (F1) | |||||
|---|---|---|---|---|---|---|---|---|---|
| Significant harmonics (fortnights) | Harmonic-associated variance (%) | Significant harmonics (fortnights) | Harmonic-associated variance (%) | F1 F2 | Slope | Intercept | R 2 | p-value | |
| Total zooplankton | 24, 336, 84, 134, 224 | 58, 13, 4, 4, 3 | 24, 12 | 74, 5 | 0.8 | −1.60E-05 | 3.1210 | 0.00 | n.s. |
| Copepods | 336, 24, 134, 224, 84, ∞ | 33, 23, 9, 8, 5, 4 | 24, 12, 22, 11, 18 | 52, 9, 3, 3, 3 | 0.5 | −0.0003 | 3.0163 | 0.22 | * |
| Cladocerans | 24, ∞ | 76, 8 | 24, 12 | 86, 4 | 0.9 | 0.0005 | 1.2401 | 0.03 | ** |
| Appendicularians | ∞, 56, 336, 61, 24, 75, 40, 84, 67, 42, 23 | 13, 12, 10, 9, 8, 6, 6, 5, 4, 4, 3 | 12, 24, 23, 22, 17, 19, 13, 14, 13 | 18, 145, 8, 4, 4, 3, 3, 3, 3 | 0.4 | 0.0002 | 1.9242 | 0.04 | *** |
| Thaliaceans | 24, ∞, 224, 84, 336, 25 | 45, 12, 8, 5, 3, 3 | 24, 12, 25 | 66, 9, 4 | 0.7 | 0.0009 | 0.4563 | 0.25 | *** |
| Chaetognaths | ∞, 24, 336, 224, 61, 84 | 39, 16, 14, 8, 4, 4 | 24, 12, 23, 25, 19 | 55, 4, 4, 3, 3 | 0.4 | 0.0011 | 0.4019 | 0.58 | *** |
| Meroplankton | 24, 25, 23, 48, 134 | 30, 10, 6, 5, 4 | 24, 25, 23, 17, 22, 20, 11 | 31, 11, 8, 6, 3, 3, 3 | 0.9 | −1.17E-05 | 1.6407 | 0.00 | n.s. |
| Copepod richness (S) | ∞, 112, 96, 224, 336, 24, 134, 84 | 24, 17, 13, 11, 7, 7, 3, 3 | 24, 12, 22, 25, 19, 22 | 46, 5, 5, 5, 5, 3 | 0.4 | −0.014 | 36.0380 | 0.44 | *** |
| Copepod diversity (Shannon, H′) | 24, 336, 96 | 63, 12, 4 | 24 | 81 | 0.8 | 6.52E-05 | 2.0425 | 0.00 | n.s. |
| Copepod evenness (Pielou, J) | 24, 336 | 51, 16 | 24 | 57 | 0.8 | 8.83E-05 | 0.5710 | 0.08 | n.s. |
| Acartia clausi | 24, 336, ∞, 134, 224 | 52, 10, 8, 7, 3 | 24 | 81 | 0.8 | −0.0011 | 1.8290 | 0.25 | *** |
| Centropages typicus | 24, 336, ∞, 134, 96 | 53, 10, 10, 8, 3 | 24, 12 | 79, 3 | 0.8 | −0.0009 | 1.6232 | 0.19 | *** |
| Paracalanus parvus complex | 24, ∞, 336, 112, 224, 96, 134 | 30, 15, 14, 9, 8, 4, 3 | 24 | 68 | 0.7 | −0.0003 | 2.1850 | 0.03 | ** |
| Temora stylifera | 24, 224, 61, 336, 134, 84 | 60, 6, 4, 4, 3, 3 | 24, 12 | 73, 9 | 0.8 | 0.0005 | 1.0084 | 0.08 | *** |
| Clausocalanus spp. | ∞, 224, 24, 25, 52, 134, 168, 96, 336 | 33, 14, 7, 5, 4, 3, 3, 3, 3 | 12, 24, 11, 25, 23, 12, 13 | 23, 12, 6, 6, 5, 5, 4 | 0.3 | 0.0001 | 1.9163 | 0.02 | ** |
| Oithona spp. | 224, 336, 84, 168, ∞, 45, 112, 35, 134, 28, 22 | 14, 11, 10, 10, 6, 6, 5, 4, 3, 3, 3 | 12, 22, 21, 17, 13, 16 | 47, 6, 6, 5, 4, 3 | 0.3 | −0.0001 | 1.8878 | 0.03 | ** |
- Note: ∞ represents the variability associated with the general long-term trend of the series. Periodicities having maximum variance are in bold. Spearman correlations (r) between F1 and F2, and linear regression equations describing the variability of F1 against time are also reported. n.i.: not significant.
- *** p < .001.
- ** p < .01.
- * p < .05.
3.2 Copepod diversity and temporal dynamics
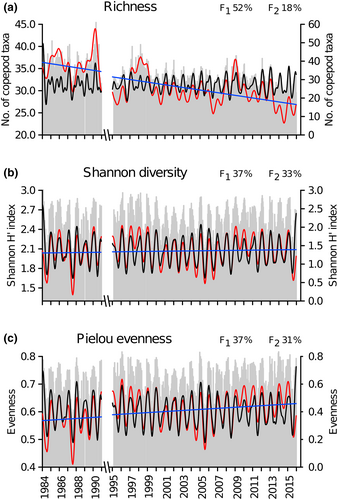
Among the 147 copepod taxa detected during the investigation period, 144 were identified at the species level, two at the family level, and one at the order level (Table S1). Six taxa accounted for 81.3% of the total copepod abundance: Paracalanus parvus complex (27.2%), Clausocalanus spp. (15.9%), Acartia clausi (13%), Oithona spp. (9.8%), Centropages typicus (8.1%), and Temora stylifera (7.3%). On average, both richness (S) and Shannon diversity (H′) were highest in winter and lowest in summer (Figure S3), a pattern opposite to that of copepod abundance. The average number of species recorded each month decreased from a maximum of 34 (±5) in February to a minimum of 27 (±5) in June–July, and H′ ranged from 2.6 (±0.2) in January–February to 1.5 (±0.5) in July. Evenness (J) showed a similar seasonal pattern, decreasing from 0.74 (±0.05) in January to 0.47 (±0.1) in July–August. During the three decades, only richness showed a significant long-term trend (Table 1, Figure 3a–c), with a sharp drop between 1990 (40 ± 10 species sample−1) and 1995 (27 ± 3 species sample−1). However, the total number of species changed little between the first 7 years (S = 102) and the last few years (S = 108) of the series.
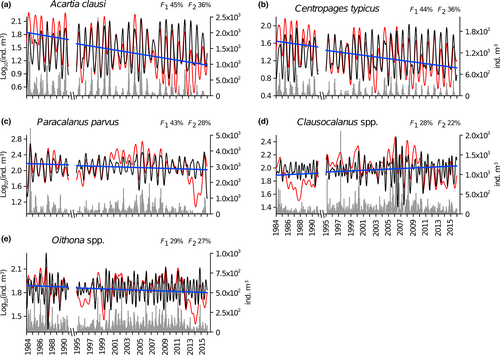
Four calanoid species were present throughout the year, but peaked in different seasons: A. clausi and C. typicus overlapped with the highest abundances in spring, followed by the P. parvus complex in summer and T. stylifera in late summer–autumn (Figure S4). The genera Clausocalanus and Oithona showed two seasonal peaks, in late winter–early spring and late summer–early autumn, and the lowest abundance in July (Figure S4). The seasonal cycle was the dominant mode of temporal variability (higher variance associated with the harmonic of 24 fortnights in F1) for the four dominant copepod species and was only secondarily important for the two genera that had bimodal annual patterns (Table 1, Figure S4). With the exception of T. stylifera, all of the above-mentioned copepod taxa showed a significant long-term trend (the presence of the ∞ harmonic and results of linear regression, Table 1). Acartia clausi, C. typicus, P. parvus complex, and Oithona spp. (mainly O. similis, not shown) had a negative trend (Figure 4a–c,e). In contrast, Clausocalanus spp. showed a general positive trend over the entire time series, but their abundance (and related F1) decreased over the last 7 years (Figure 4d), mainly due to C. furcatus, C. paululus, and C. pergens, all with negative anomalies after 2010 (not shown). For T. stylifera, the skewed residuals in the linear regression of F1 could explain the discrepancy between its significance and lack of the ∞ harmonic (Table 1).
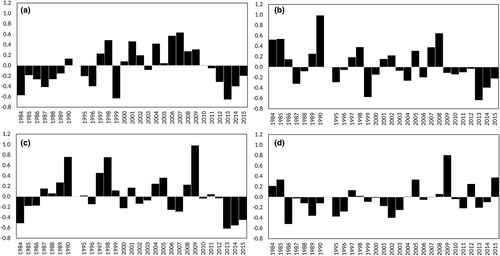
The interannual patterns of many other copepod taxa that commonly occurred with lower abundances were characterized by negative anomalies over the last 4–7 years. This was the case for Calocalanus spp., Oncaeidae, and some small neritic calanoids (rare Acartiidae, Centropages kroyeri, C. ponticus, Isias clavipes, Ctenocalanus vanus, Paracalanus denudatus, and P. nanus) (Figure 5a–c). In contrast, copepods typical of offshore and epi-mesopelagic waters (all recorded species belonging to the genus Pleuromamma and the families Aetideidae, Calanidae, Candaciidae, Euchaetidae, Eucalanidae, Heterorhabdidae, Lucicutiidae, Spinocalanidae, and Scolecitrichidae) tended to be more abundant during the last decade of the study period (Figure 5d).
Regarding the less common and much less abundant copepods, the disappearance of Acartia margalefi and Paracartia latisetosa (Figure S5A,B) and the establishment of A. negligens and P. grani populations (Figure S5C,D) confirmed previous records (Mazzocchi et al., 2012), whereas Diaixis pygmaea recovered in the last few years after a long period of almost undetectable occurrence (Figure S5E). A non-indigenous species, Pseudodiaptomus marinus, was first observed in July 2014 (3 years after its detection by eDNA metabarcoding, Di Capua et al., 2021) and thence recorded in other six samples, with a maximum abundance of 2.4 ind. m−3 (data not shown).
3.3 Relationship between zooplankton and environmental variables
The results of the cross-correlation analysis of F1s revealed that the long-term variability of most zooplankton descriptors, particularly cladocerans, thaliaceans, and the P. parvus complex, were significantly positively correlated with SST, with the exception of A. clausi and Clausocalanus spp., which were negatively correlated (Figure 6, Table S2). Cladocerans, A. clausi, C. typicus, and the P. parvus complex were negatively correlated with the MLD, and this relationship was mainly driven by seasonal variability (high correlation between F1 and F2). Cladocerans and C. typicus and, to a lesser extent, A. clausi, were positively correlated with Chl a. Cladocerans were also negatively correlated with SSS (Table S2). Overall, a positive correlation was found between the zooplankton descriptors and their potential phytoplankton prey (Table S3). Thaliaceans and cladocerans were positively correlated with the entire phytoplankton size spectrum, including the smallest size fraction. Among the copepods with significant long-term trends, only A. clausi, C. typicus and the P. parvus complex were positively correlated with phytoplankton 5–30 μm.

3.4 Shifts in zooplankton and their habitat
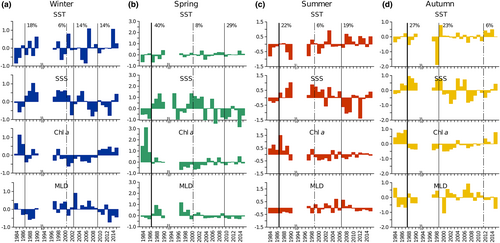
The most significant shift in the environmental variables at LTER-MC occurred between 1985 and 1987 in most seasons (Figure 7) and concerned SSS, which increased in all seasons, and Chl a, which reversed to negative anomalies from autumn to spring. In winter (Figure 7a), positive SST anomalies have been recurrently observed since 1987; another shift occurred in 2009, when Chl a anomalies changed from negative to positive, corresponding to an MLD decrease. Among several secondary shifts, in autumn 2012, SST and Chl a anomalies changed from negative to positive, whereas MLD changed in the opposite manner (Figure 7d).
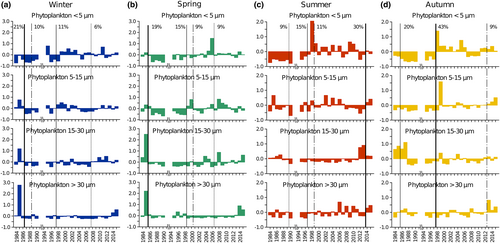
The phytoplankton size structure showed main winter and spring shifts in the early part of the time series, particularly after 1985–86 due to the abrupt decrease in all size classes (Figure 8a,b). Summer phytoplankton changed remarkably after 2013, mainly because of an increase in the 5–15 and >30 μm cells and a decrease in the 15–30 μm cells (Figure 8c). A marked discontinuity occurred in autumn after 1997, with the reversal of the <5 μm size fraction from a long period of negative annual anomalies to 8 years of positive anomalies (Figure 8d).
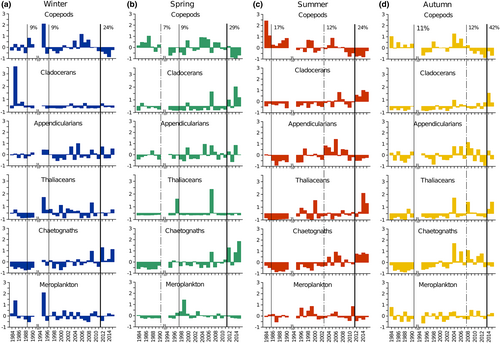
A marked discontinuity in the six main zooplankton groups occurred after 2011 across all the seasons (Figure 9). Positive anomalies in chaetognaths and appendicularians and negative anomalies in copepods were detected in winter (Figure 9a); positive anomalies in cladocerans and chaetognaths and negative anomalies in copepods were identified in spring (Figure 9b). Summer was characterized by positive anomalies for cladocerans, chaetognaths, and, to a lesser extent, thaliaceans (Figure 9c). The most remarkable shift was recorded in autumn (42% of the variance explained), which was related to the positive anomalies of cladocerans and thaliaceans (Figure 9d). Secondary shifts were observed in different years according to the season, either during the first part (1985–1986 in summer, 1988–1989 in winter, and 1990 in autumn), or at the beginning of the second part of the time series (1997–1998 in spring) (Figure 9a–d).
4 DISCUSSION
4.1 Zooplankton temporal variability and role of the environment
The pelagic environment in the inner Gulf of Naples is characterized by active hydrodynamics and high physical and chemical variability at different time scales (Romillac et al., under revision; Cianelli et al., 2012; Kokoszka et al., 2023). Despite these mutable conditions, local plankton communities exhibit recurrent annual cycles of both bulk properties and population components (Castellani et al., 2016; Longobardi et al., 2022; Mazzocchi et al., 2011; Mazzocchi & Ribera d'Alcalà, 1995; Zingone et al., 2019). The present study, covering a three-decade period, confirms a well-established seasonal cycle as the main mode of zooplankton temporal variability at the LTER-MC sampling site, as it also emerged from other coastal time series in the Mediterranean Sea (Berline et al., 2012; Mazzocchi et al., 2007). In addition, the lack of any significant long-term trend in the total zooplankton abundance suggests that the whole community can dampen the environmental variability observed in the area over the interannual scale (Romillac et al., under revision; Kokoszka et al., 2023). However, the stability of the total zooplankton abundance over the years hides important changes in some of the main zooplankton groups, indicating different responses in animals with different ecological characteristics and functional roles in the pelagic environment.
A striking change in the Gulf of Naples is the decrease in copepods in all seasons, particularly after 2010, which is paralleled by an increase in chaetognaths. However, the lack of a significant correlation between the trends of these two groups does not support the top-down effect of chaetognath predation on the long-term variability of copepods. Weak predation control is also suggested by the low feeding rates of chaetognaths on copepods recorded over the years at LTER-MC (<1 prey chaetognath−1 day−1, P. Simonelli and M.G. Mazzocchi, unpublished data), similar to those recorded in the northwestern Mediterranean Sea (Durò & Saiz, 2000). In the NE Atlantic (Bedford et al., 2020) and North Sea (Capuzzo et al., 2017), the decrease in copepod abundance observed since the 1980s has been related to a general decrease in primary production and, on the NE Altantic shelf, with nutritionally poor conditions caused by the relative increase in picophytoplankton (Schmidt et al., 2020). The decrease in copepod abundance in the Gulf of Naples appears to be related to changes in temperature, MLD, Chl a concentration, and abundance of defined phytoplankton size fractions. The year-to-year variability of A. clausi, C. typicus and the P. parvus complex, for instance, is strongly negatively correlated with MLD, which is not surprising because these species start to increase at the beginning of the stratification period and peak during the period of the shallowest MLD. A direct trophic interaction appears to shape the long-term patterns of A. clausi and C. typicus, which are significantly correlated with those of Chl a and 5–30 μm phytoplankton size fraction, the latter being within the preferred size spectrum of their potential prey (Katechakis et al., 2004; Tiselius et al., 2013). In recent decades, a decline in A. clausi and Paracalanus has also been reported in the Helgoland Roads time series, in association with an increase in the North Sea SST (Boersma & Renz, 2013). Overall, Acartia spp. declined along the longitudinal margins of the North Sea, in the Bay of Biscay, and English Channel, but their decrease in these regions appeared unrelated to changes in SST, chlorophyll, and phytoplankton abundance (Alvarez-Fernandez et al., 2015; Eloire et al., 2010; Valdés et al., 2022). Therefore, it seems that some copepod species display common patterns of long-term variation that might be interpreted as responses to climate change affecting the Northern Hemisphere (Beaugrand et al., 2015). However, further analyses are needed to better define the spatio-temporal progression of these patterns and the relative importance of the local environment versus large-scale climate.
Trophic interactions in plankton are influenced by physical factors. The extension of the mixed layer affects the resource availability and encounter rates between copepods and their prey. The shallower mixed layer at LTER-MC in 2001–2019 in early winter (−1.27 m year−1) and shorter duration of the fully mixed water column period (Romillac et al., under revision; Kokoszka et al., 2023), associated with an increase in Chl a, might have disadvantaged the most abundant species of the genus Clausocalanus, which thrive well in oligotrophic, food-diluted environments (Mazzocchi et al., 2014). The fact that C. furcatus, which is abundant at LTER-MC in autumn (Mazzocchi & Ribera d'Alcalà, 1995), has lower reproductive rates at higher phytoplankton concentrations (Mazzocchi & Paffenhöfer, 1998) supports the negative correlations between Clausocalanus and both Chl a and phytoplankton. The lack of a significant correlation between Oithona spp. and any environmental variable likely reflects the heterogeneity of this genus, which occurs in the Gulf of Naples with nine species having different ecological and phenological characteristics (Mazzocchi & Ribera d'Alcalà, 1995; Paffenhöfer & Mazzocchi, 2002). The results of a comparative analysis between the LTER-MC and L4 time series for the period 1984–2013 indicated that temperatures >20°C limit the persistence and growth of O. similis populations (Castellani et al., 2016), which could explain the recent decline of this species in the Gulf of Naples. A long-term decline of Oithona spp. was also recorded in the NE Atlantic (Schmidt et al., 2020), and in the Helgoland Roads time series from 2006 to 2010 after many years of positive anomalies (Boersma et al., 2015).
The lack of long-term trends observed in copepod diversity and evenness suggests an overall stability in the structure of copepod assemblages on the time scale considered in the present study. Over a longer time scale, copepod richness in the Mediterranean Sea is expected to slowly decrease as a consequence of the tropicalization of the basin, but with limited ecological impacts given the functional redundancy among Mediterranean copepods (Benedetti et al., 2019). At LTER-MC the decrease in copepod richness is associated with rare species, which have been consistently found at very low frequencies (<1%) in recent years. The increased abundance of species that typically live in offshore and epi-mesopelagic waters has likely been favored by the enhanced coupling between inshore and offshore waters over the last few years (Kokoszka et al., 2023).
The recent decline in omnivorous/herbivorous copepods is opposed by the increase in cladocerans (mainly Penilia avirostris) and pelagic tunicates (particularly thaliacean doliolids), both of which are filter feeders, and chaetognaths, which are carnivorous predators, indicating a change in the functional structure of the LTER-MC zooplankton. Penilia avirostris, which dominates the cladoceran abundance during the entire time series (Montalbano, 2021), is a suspension feeder that ingests particles as small as 2–20 μm (Atienza et al., 2006). Gelatinous mucous-mesh grazers such as appendicularians and thaliaceans can retain food particles of a wide size spectrum, from 0.16–0.18 μm (virus) to 15–54 μm (reviewed by Conley et al., 2018). Thus, they are unique functional guilds that can directly link mesozooplankton to the microbial circuit of pelagic trophic webs (Sutherland & Thompson, 2022) not accessible to copepods (e.g., Bedo et al., 1993). The positive correlation between the long-term patterns (F1) of cladocerans and thaliaceans and those of phytoplankton ≤30 μm, including the smallest <5 μm size fraction, indicates that food conditions are an important factor driving the decadal trends in these two groups. In addition, the increases in summer (cladocerans) and autumn (thaliaceans and chaetognaths) zooplankton groups appear to be related to the positive SST trend recorded in the area (Kokoszka et al., 2023; this study). A similar relationship with temperature has also been observed in North Sea cladocerans and is associated with the northward displacement of P. avirostris (Johns et al., 2005). Chaetognaths have also increased in the English Channel, with no apparent link to environmental variables though (Eloire et al., 2010).
The temporal variability of meroplankton, mainly represented by malacostracan, cirriped, and gastropod larvae, which are more abundant in winter and spring, reflects the reproduction and recruitment of benthic invertebrates. Their positive but not significant trend at the LTER-MC site indicates a stable character of the local benthic assemblages. However, our knowledge of the identity and ecology of meroplanktonic larvae is limited, and a deeper investigation of this compartment and the temporal dynamics of its species (not simply groups) with integrative taxonomy and molecular tools (e.g., Di Capua et al., 2021) would greatly improve our understanding of the pelagic system and benthic–plankton coupling.
4.2 Shifts
Clear temporal discontinuities were seen over the 1984–2015 period based on zooplankton groups and their environment. The most significant shift in environmental variables in the mid-1980s was driven by an increase in SSS and a decrease in Chl a and phytoplankton abundance, only partially involving zooplankton, mainly summer copepods, which collapsed during that period. It is worth noting that quasi-synchronic regime shifts were detected in marine zooplankton in other regions of the Northern Hemisphere, likely related to abrupt climate changes driven by increasing temperatures and a strongly positive phase of the Arctic oscillation (Beaugrand et al., 2015). Towards the end of the 1980s, a remarkable change was also observed in the planktonic system of the Gulf of Trieste (North Adriatic Sea), where a drastic increase in copepod abundance coincided with a shift toward smaller species, likely a consequence of temperature increase and changes in the Adriatic circulation linked to the Eastern Mediterranean Transient (Conversi et al., 2009 and references therein). In the Ligurian Sea, an increase in jellyfish outbreaks was associated with high-temperature anomalies and a decrease in some copepods and chaetognaths (Molinero et al., 2008). However, in successive years (1995–2019), no monotonous long-term trends in zooplankton abundance, size, or taxonomic composition were detected (Feuilloley et al., 2022). It is probable that the shift observed around 1987 in the Gulf of Naples was linked to the more general changes that affected the marine system in the Northern Hemisphere, although our time series started only a few years before and was interrupted soon after. Therefore, the critical period necessary to adequately test this hypothesis is lacking.
The main shift in the LTER-MC zooplankton recorded after 2011 across seasons, particularly in autumn, affected functional groups that play distinct roles in pelagic food webs, such as very active filter-feeder primary consumers (cladocerans and thaliaceans) and raptorial secondary consumers (chaetognaths). This shift might be related to the positive temperature anomalies and changes recorded after 2010 in the extension and duration of the MLD during the autumn (Kokoszka et al., 2023). The increase in cladocerans and thaliaceans, in parallel with the positive anomalies of <5 μm phytoplankton, suggests modifications in the structure of planktonic food webs in the coastal Gulf of Naples, with more direct trophic links between mesozooplankton and the smallest phytoplankton size fraction.
5 CONCLUSIONS
Zooplankton decadal variations in the Gulf of Naples show opposite long-term trends in different groups or species despite no drastic changes in the overall community abundance and composition. The main trends concerning the increase in filter feeders (cladocerans, appendicularians, and thaliaceans) and the decrease in selected copepod species show significant relationships with several physical and biotic characteristics of their environment, mostly related to food availability and temperature. These first valuable indications call for in-depth studies on the biological, trophic, behavioral, and ecological traits of the main players, aimed at understanding the mechanisms behind the observed changes.
Some changes in the system indicate the role of both local and large-scale climate-driven hydrographic features. The disappearance or decrease in strictly neritic copepod species and the increased abundance of typical offshore species might reflect an enhanced influence of the offshore waters at the site after 2010. The first shift concerning the abiotic and biotic environment in 1985–1987 supports the hypothesis of a teleconnection with other regime shifts synchronously detected in many oceanic basins in the Northern Hemisphere. The shift in zooplankton after 2011 seems to be linked to changes in the local atmospheric and hydrological conditions, and suggests modifications in the structure of the trophic webs that could be the expression of a temporary environmental oscillation (D'Alelio et al., 2015, 2019) or mark the start of a new trophic regime.
Overall, our study underlines the need for a good knowledge of the entire spectrum of zooplankton components to detect temporal changes and modalities that can be masked by the bulk properties of the whole community. This will allow for a better understanding and exploitation of the role of zooplankton as sentinels of environmental changes.
ACKNOWLEDGMENTS
The authors thank Marco Cannavacciuolo, Augusto Passarelli, Ferdinando Tramontano, Gianluca Zazo and the crew of R/V Vettoria for sampling and data collection at sea. We also thank the Marine Research Infrastructure of the Stazione Zoologica for acquiring, processing, and managing the environmental data, and the entire LTER-MC Team for continued collaboration in the project. We are very grateful to three anonymous reviewers for their accurate and constructive criticisms and suggestions, which helped to improve the early version of this paper. This work benefited of discussions within the ICES Working Group on Zooplankton Ecology (WGZE).
FUNDING INFORMATION
The LTER-MareChiara program is funded by SZN.
CONFLICT OF INTEREST STATEMENT
The authors declare no conflict of interest.
Open Research
DATA AVAILABILITY STATEMENT
Zooplankton and environmental data used in this paper will be available in a public repository upon paper publication.


