A CHEMTAX-derived phytoplankton community structure during 12-year observations in the Gulf of Naples (LTER-MC)
Maria Saggiomo and Francesco Bolinesi contributed equally to this work.
Abstract
The rapid response of phytoplankton communities to environmental changes makes this compartment one of the most important biological variable to consider in dealing with ecology and trophodynamic of coastal areas, especially in relation with ongoing climate changes and increased human pressures. In the last 30 years, the use of chemotaxonomy has improved the capability to detect phytoplankton community composition in terms of chemofunctional groups, especially for small size species requiring specific expertise and techniques, as well as time-consuming observation with light microscope. In this study, the temporal variability of chemotaxonomic functional groups has been investigated in surface waters of a LTER station in the Gulf of Naples over 12-year weekly sampling activities (2003–2015). Data reveal increasing trends in the percentage contribution of diatoms, prasinophytes, cryptophytes to the total phytoplankton biomass, while other groups show a decreasing trend. Nevertheless, strong differences in the intervals of periodicity for each chemofunctional group have emerged, both in terms of timescale and strength of periodicity over time, implying that temporal dynamics of groups were not stationary over the time and that they have different relationships with environmental variability. Our results contribute to enrich scientific knowledge on the ecology of this LTER site and underline the importance of chemotaxonomy as a monitoring tool in coastal marine systems.
1 INTRODUCTION
Marine ecosystems are experiencing many changes in response to natural processes, human activities and climate change, with phytoplankton community structure and dynamics strongly affected by shifts in hydrological regimes (Chavez et al., 2011; Kulk et al., 2020; Marty et al., 2002; Marty & Chiavérini, 2010). Phytoplankton is a key component of marine ecosystem functioning, being represented by primary producers contributing about half of the global net primary production with strong implication for global carbon fluxes, biogeochemical cycles, and ocean–atmosphere interactions (e.g., Bauer et al., 2013; Litchman et al., 2015; Tweddle et al., 2018).
The rapid response of phytoplankton to environmental changes makes them one of the indicators of the Marine Strategy Framework Directive (MSFD) for the assessment of the Good Environmental Status (GES) of the marine environments (Danovaro et al., 2016; Ferreira et al., 2011; Finkel et al., 2010; Garmendia et al., 2013; Mangoni et al., 2013). Changes in environmental conditions do affect the abundance of phytoplankton, as well as its community composition in terms of size classes and functional groups (Bolinesi et al., 2020; Mangoni et al., 2017; Rodríguez et al., 2001). The rapid increases in phytoplankton standing stocks are often followed by rapid declines due to resources depletion or herbivores grazing and other export processes consuming phytoplankton (e.g., Behrenfeld, 2010; Falkowski et al., 1998; Martinez et al., 2009; Siegel et al., 2005). For these reasons, both seasonal and short-term environmental variations affect the community structure and trophodynamic in different ways, so that the information on phytoplankton dynamics in Long Term Ecological Research (LTER) sites can represent a tool for the evaluation of the ongoing climate changes (Acri, 2020; Alvarez-Cobelas et al., 2019; Colijn, 1998; Vihervaara et al., 2013).
The Gulf of Naples, located in the Tyrrhenian Sea at the border between the central and southern regions of the western Mediterranean, represents a suitable site for the study of seasonal and interannual variations of coastal phytoplankton species and assemblages. Indeed, the MareChiara station (LTER-MC) represents one of the most coastal Long-Term site in the world, with a high-resolution time series of data collected since 1984 (Longobardi et al., 2022; Ribera d'Alcalà et al., 2004). This long-term time series focuses on characterizing the structure of the plankton communities, in terms of standing stocks and species composition, and following their variability at different temporal scales in relation to environmental conditions. Since 2006, the MareChiara time series has been part of the International network of Long Term Ecological Research (I-LTER; https://www.ilternet.edu). In a global comparison of planktonic systems based on chlorophyll data, the site has been shown to be highly variable at both the seasonal and interannual scale (Cloern & Jassby, 2010) which is compatible with its nature of a mid-latitude coastal site not far from one of the most populated areas of the Mediterranean Sea (Ribera d'Alcalà et al., 2004).
In recent years, HPLC has been used to estimate phytoplankton composition by identifying photosynthetic pigments and include rapid turnover and reproducible results (Jeffery & Vesk, 1997; Wright et al., 1996). The method is based on analysis of accessory pigments, in addition to chlorophyll-a (Chl-a) or the modified divinyl-Chl-a found in all phytoplankton species, and that some of these accessory pigments are specific for the individual phytoplankton groups (Brunet & Mangoni, 2010; Millie et al., 1997; Wright & Jeffrey, 2006). HPLC technique is advantageous in the large scale-mapping of pigments in the world oceans (Higgins et al., 2011; Llewellyn et al., 2005; Mantoura & Llewellyn, 1983; Tester et al., 1995; Vidussi et al., 2001). In addition, this technique allows to detect and identify microscopically overlooked or undetermined ultraphytoplankton species (prokaryotes and eukaryotes <5 μm), based on their pigment content (Ansotegui et al., 2003; Antajan et al., 2004; Garibotti et al., 2003). The usage of this technique requires particular attention, since changes in cellular pigment contents due to light and temperature variations, nutrient availability or distinct growth phases could lead to a misinterpretation of data (Havskum et al., 2004; Irigoien et al., 2004; Llewellyn et al., 2005). In this paper, temporal variations of phytoplankton biomass and chemotaxonomic functional groups have been analyzed at the surface water of LTER-MC station, over a 12-year weekly observation period from 2003 to 2015 to shed light on the timescale variability of different phytoplankton groups, and their trends in relation with underlying abiotic dynamics.
2 METHODS
2.1 Study site
MareChiara (MC) is a LTER sites located ~3 km from the coastline (40 48.5′ N 14 15′ E), on the 75 m isobath at the boundary between two subsystems: the coastal eutrophic area, influenced by the land run-off from a very densely populated area, and the offshore oligotrophic area represented by the open Tyrrhenian waters. Over the seasons, the location and the width of the boundary between the two subsystems vary (Carrada et al., 1981; Marino et al., 1984) and highly dynamic water mass distributions may enhance the exchange between the two subsystems (Casotti et al., 2000; Cianelli et al., 2015; D'Alelio et al., 2015). A high temporal and spatial variability for the physical and chemical parameters characterizes the inner part of the Gulf of Naples (Ribera d'Alcalà et al., 2004). Phytoplankton is dominated by diatoms and flagellates (mainly prymnesiophytes and cryptophytes) for most of the year (Scotto di Carlo et al., 1985), including summer, when surface blooms of small species succeed and overlap each other (Piredda et al., 2017; Zingone et al., 1990). Sediment trap sampling has revealed high production rates for dinoflagellate cysts from spring to late autumn (Montresor et al., 1998). The autumn bloom in October–November has been associated with calm and stable weather conditions known as ‘St. Martin's Summer’ (Zingone et al., 1995).
2.2 Sampling activities
Weekly samplings were carried out from 2003 to 2015 on M/N Vettoria at the Long Term Ecological Research site MareChiara (LTER-MC) of the Gulf of Naples.
2.2.1 Environmental parameters
The water column structure was obtained by CTD SeaBird 911 Plus multiparametric probe with sensors for temperature, conductivity, and dissolved oxygen, fluorescence, water turbidity, and derived parameters, such as salinity and density. The multiparametric probe was mounted on a Carousel bearing 12 Niskin bottles with a volume of 10 L. Sampling at surface (0 m) was carried out with Niskin bottles. Water samples for the different analysis were then accurately collected from the Niskin bottle. About 20 mL samples for dissolved inorganic nutrients were collected in HDPE vials and immediately stored at −20°C. Two different instruments were used for nutrient analyses: an Autoanalyzer Technicon II series until 2005 and a FlowSys Autoanalyzer (SYSTEA) thereafter, following the protocols developed by Hansen and Grasshoff (1983) adapted for the different instrumentation.
2.2.2 Biological parameters
For the analysis of the total phytoplankton biomass, ~500 mL of sea water were filtered through Whatman GF/F membrane filters (25 mm diameter). Filters for the determination of Chl-a and phaeopigments (phaeo) were mechanically grinded in a solution of 90% acetone, then the extract was measured with a SpexFluoromax spectrofluorometer until July 2006, and a SHIMADZU (mod. RF-5301PC) spectrofluorometer (Holm-Hansen et al., 1965) from August 2006 onward. Both instruments were checked daily with a Chl-a standard solution (Sigma-Aldrich). For the determination of phytoplankton chemofunctional groups by chemotaxonomic criteria (Mackey et al., 1996; Wright et al., 2010), 1–3 L of seawater were filtered on board onto Whatman GF/F filters (47 mm diameter) and stored in liquid nitrogen until pigments HPLC analysis. HPLC pigments separations were made on an Agilent 1100 HPLC (Agilent technologies, United States) according to the method outlined in Vidussi et al. (1996) and modified by Brunet and Mangoni (2010). The system was equipped with an HP 1050 photodiode array detector and a HP 1046A fluorescence detector for the determination of chlorophyll degradation products. Instrument calibration was carried out with external standard pigments provided by the International Agency for 14C determination-VKI Water Quality Institute. Pigment concentrations were used to estimate the contributions of the main chemofunctional groups to the total Chl-a using the matrix factorization program CHEMTAX 1.95 following Latasa (2007). The initial and final ratio matrix used for the estimation of chemotaxonomically defined groups is reported in Table 1.
| Chl_c3 | Chl_c2 | Peri | But-fuco | Fuco | Pras | Hex-fuco | Zea | Allo | Violax | Chl_b | DivChl_a | Chl_a | |
|---|---|---|---|---|---|---|---|---|---|---|---|---|---|
| A. | |||||||||||||
| Chloro | 0 | 0 | 0 | 0 | 0 | 0 | 0 | 0.012 | 0 | 0.020 | 0.312 | 0 | 1 |
| Crypto | 0 | 0.108 | 0 | 0 | 0 | 0 | 0 | 0 | 0.360 | 0 | 0 | 0 | 1 |
| Cyano1 | 0 | 0 | 0 | 0 | 0 | 0 | 0 | 0.586 | 0 | 0 | 0 | 0 | 1 |
| Cyano4 | 0 | 0 | 0 | 0 | 0 | 0 | 0 | 0.224 | 0 | 0 | 0.310 | 1 | 0 |
| Diato1 | 0 | 0.114 | 0 | 0 | 0.570 | 0 | 0 | 0 | 0 | 0.004 | 0 | 0 | 1 |
| Diato2 | 0.065 | 0.221 | 0 | 0 | 1.020 | 0 | 0 | 0 | 0 | 0 | 0 | 0 | 1 |
| Dino3 | 0 | 0.226 | 0.540 | 0 | 0 | 0 | 0 | 0 | 0 | 0 | 0 | 0 | 1 |
| Dino2 | 0.032 | 0.100 | 0 | 0.061 | 0.142 | 0 | 0.187 | 0 | 0 | 0 | 0 | 0 | 1 |
| Hapt6HF | 0.130 | 0.016 | 0 | 0.010 | 0.080 | 0 | 0.400 | 0 | 0 | 0 | 0 | 0 | 1 |
| Hapt6LF | 0.270 | 0.119 | 0 | 0.120 | 0.020 | 0 | 1.100 | 0 | 0 | 0 | 0 | 0 | 1 |
| Prasi | 0 | 0 | 0 | 0 | 0 | 0.145 | 0 | 0.017 | 0 | 0.027 | 0.367 | 0 | 1 |
| B. | |||||||||||||
| Chloro | 0 | 0 | 0 | 0 | 0 | 0 | 0 | 0.012 | 0 | 0.020 | 0.312 | 0 | 1 |
| Crypto | 0 | 0.108 | 0 | 0 | 0 | 0 | 0 | 0 | 0.360 | 0 | 0 | 0 | 1 |
| Cyano1 | 0 | 0 | 0 | 0 | 0 | 0 | 0 | 0.586 | 0 | 0 | 0 | 0 | 1 |
| Cyano4 | 0 | 0 | 0 | 0 | 0 | 0 | 0 | 0.224 | 0 | 0 | 0.310 | 1 | 0 |
| Diato1 | 0 | 0.114 | 0 | 0 | 0.570 | 0 | 0 | 0 | 0 | 0.004 | 0 | 0 | 1 |
| Diato2 | 0.065 | 0.241 | 0 | 0 | 1.020 | 0 | 0 | 0 | 0 | 0 | 0 | 0 | 1 |
| Dino1 | 0 | 0.226 | 0.540 | 0 | 0 | 0 | 0 | 0 | 0 | 0 | 0 | 0 | 1 |
| Dino3 | 0.032 | 0.100 | 0 | 0.128 | 0.142 | 0 | 0.117 | 0 | 0 | 0 | 0 | 0 | 1 |
| Hapt6HF | 0.130 | 0.016 | 0 | 0.010 | 0.080 | 0 | 0.400 | 0 | 0 | 0 | 0 | 0 | 1 |
| Hapt6LF | 0.388 | 0.128 | 0 | 0.155 | 0.021 | 0 | 0.912 | 0 | 0 | 0 | 0 | 0 | 1 |
| Prasi | 0 | 0 | 0 | 0 | 0 | 0.145 | 0 | 0.016 | 0 | 0.027 | 0.367 | 0 | 1 |
2.2.3 Statistical analyses
Statistical analyses were carried out using PAST PAleontological STatistics Version 3.20 (Øyvind Hamme). The continuous wavelet transform has been applied on monthly averaged time series to examine the seasonal patterns of chemotaxonomically defined groups at different scales (small, intermediate, and large scales simultaneously) over the 2003–2015 sampled period. The Morlet wavelet has been used as base function in the analyses (Grinsted et al., 2004) and Lag values (null hypothesis) have been prior determined thought ARMA analyses (Prokoph et al., 2000; Torrence & Compo, 1998). The algorithm is based on fast convolution of the signal with the wavelet at different scales, using the Fourier transform. The so-called “cone of influence” shows the region where boundary effects are present. To investigate the relationship between environmental variables (temperature, salinity, dissolved inorganic nutrient concentrations) and biological ones (Total phytoplankton biomass, chemotaxonomically defined groups) a principal component analysis (PCA) based on a Pearson correlation matrix was performed, dealing missing data with pairwise deletion.
3 RESULTS
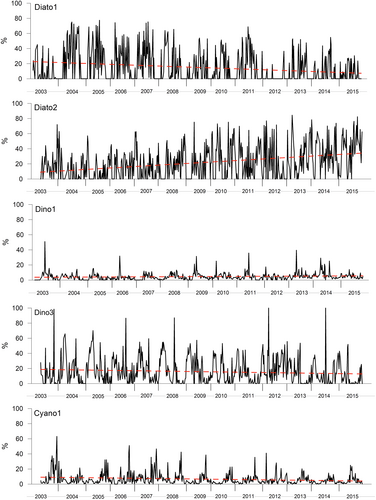
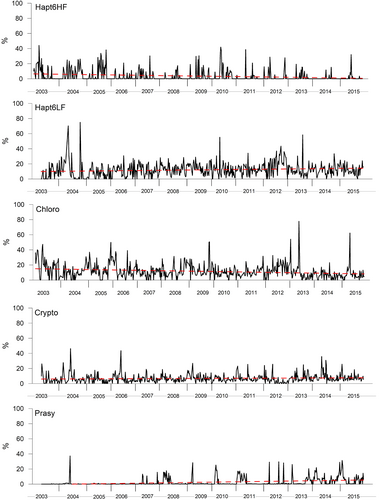
The percentage contribution of each chemotaxonomically defined groups have been reported in a XY plot, to highlight the point distribution of values over the time (Figures 1 and 2). To statistically check if there is an upward or downward trend of the variable of interest over time, the Mann–Kendall test (Gilbert, 1987; Mann, 1945; Tragin & Vaulot, 2018) has been applied (Table 2). In general, diatoms represented the most abundant group in the entire sampled period, with a significant increase over the time. The group showed an annual mean ranging from 26% (2003) to 45% (2011), with a different contribution of subgroups Diato1 and Diato2 (non-containing and containing Chl_c3, respectively). Diato1 showed a decrease over the time (with a minimum of 6% in 2006), while Diato2 experienced a net increase with percentages ranging from 9% (2005) to 37% (2015). Dinoflagellates represented the second most abundant groups with a mean of 20%. However, it must be noted the strong differences between Dino1 (peridinin-containing dinoflagellates) and Dino3 (without peridinin). Dino 1 ranged between 3% (2007) and 7% (2014), with a significant (although weak) increasing trend, while Dino3 ranged between 10% (2015) and 25% (2012) with a significant decreasing trend over the time. Haptophytes represented the third most representative group, accounting globally for 15% of community considered in this dataset. Also in this case, the two considered subgroups (further details are available in the public library CHEMTAX 1.95) Hapto6HF and Hapto6LF showed distinct trends, with Hapto6HF ranging from 0.7% (2014) to 8% (2004) displaying a decreasing trend, and Hapto6LF ranging from 9% (2003) to 19% (2012) displaying an increasing trend. Chlorophytes, generally considered as low-salinity lovers (Tragin & Vaulot, 2018), showed a decreasing trend with annual mean values ranging between 19% (2003) and 6% (2014). Cryptophytes (Crypto) showed a slight increasing trend, with annual means ranging from 4% (2012) to 8% (2013); cyanophytes (Cyano1) showed a decreasing trend, with annual means ranging from 4% (2014) to 11% (2003). Prasinophytes (Prasi), characterized by the presence of the marker pigment prasinoxanthin, showed a net increasing trend, being almost absent in the first part of the sampling period and mean annual percentages ranging between 0.1% (2003) and 7% (2015).
| Diato1 | Diato2 | Dino1 | Dino3 | Hapto6HF | Hapto6LF | Chloro | Crypto | Cyano1 | Prasy | |
|---|---|---|---|---|---|---|---|---|---|---|
| S | −22,110 | 39,477 | 20,648 | −12,765 | −24,017 | 22,669 | −30,593 | 16,786 | −17,237 | 61,348 |
| Z | −46.916 | 79.165 | 40.989 | −25.428 | −59–731 | 44.994 | −60.713 | 33.305 | −34–196 | 12–186 |
| p (no trend) | 2.71E−02 | 2.44E−12 | 4.15E−01 | .010997 | 2–33E−05 | 1.27E−05 | 1.27E−05 | .00086693 | 0–0006272 | 3.67E−30 |
| Statistically significant trend | Decreasing | Increasing | Increasing | Decreasing | Decreasing | Increasing | Decreasing | Increasing | Decreasing | Increasing |
The trend of chemotaxonomic groups is summarized in Table 2, with Diato2, Dino3, Hapto6LF, Crypto, and Prasi experiencing a positive trend, contrarily to the other groups.
Wavelet analysis revealed strong differences in the intervals of periodicity for each chemofunctional group, both in terms of timescale and strength of periodicity over time, implying that the time series of chemotaxonomically group were not stationary (Figure 3).
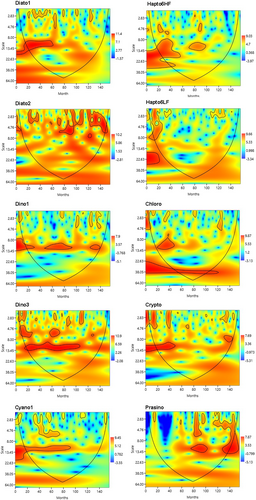
A marked, statistically significant ~12-month periodicity of Diato1 was only evident in the first 60 sampled months, with a less marked ~1–3 months periodicity (80, 100, 120 months) in the last part of the entire sampling period. On the contrary, Diato2 showed a marked short-time periodicity (2–6 months) in the second half of the sampling period (80–130 months). As concerns haptophytes, Hapto6HF showed a moderate ~12 months periodicity at the beginning of the sampling period, which disappeared except for the middle part (80–100 months); Hapto6LF showed only short (1–8) month periodicity in the first 24 months, and a moderate ~3-month periodicity over 110–130 sampled months. Dino1 (peridinin-flagellates) showed a ~12 months periodicity which is significant between 50 and 90 sampled months as well as in the last part of the plot, while short-term 1–2 month periodicity appeared in the second half of the sampled period; Dino2 also presented a ~12 months periodicity stretching from 20 to 110 sampled months, with a short-term (1–2 and 3–5) periodicity in the same periods, without significant periodicities in the last 50 months. Cyano1 showed a periodicity trend similar to that of Dino2, with less marked strength in shorter term variations. Chlorophytes showed ~38 months periodicity until 120th sampled months, and weakly periodicity of ~12 and ~1–3 periodicity between 20–50, 40–130 sampled months respectively. Crypto evidenced a significant ~12-month periodicity during the first 50 sampled months, with a 7/8-month periodicity at the end of the overall sampled period between months 120–140. Prasinophytes, contrarily to other groups, showed a first significant periodicity in the second half of the sampled period, with a ~12-month periodicity between months 70–100, and after 120 months.
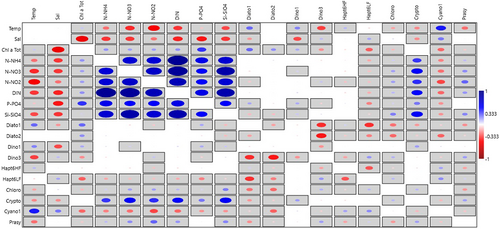
The univariate Pearson correlation analysis between chemotaxonomically defined groups and environmental variables showed correlation (~0.5) only for Crypto with N-NO4, N-NO3, P-PO4, Si-SO4, and DIN (Figure 4). Other groups were weakly correlated to other parameters. Diato1 and Dino1 showed a similar correlation with temperature (0.29, 0.24) and salinity (−0.2, −0.35). Dino3 showed a negative correlation with temperature (−0.37) and a weak positive one with salinity (0.13). Cryptophytes were negatively correlated with both temperature and salinity (−0.23). Cyano1 showed a relatively high positive correlation with temperature (0.45), salinity (0.27), and were negatively correlated with nutrient concentrations.
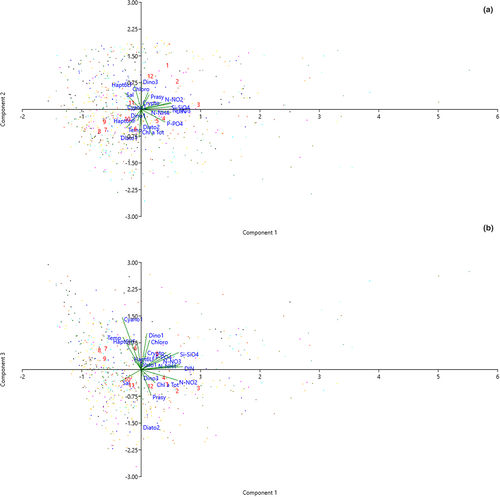
The three first components of the PCA on environmental and biological variables explained 52.26% of total variance (Component 1: 28.73%; Component 2: 14.63%, Component 3: 8.9%) Figure 5. Considering the first two components (Figure 5a), the distributions of observations (colored for each year) in a biplot chart, with an eigenvalue scale and month group labels in red, showed a slightly negative factor loading for environmental variables (salinity −0.2 and temperature −0.17) and a more evident positive correlation with nutrients (factor loading ~0.4) with respect to component 1. There was an inverse correlation between salinity and temperature with respect to the component 2, with total Chl-a, P-PO4 and Diato2 grouping in the second quadrant with spring months (April, May), suggesting that diatoms (in particular Diato2) dominated in the presence of high amount of phytoplankton biomass reached during lower salinity and higher P-PO4 load. The presence of winter months in the first quadrant, specified by red numbers 12, 1, 2, 3 (December, January, February, and March) indicate the major contribution of Prasi, Crypto e Dino3 in this period of the year. DIN, N-NO3, and Si-SiO4 almost overlap with component 1 (factor loading ~0.4) while Diat1, Hapto6HF, and Temperature fitted within the third quadrant represented by June, July, August, September, and October (6–10). Cyano1 and Hapto6LF were the two groups (beyond November -11- labeled in red) belonging to the fourth quadrant, characterized by relatively higher values of salinity. When the third component was considered (Figure 5b), Diato2 showed the highest factor loading (0.51) with respect to this component, appearing overlapped to it. On the other hand, except Dino 3 and Prasi, other groups were negatively correlated to Diato2 with respect to the component 3. Salinity was the only variables within the third quadrant, and it was inversely correlated to other nutrients (except N-NO2).
4 DISCUSSION
The interannual variability of phytoplankton communities became one of the main relevant questions of investigation carried out in the framework of the ongoing climate changes and human pressure on marine ecosystems (Poloczanska et al., 2013). In recent years, several studies have investigated the long-term changes of the magnitude and the timing of phytoplankton blooms (e.g., Edwards & Richardson, 2004; Longobardi et al., 2022; Thackeray et al., 2008), with seasonal pattern of total and species-specific phytoplankton biomass that may not persist over time (Carey et al., 2016; Thackeray et al., 2008; Winder & Cloern, 2010). In this study, the temporal variability of chemotaxonomic defined groups has been investigated in surface waters of the LTER station in the Gulf of Naples over 12-year weekly sampling activities (2003–2015).
The overall picture of the entire dataset indicates diatoms as the dominant group, followed by dinoflagellates, haptophytes, chlorophytes, and to a minor extent, by cryptophytes, cyanophytes and prasinophytes. PCA analyses reveal the strong influence of seasonal scale in structuring the phytoplankton community in a highly fluctuating environment as the Gulf of Naples, in accordance with Longobardi et al. (2022). In a more general perspective, the timescale intervals of seasonal variations often override small-scale variations linked to local inputs. It follows that, in the multiannual analysis, what we see is the result of the major forces (seasons) that include the small-scale effects of local perturbations (Cianelli et al., 2017). This is particularly true for the phytoplanktonic compartment characterized by a high turnover rate that regardless of everything, cannot be unread without short-term timescales (Brunet et al., 2003). All these aspects have emerged in the wavelet analyses that highlighted different periodicity among the considered groups, both in terms of short and long timescales, suggesting different responses of groups over the time (Figure 3). For example, Diato1 and Diato2 showed distinct periodicity, with the first one displaying a 1-year periodicity in the first part of the time series, and the second one displaying a shorter periodicity in the second half of the sampling period. Dino, Cyano, and Crypto showed a significant marked 1-year periodicity in the first half of the time series that decreased over the time. Prasinophytes, almost completely absent in the first half of the sampled period, showed a 1-year periodicity in the second part of the series although in a non-continuous way. In addition to the scale-related periodicity, also the Mann–Kendall test reveals upward or downward trend over time of different chemofunctional groups, with Diato2, Dino3, Hapto6LF, Crypto, and Prasino experiencing a positive growing trend, contrarily to what observed for other groups. The degree of accuracy plays a pivotal role in dealing with this kind of studies, since the higher the number of subgroups is, higher is the resolution of the study, since the possibility to check-in intragroup or intraspecific temporal variations.
To this end, the choice of pigment:Chl-a ratios need accurate analyses, since the pigment pool spectra of species strongly depends from environmental conditions (e.g., nutrient and light availability; Brunet et al., 2003), and the detectable pigments capacity depends on methodology as well as standard libraries. One of the advantages of this method, based on the use of pigment as chemotaxonomical marker, consists of a rapid individuation of chemofunctional groups (or in some cases the recognition of species) beyond body-cell size spectra, allowing for the identification and contribution of small species usually difficulties to identity under a light microscope (Goela et al., 2014; Nunes et al., 2019) and requiring different technique and long-term analyses. Among recent literature dealing with phytoplankton community at the MC station, our results agree with Cerino and Zingone (2006) that report the presence of cryptomonads throughout the year with main annual maxima in spring and summer and suggest the presence of a slightly increasing trend of this group toward in more recent years (Table 2). McDonald et al. (2007) analyzed the genetic diversity of ultraphytoplankton (<5 μm) between 2003 and 2004 reporting the presence of prasinophytes sequences only in the winter libraries (October and December). Many authors consider the chemotaxonomic method better that the traditional microscopy in oligotrophic waters, where 80% of the algae species are <3 μm (Goericke & Montoya, 1998) and different functional groups difficult to identify (Higgins et al., 2011). Although for the detection of different size classes (e.g., micro- nano- and pico-phytoplankton) in coastal water samples should be pre-filtered (Mangoni et al., 2017), a procedure not performed in sampling activities considered in this study, our results indicated that prasinophytes group was poorly detected until 2007 (except for a relative peak in the first half of 2004), becoming more abundant after this year, showing an increasing temporal trend (Table 2). Piredda et al. (2017) in a study dealing with HTS– metabarcoding approach to track temporal changes in protist communities at MC site in 2011, showed the dominance of diatoms and an over-representation of some groups (e.g., dominance of dinoflagellate sequences) not matching with light microscopy, reporting a considerable amount of unknown or undecipherable diversity in the study area. Our data confirm the net dominance of diatoms highlighting the existence of scale-related temporal patterns and different trends especially for less representative chemofunctional groups (e.g., chlorophytes, cryptophytes, prasinophytes) in a very long sampling period. We believe that our approach contributes significantly to the enrichment of the literature on the MC-LTER sites, representing a valid monitoring tool that must be considered in studying phytoplankton community dynamic over the time. Thus, the integration of chemotaxonomic and molecular technique, together with light microscopy (with its limits related to the use of fixatives causing cell disruption and the underestimation of the smaller cells), can strongly improve our capability in detecting temporal and spatial dynamics in high productive and dynamic systems such as the MC station. Since many studies have predicted a gradual shift toward smaller primary producers in a warmer ocean (Henson et al., 2021; Morán et al., 2010), the use of this technique represents an important tool in assessing phytoplankton community structure and composition in relation with the ongoing climate changes, improving our capability in describing temporal and spatial pattern as well all as alterations in the carbon sequestration and functioning of oceanic ecosystems. Taken together these results shed light on the complexity of temporal patterns within phytoplankton community, with different subgroups responding in a different way beyond overlapped seasonal scales. Our data highlight the importance of the LTER sites in the ocean monitoring, especially in highly dynamic and impacted coastal area as the Gulf of Naples, representing an important research investment for the near future.
ACKNOWLEDGMENTS
The authors thank Ferdinando Tramontano, Marco Cannavacciuolo, and Gianluca Zazo (SZN) and all the LTER-MC team for collaboration in sampling and data production, and the crew of the R/V Vettoria for assistance during the work at sea. Special thanks go to Imma Santarpia for her teachings and for her great enthusiasm and devotion that she has always shared with everyone. We thank Adriana Zingone and Diana Sarno for sharing phytoplankton counts for a better interpretations of data. We dedicate this work to our dear friend and colleague Cosimo Vestito who left us too soon. Cosimo motivated all of us a lot and contributed to new and brilliant ideas for technological development and the enhancement of the equipment we use.
FUNDING INFORMATION
The research program LTER-MC is supported by the Stazione Zoologica Anton Dohrn.
CONFLICT OF INTEREST STATEMENT
The authors declare no conflict of interest.
Open Research
DATA AVAILABILITY STATEMENT
The datasets generated during and/or analysed during the current study are available from the corresponding author on reasonable request.


