Antiproliferative and apoptosis-inducing effects of aqueous extracts from Ecklonia maxima and Ulva rigida on HepG2 cells
Abstract
This study examined the antiproliferative and apoptotic-inducing effects of Ecklonia maxima (KP) and Ulva rigida (URL) extracts in the human liver cancer (HepG2) cell line model. HepG2 cells were cultured and grown in an incubator (5% CO2) at 37°C. Cell viability was determined, while the effect of the extracts on apoptosis, ROS production, mitochondria membrane potential, and antioxidant enzymes were also assessed. KP and URL induced cytotoxic effects on HepG2 cells at the concentrations tested (0–1000 μg/ml). The morphological characteristics of the cells after treatment with KP and URL revealed cell shrinkage of the nucleus, cell injury, and damage compared to the control. The fluorescent micrographs from the apoptotic assay revealed induction of apoptosis and necrosis in HepG2 cells after treatment with KP and URL (200 and 400 μg/ml). The extracts also induced ROS production and reduced mitochondria membrane potential in HepG2 cells. The apoptotic-inducing effects, activation of ROS generation, and disruption of antioxidant enzymes are associated with the cytotoxic effects of the seaweed extracts. KP and URL showed good anticancer properties and could be explored as a good source of nutraceuticals, food additives, and dietary supplements to prevent uncontrolled proliferation of HepG2 cells.
Practical applications
Seaweeds are reservoirs of nutrients and naturally occurring biologically active compounds, including sterols, phlorotannins, and polyunsaturated fatty acids. Due to the presence of these compounds, they are used as emulsifying agents, nutraceuticals, and additives in functional foods. Evidence suggests that seaweed bioactives may inhibit uncontrolled cell proliferation and induce apoptosis in cancer cells. Hence, exploring the antiproliferative and apoptotic-inducing effects of Ecklonia maxima and Ulva rigida will provide insights into their anticancer potentials as functional foods and nutraceuticals.
1 INTRODUCTION
Marine macroalgae, also known as seaweeds, are commonly used as traditional foods and complementary medicine in many Asian countries (Ganesan et al., 2019). Moreover, the use of seaweeds has gained much more importance across different continents, including Europe, America, and Africa, due to their functional properties. Different species such as the brown, red, and green seaweeds are used as food ingredients and are applied directly or indirectly to food preparations and beverages. Seaweeds contain nutrients including vitamins, minerals, essential trace elements, and dietary fiber and have also been identified as reservoirs of naturally occurring bioactive compounds (Ganesan et al., 2019; Meinita et al., 2022). They are commonly used as animal feeds, additives in functional foods and nutraceuticals. Seaweeds contain different classes of compounds, including phlorotannins (Catarino et al., 2021), sterols (Poulose et al., 2021; Sohn et al., 2021), sulfated polysaccharides (Olasehinde, Mabinya, et al., 2019), carotenoids (Pangestuti & Siahaan, 2018), polyunsaturated fatty acids (Van Ginneken et al., 2011), and proteins (Admassu et al., 2018). These compounds make seaweeds useful as nutraceuticals, food hydrocolloids, emulsifying, and gelling agents in the food industry.
Furthermore, the consumption of seaweeds has been associated with the prevention of some non-communicable and chronic diseases (Admassu et al., 2018; Choudhary et al., 2021). Experimental investigations have also shown that some seaweed species exhibited antidiabetic (Yang et al., 2019), antiviral (Ponce et al., 2003), antiinflammatory (Kang et al., 2008), neuroprotective (Olasehinde, Olaniran, & Okoh, 2019a; Olasehinde et al., 2020), antihypertensive (Maneesh & Chakraborty, 2018) and anti-obesity (Kang et al., 2016) activities. The reports of Ale et al. (2011) and Namvar et al. (2012) also showed that seaweeds inhibited cell proliferation and induced cell death in skin (B16) and breast (MD-MBA- 231) cancer cells.
Uncontrolled cell proliferation is a common pathological event in different kinds of cancer, and the regular consumption of seaweeds has been shown to reduce the risk of some cancers (Teas et al., 2013; Yang et al., 2010). Evidence suggests that some seaweeds exhibit antiproliferative and cytotoxic effects against cancer cells (Lee et al., 2021; Peñalver et al., 2020). However, there is a dearth of information on the antiproliferative effects of brown and green seaweeds on liver cancer. In this study, we investigated the antiproliferative and apoptotic-inducing effects of aqueous extracts from brown (Ecklonia maxima) and green (Ulva rigida) seaweeds against HepG2 cells. Previous studies from our laboratory revealed that these seaweeds contain phlorotannins, flavonoids and phenolic acids, which have been identified as potential anticancer agents. The effect of the aqueous extracts of the seaweeds on cell viability, apoptosis, reactive oxygen species (ROS) production, mitochondria membrane potential and antioxidant defense parameters in HepG2 cells were evaluated in this study.
2 MATERIALS AND METHODS
2.1 Collection of seaweeds, extraction and characterization
Seaweeds were collected, processed for aqueous extraction and characterized as described in our previous study (Olasehinde, Olaniran, & Okoh, 2019c).
2.2 Cell culture
HepG2 cells was received as a gift from Department of Pharmaceutical Sciences, University of Kwazulu-Natal while HT22 cells (hippocampal neuronal cells) was obtained from Salk Institute San Diego CA USA. The cells were cultured in a mixture of fetal bovine serum (10%) (Thermo Fisher Scientific, USA), penicillin and streptomycin (2%) (Thermo Fisher scientific, USA) and Dulbecco's modified Eagle's medium (Fisher Scientific, Norway). Cells were grown in T25 cell culture flasks at 37°C and 5% CO2 in an incubator. After obtaining 75% confluence, the appropriate volume of cells was seeded in each well of 96-well, 24-well and 6-well plates.
2.3 Cell viability assay
Cell viability of HepG2 and HT22 cells with and without the extracts was assessed using MTT (3-[4, 5-dimethylthiazol-2-yl]-2, 5 diphenyltetrazolium bromide) (Sigma-Aldrich, USA) assay. After 100 μl of cells were seeded in 96-well plates and allowed to grow for 24 h, they were treated with different concentrations (0–1000 μg/ml) of seaweed extracts (KP and URL). After the incubation period (48 h), the cells were washed with 100 μl of cold phosphate-buffered saline (PBS) (Thermo Fisher Scientific). Fresh medium (100 μl) was introduced, and 10 uL of MTT (1 mg/ml) was added to each well. The plate was incubated for 4 h for the formation of formazan crystals which were dissolved in dimethyl sulfoxide (100 μl) (Sigma-Aldrich, USA). Percentage cell viability was calculated using the absorbance of the solution obtained from a microplate reader set at 570 nm.
2.4 Morphological studies
The morphological characteristics of HepG2 cells were assessed in treated and control cells. After seeding (2 × 10⁵ cell/well), cells were treated with 200 and 400 μg/ml of KP and URL extracts in different wells of a 6-well plate. Untreated cells were used as the control. The cells were incubated for 48 h, after which the medium was removed. Cells were rinsed with PBS, and morphological features were observed under a Microscope (Olympus Eclipse 80i, Japan).
2.5 Apoptosis assay
Cells grown in a 6-well (2 × 10⁴ cell/well) plate were treated with or without KP and URL extracts 200 and 400 μg/ml in separate wells. The plate was placed in the incubator for 48 h, after which the cells were rinsed with cold PBS. Cells in each well were stained with the mixture (20 μl) of ethidium bromide (100 mg/ml) and acridine orange (Sigma Aldrich, USA) (100 mg/ml) (1:1). Stained cells were viewed using a Fluorescence Microscope with a Nikon camera, and micrographs were obtained to determine levels of cell death.
2.6 Determination of mitochondria membrane potential
HepG2 cells (1 × 10⁴ cells/well) were seeded in 96-well plates and were incubated for 24 h at 37°C and 5% CO2. The medium was removed, and fresh medium was introduced into the wells. The cells were treated with 200 and 400 μg/ml of KP and URL. The treated and untreated cells were incubated for 48 h. The medium was removed and cells were washed with cold PBS. Rhodamine 123 (10 μg/ml) (Sigma Aldrich, USA) was added, and the plate was incubated in the absence of light. After 1 h, fluorescence intensity was obtained using a microplate reader with excitation and emission set at 488 and 525 nm, respectively. Mitochondrial membrane potential was calculated as percentage control.
2.7 Determination of ROS levels
Dichlorohydrofluorescin diacetate (H2DCFDA) (Sigma Aldrich, USA) was used to measure the Intracellular levels of ROS produced in treated and untreated cells. HepG2 cells (1 × 10⁴ cells/well) grown in 96 well plates were treated with 200 and 400 μg/ml of KP and URL extracts in different wells and were incubated. Treatment lasted 48 h, cells were rinsed, and 10 μM H2DCFDA was added to the wells. The plate was placed in the dark for 30 min after which fluorescence intensity of the solutions were measured at 488 nm (excitation) and 525 nm (emission) using a microplate reader.
2.8 Determination of oxidative stress parameters
HepG2 cells were cultured in 24-well (2 × 10³ cell/well) plate and were incubated for 48 h at 37°C and 5% CO2. The cells were treated with 200 and 400 KP and URL extracts as previously described above. After incubation for 48 h, the cells were washed with PBS and detached and lysed using a lysis buffer. Cells from each group were pooled together and placed in 2 ml centrifuge tubes. The tubes were centrifuged at 12,000g. The supernatant was carefully removed using a pipette and were transferred to new labeled tubes. The homogenates obtained were used for further analysis. The total protein content of treated and untreated cells was determined using a BCA assay kit (Thermo Scientific, USA) following the manufacturer's guidelines.
2.9 Catalase activity assay
The catalase activity of the homogenate was determined as reported by Aebi (1984). HepG2 cell homogenates (100 μl) was added to sodium phosphate buffer (pH 7.0, 240 μl, 50 mM) and mixed with 2 M H2O2 (100 μl) was added to the mixture. Absorbance was read at 240 nm for 3 min at 1 min interval. The decomposition of H2O2 was then monitored and calculated as nmol/min/mg protein.
2.10 Assessment of reduced glutathione levels in HepG2 cells
In this assay, glutathione levels were measured by monitoring the oxidation of 5,5′-dithio-bis (2-nitrobenzoic acid) (Ellman's reagent) to 5′-thio-2-nitrobenzoic acid (Ellman, 1959).
Trichloroacetic acid (10%, 100 μl) was mixed with 100 μl of cell homogenates and centrifuged for 5 min at 3500 rpm. Fifty microlitres (50 μl) of Ellman's reagent was added to the supernatant obtained from the solution, and the absorbance was measured in a microplate reader at 415 nm after 5 min. The glutathione levels in the cells were measured and calculated as U/mg of protein.
2.11 Glutathione-S-Transferase (GST) activity assay in cell homogenates
Cell homogenates (50 μl) and glutathione (25 mM, 40 μl) were added to a pre-incubated solution containing 1- chloro-2,4-dinitrobenzene (25 mM, 30 μl), Phosphate buffer (0.25 M, 50 μl, pH 6.5) and distilled water (50 μl) as described by Habig et al. (1974) with slight changes. After 5 min, absorbance was recorded in a microplate reader at 340 nm.
Enzyme activity was measured and calculated as μmol/min/mg protein.
2.12 Statistical analysis
The data obtained from the study were analyzed using one-way analysis of variance (ANOVA) and Tukey post-hoc treatment option in a GraphPad Prism (San Diego, CA, USA) version 8 software package. Significant differences were observed at p < .05 and data was expressed as mean ± SD.
3 RESULTS
3.1 Cell viability
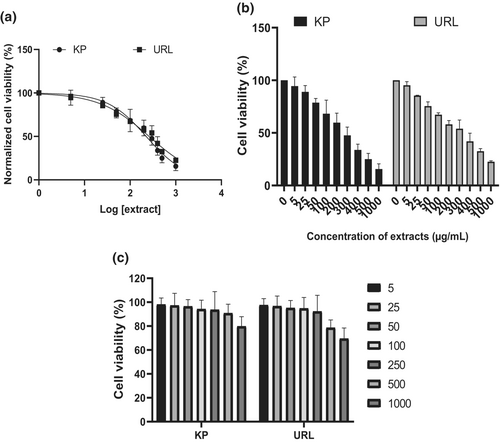
The cytotoxic effect of KP and ULV extracts on HepG2 cells was examined using MTT assay, and the results are shown in Figure 1a,b. The results revealed a dose-dependent decrease in cell proliferation with an increase in the concentration of the extracts after treatment for 48 h. The extracts showed the highest cytotoxic effect at 1000 μg/ml. However, no dose-dependent decrease was observed after HT22 cells were treated with the seaweed extracts as shown in Figure 1c.
3.2 Morphological characteristics
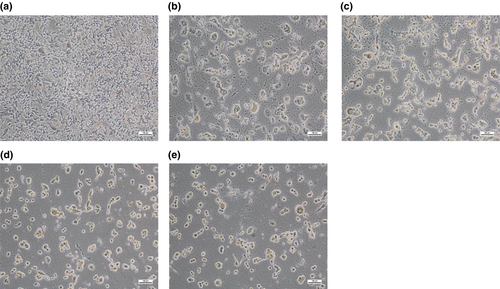
The micrographs in Figure 2 revealed the morphology of the untreated and treated HepG2 cells. The control cells in Figure 2a showed normal cells without changes in their physical characteristics. However, after treatment with KP and URL (200 and 400 μg/ml), significant morphological changes were observed compared to the control (untreated cells), which revealed shrinkage of the nucleus, cell injury and damage as shown in Figure 2b–e.
3.3 Apoptotic-inducing effect of URL and KP against HepG2 cells
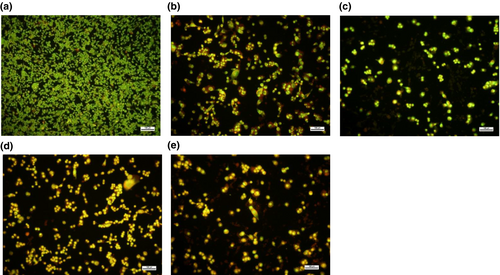
The induction of apoptosis was assessed using the ethidium bromide and acridine-orange dual staining technique. After the cells were treated with the extracts for 48 h, 20 μl of ethidium bromide and acridine-orange were added to the plates containing the treated and untreated cells. The control cells (without extracts) showed green fluorescence, indicating live cells (Figure 3a). Furthermore, cells treated with KP (200 μg/ml) fluoresced green-yellow as shown in Figure 3b. A similar result was obtained after treatment with URL (200 μg/ml) as shown by the bright green-yellow fluorescence, which implies early apoptosis. In Figure 3d,e, micrographs of cells treated with KP and URL (400 μg/ml) showed yellow-orange fluorescence representing late apoptosis. Some necrotic cells were also observed in the fluorescent micrographs in Figure 3d,e, as revealed by the red fluorescence.
3.4 Mitochondrial membrane potential
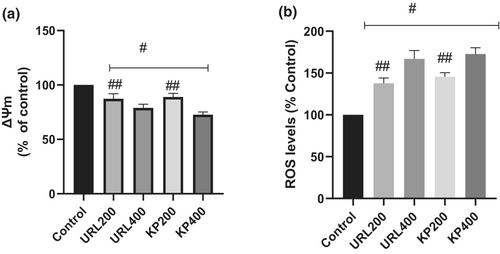
Figure 4a revealed the effect of KP and URL on mitochondrial membrane potential in HepG2 cells. The results revealed that KP and URL reduced mitochondrial membrane potential in HepG2 cells after treatment for 48 h compared to the control. Cells treated with 400 μg/ml of seaweed extracts had lower mitochondria membrane potential than 200 μg/ml.
3.5 ROS production
ROS levels were measured in cells treated with KP and URL and were compared to the control (Figure 4b). After treatment for 48 h, ROS production increased significantly in cells treated with KP and URL compared to the control.
3.6 Effect of seaweed treatment on antioxidant defense system
As shown in Figure 5a, GSH levels significantly reduced after treatment of HepG2 cells with KP and URL for 48 h compared to the control. The levels of GSH in cells treated with 200 μg/ml of KP and URL were significantly lower compared to cells treated with 400 μg/ml of the extracts. Moreover, lower levels of GSH were observed in cells treated with 400 μg/ml KP compared to other extracts.
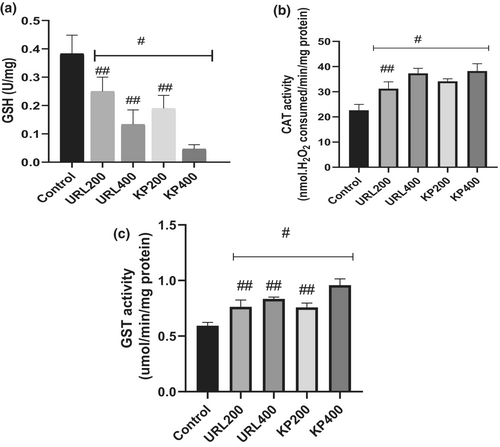
In contrast, catalase activity significantly increased in HepG2 cells after treatment with KP and URL compared to the control (Figure 5b). Catalase activity of KP (400 μg/ml) treated cells was not significantly (p > .05) different from URL (400 μg/ml). However, cells treated with 200 μg/ml of the extracts showed lower catalase activity than those treated with 400 μg/ml of the extracts. Similarly, treatment with KP and URL triggered an increase in GST activity in HepG2 cells compared to the control (Figure 5c). Higher GST activity was observed in cells treated with 400 μg/ml of KP extracts compared to other groups. Moreover, GST activity observed in other groups (KP (200 μg/ml)), (URL (200 μg/ml)) and (URL (400 μg/ml)) were not significantly different.
4 DISCUSSION
Previous reports have shown that consumption of seaweeds may prevent the development of degenerative diseases and reduce their progression (Peñalver et al., 2020; Pereira & Valado, 2021). Seaweeds are functional foods and are a reservoir of naturally occurring biologically active compounds (Pandey et al., 2020). In our previous work on high performance liquid chromatography mass spectrometry (HPLC-MS) characterization of some seaweeds, we reported that E. maxima (KP) contain phlorotannins such as phloroglucinol and other phenolic compounds, including catechin, epicatechin-3 glucoside, rutinose, vulgaxanthin, biochanin A and 1-Caffeoyl-4-deoxyquinic acid (Olasehinde, Olaniran, & Okoh, 2019c). U. rigida (URL) contains Myricetin 3, 7, 3′, 4′, 5′- pentamethyl ether, taxifolin, vulgaxanthin 1, phloroglucinol, catechin and biochanin A. Some of these compounds have been shown to exhibit anticancer activity in different experimental models. Taxifolin exhibited inhibition of cell proliferation and induced apoptosis in breast (MDA-MB-231), liver (HepG2) (Das et al., 2021) and prostate cancer (DU145 and PNT2) cells (Zhang et al., 2013). Moreover, some of these compounds may contribute to the cytotoxic effects of KP and URL against HepG2 cells, which could be via the induction of apoptosis. Our findings revealed that KP and URL inhibited cell proliferation in HepG2 cells and activated apoptosis, as revealed by the fluorescence micrographs obtained from the apoptosis assay. The mixture of acridine orange and ethidium bromide aided the detection of the morphological changes induced by the extracts as revealed by the emittance of green, yellow/orange or red fluorescence. Acridine orange permeates all the cells and emits green fluorescence while ethidium bromide is only taken up by nonviable cells which emits yellow to red fluorescence (Olasehinde, Olaniran, & Okoh, 2019b). Live cells fluoresced green as shown in the control group while early apoptotic cells fluoresced bright green. Furthermore, late apoptotic cells showed yellow and green with condensed chromatin while necrotic cells emitted red fluorescence (Maney & Singh, 2017). In this study, cells treated with 200 μg/ml of KP and URL induced early and late apoptosis as revealed by the bright green fluorescence and yellow-green condensed chromatin. After treatment with 400 μg/ml of KP and URL, late apoptotic and necrotic cells were detected. The induction of apoptosis observed via detection of necrotic and late apoptotic cells correlates with the inhibition of cell proliferation and cell shrinkage, fragmentation of nucleus and cell membrane in the MTT assay and light micrographs.
The ability of KP and URL to reduce changes in mitochondria membrane potential in HepG2 cells may contribute to the observed induction of apoptosis. Impairment in mitochondria function has been identified as an early event in the apoptotic pathway which is associated with an increase in membrane permeability and a decrease in mitochondria membrane potential (Michea et al., 2002). In this study, high mitochondria membrane potential was observed in the control group compared to the treated groups. Common therapeutic agents activate an increase in membrane permeability with a concomitant decrease in mitochondria membrane potential (Costantini, 2000). URL and KP reduced mitochondria membrane potential in HepG2 cells which may induce a disruption in mitochondria membrane, hence inhibiting cell proliferation and causing a release of cytochrome c from the mitochondria into the cytosol (Yaacob et al., 2014). The findings of Pinteus et al. (2017) are similar to our results, which revealed some seaweeds, including Fucus spiralis, Padina pavonica, Sargassum vulgare and Sargassum muticum reduced membrane depolarization in MCF-7 cells.
There are indications that generation of ROS plays a major role in the anticancer effect of biologically active compounds (Khan et al., 2021; Sypniewski et al., 2018). Furthermore, targeting the antioxidant defense mechanism of cancer cells and modulation of excessive ROS generation has also been identified as a therapeutic mechanism for inhibiting uncontrolled cell proliferation (Liu et al., 2014; Wang et al., 2017). ROS are products of aerobic respiration, and they play essential roles in cell signaling and transduction, including cell growth, survival and apoptosis (Meng et al., 2016). However, loss of apoptotic control leads to uncontrollable cell proliferation in cancer cells. The accumulation of ROS may induce cytotoxic effects. High levels of ROS may also induce intracellular signals which in turn triggers the activation of apoptotic pathways (Wang et al., 2017). Our findings revealed that URL and KP induced ROS production in HepG2 cells. A study conducted by Hsu et al. (2017) on the antitumour activity of fucoidan in lung cancer cell lines showed that the sulfated polysaccharide induced ROS generation. The high levels of ROS produced in the treated cells may contribute to the cytotoxic effects of the extracts and activation of apoptotic pathways, which correlates with the late apoptotic and necrotic cells observed in the fluorescence micrographs in this study.
Glutathione imbalance in the cells' antioxidant defense mechanism is dependent on the redox state, which could be due to a response to ROS attack. In this study, depletion of GSH was observed after treatment with URL and KP, which suggests a loss of antioxidant mechanism of the cells and contributes to ROS activation. The reduction of GSH triggered by the treatment with URL and KP may also contribute to the observed necrosis in the treated cells.
Antioxidant enzymes have been identified as the primary defenses of cells against oxidation and free radical attack. Also, redox imbalance, which involves an increase in oxidation or reducing agents, contributes to the reduction of cell growth and apoptosis, which depends on the response, cellular concentration, and expression of antioxidant enzymes. These enzymes play a major role in cancer by preventing DNA damage (Asaduzzaman Khan et al., 2010). Previous report revealed elevated expression of catalase G0/G1 to S-phase transition during cell cycle progression in endothelial cells (Onumah et al., 2009). Furthermore, another study showed that disruption of GST activity contributes to progressive cell proliferation (Prabhu & Bhat, 2007). Our findings revealed a significant increase in CAT and GST activities after treatment with KP and URL. The observed increase in the antioxidant enzyme activity suggests a response to the accumulation of ROS triggered by exposure to URL and KP, which supports the activation of redox imbalance, favoring oxidative stress. An increase in CAT and GST activities was also observed in HepG2 cells in a study reported by Lee et al. (2015) after treatment with dieckol, a phlorotannin present in brown seaweeds. Hence, treatment with KP and URL triggered an increase in antioxidant enzymes, which contributed to the cytotoxic effect of the extracts against HepG2 cells.
5 CONCLUSION
E. maxima and U. rigida extract exert antiproliferative and therapeutic effects in a liver cancer cell model. The antiproliferative and cytotoxic effects of the seaweed extracts may involve impaired mitochondria function, generation of ROS, increase in antioxidant enzymes and induction of apoptosis in HepG2 cells. Our results suggest that the bioactive constituents of the seaweeds may play important roles in the induction of apoptosis and cytotoxic effects against HepG2 cells. The observed antiproliferative effect of the seaweed extracts against HepG2 cells suggests that they could be explored as nutritional or dietary supplements as well as functional foods and nutraceuticals to inhibit and prevent the progression of liver cancer.
AUTHOR CONTRIBUTIONS
Tosin A. Olasehinde: Conceptualization; data curation; formal analysis; investigation; writing – original draft and editing. Ademola O. Olaniran: review and editing.
ACKNOWLEDGMENT
The authors appreciate the support of Technology Innovation Agency of South Africa and South African Biodesign Initiative.
CONFLICT OF INTEREST
Authors hereby declare no conflict of interest.
Open Research
DATA AVAILABILITY STATEMENT
The data that support the findings of this study are available from the corresponding author upon reasonable request.


