Tumour deposits are associated with worse survival than extranodal extension; a network meta-analysis on tumour nodules in colorectal cancer
Abstract
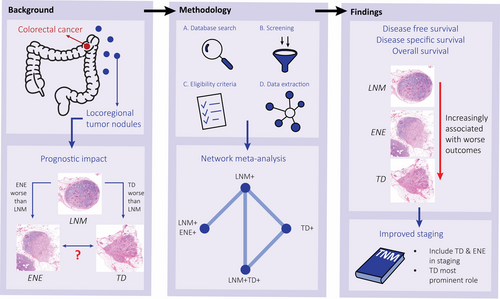
Lymph node metastases (LNM) play a central role in the tumour–node–metastasis (TNM) classification for colorectal cancer (CRC), with extranodal extension (ENE) as an adverse feature. ENE has never been directly compared to tumour deposits (TD). The aim of this study was to perform an up-to-date systematic review, including a network meta-analysis to compare their prognostic value. A comprehensive search was conducted on PubMed, Embase, Web of Science and Cochrane databases to identify all prognostic studies on ENE and TD. A total of 20 studies were included, with 7719 cases. The primary outcome was 5-year disease-free survival (DFS); secondary outcomes were overall survival (OS) and disease-specific survival (DSS). Frequentist paired and network meta-analyses were performed using the netmeta package in R. For univariable DFS analysis, LNM + TD+ cases had a significantly worse outcome compared with LNM + ENE+ cases [hazard ratio (HR) = 1.27, 95% confidence interval (CI) = 1.06–1.53], which was no longer significant for multivariable DFS analysis (HR = 1.13, 95% CI = 0.87–1.46). All OS and multivariable DSS analyses showed a significantly worse outcome for LNM + TD+ cases compared with LNM + ENE cases. For all outcomes, both LNM + TD+ and LNM + ENE+ had a significantly increased hazard compared with LNM+ cases. This study shows that there is a trend towards worse outcome for LNM + TD+ than LNM + ENE+, not statistically significant in multivariable DFS analysis. Both groups perform significantly worse than cases with LNM only. To improve the accuracy of CRC staging, we recommend to put more emphasis on both ENE and TD in the TNM classification, with the most prominent role for TD.
Graphical Abstract
This systematic review compares LNM+, LNM + TD+ and LNM + ENE+ cases using network meta-analyses. As LNM+TD+ has a worse outcome than LNM +E NE+ and both groups perform worse than cases with LNM only, more emphasis on both ENE and TD in the TNM classification is needed, with the most prominent role for TD.
Abbreviations
-
- CRC
-
- colorectal cancer
-
- DFS
-
- disease free survival
-
- DSS
-
- disease specific survival
-
- ENE
-
- extranodal extension
-
- HR
-
- hazard ratio
-
- LNM
-
- lymph node metastasis
-
- LNM+
-
- cases with only lymph node metastases
-
- LNM+ENE+
-
- cases with lymph node metastases and extranodalextension
-
- LNM+TD+
-
- cases with lymph node metastases and tumour deposits
-
- OS
-
- overall survival
-
- TD
-
- tumour deposit
-
- TD+
-
- cases with only tumour deposits
-
- TNM
-
- tumour node metastasis
Introduction
Colorectal cancer (CRC) staging according to the tumour–node–metastasis (TNM) system aids clinicians in prognostic stratification and treatment decisions. Currently, lymph node metastases (LNM) are a central prognostic factor in staging, determining the need for adjuvant treatment.1 However, other histological factors, including tumour deposits (TD) and extranodal extension of LNM (ENE), have also shown significant prognostic value.2-4
TD are defined as isolated tumour cell nodules in the mesocolonic fat without evidence of lymph node tissue, vascular and neural structures.5 Since first described by Gabriel et al. in 1935,6 the prognostic value of TD has been widely established.2, 3 However, TD were only defined as a separate entity in the 7th edition of the TNM with the introduction of the N1c category, deeming them only clinically relevant in the absence of LNM.7 In case of ENE, tumour cells penetrate the nodal capsule and extend into the perinodal tissue. The current TNM classification for CRC does not incorporate the presence of ENE, despite ample evidence of worse survival.4, 8
It has been suggested that ENE is a necessary step in the progression from LNM towards TD.5, 9 Previous studies show the additional prognostic value of both ENE and TD compared with LNM only,3, 4 but it is unclear how the prognostic value of ENE and TD compares. Both are indicative of more aggressive tumour biology. With TD as a possible progression of ENE, they are expected to have more prognostic effect than ENE, but evidence for this hypothesis is lacking.
A more comprehensive understanding of the prognostic value of LNM, ENE and TD in CRC is needed to improve the accuracy of the TNM classification. The lack of a study comparing LNM, ENE and TD could be overcome by a network meta-analysis, which allows for inclusion of multiple studies on different comparisons in a single analysis.10 This study aims to analyse the prognostic value of LNM, ENE and TD in a paired meta-analysis as well as to perform a frequentist network meta-analysis to compare LNM, ENE and TD in a single analysis.
Methods
All analyses in this study were performed according to the Preferred Reporting Items for Systematic reviews and Meta-Analyses (PRISMA) extension statement for network meta-analysis.11 The study protocol was registered in the Prospective Register of Systematic Reviews (PROSPERO-ID: CRD42023470433). The compared groups were cases with only LNM (LNM+), cases with LNM and ENE (LNM + ENE+), cases with TD but no LNM (TD+) and cases with LNM and TD (LNM + TD+).
Literature search, eligibility criteria and data extraction
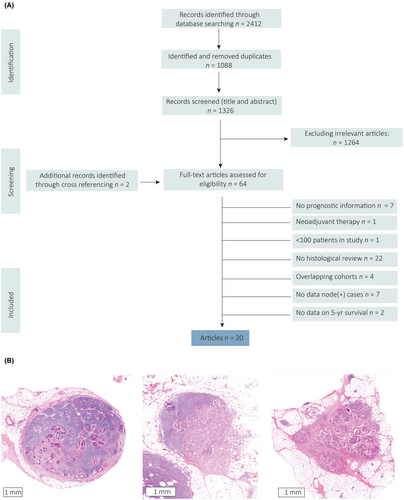
A comprehensive systematic literature search for published studies was performed on 19 October 2023 by using the PubMed, Embase, Web of Science and Cochrane databases. The detailed search strategy is shown in Supporting information, Table S1. Two additional publications were added by manual cross-referencing.
Only original studies published in English with at least 100 patients were selected. In case of overlapping patient data, results of the largest study were included in this meta-analysis. Studies in which histology was not reviewed were excluded, as it is known that the definition of TD is complex and high interobserver variation exists.12 Lack of reassessment of the tumour nodules by an expert pathologist can therefore lead to inaccuracy and bias. Also, those that included only neoadjuvant treated cases were excluded. If studies reported different cohorts based on tumour location (colon or rectum), nodal stage (N1 or N2), or if they included a test and validation cohort, these were separately analysed. Screening of publications was performed independently by two investigators (N.P.M.B. and S.V.) and disagreements were resolved by a third (I.D.N.).
Baseline characteristics and data on 5-year disease-free survival (DFS, the time from diagnosis to recurrence or death), overall survival (OS, the time from diagnosis to death) and disease-specific survival (DSS, the time from diagnosis to death caused by the cancer) were extracted from all studies. Data from both univariable (i.e. only including the presence of tumour nodules, without consideration of other characteristics) and multivariable (i.e. also including other clinicopathological characteristics to correct for their effect) analyses were extracted. If no hazard ratio (HR) was reported, it was extracted from the Kaplan–Meier curves using Parmar estimation.13
Quality assessment
The methodological quality of enrolled studies was assessed by two investigators (N.P.M.B. and S.V.) independently and disagreements were resolved by a third (I.D.N.). Study quality was assessed using a scale designed for the evaluation of histopathological studies.14, 15
Statistical analyses
A conventional random-effects meta-analysis was used to obtain direct estimates between LNM+, TD+, LNM + ENE+ and LNM + TD+ if two or more studies were available, using HR as the effect estimate. The inverse variance method was used, using a restricted maximum-likelihood estimator for τ2 as well as Hartung–Knapp adjustment. The statistical heterogeneity between prognostic effects across studies was assessed using the I2 statistics.16
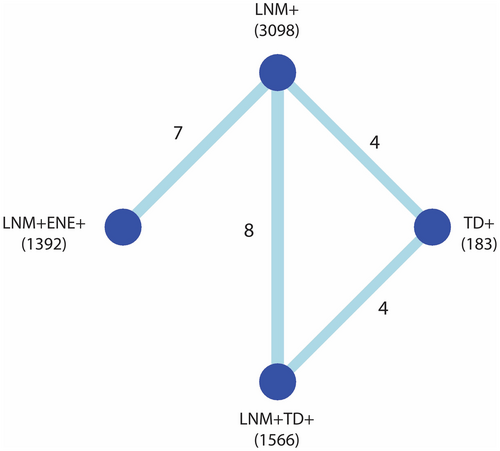
Paired meta-analyses are limited to two groups only. Therefore, a frequentist network meta-analysis was conducted to simultaneously compare the effects of more than two groups. Due to the inherent between-study heterogeneity, a random-effects network meta-analysis was performed to estimate the effects for each pairwise comparison in the network with their 95% confidence intervals (95% CI), using a restricted maximum-likelihood estimator for τ2. By combining direct estimates with indirect estimates, a network meta-analysis yields a mixed effect estimate. An estimate for the indirect HR of LNM + TD+ versus LNM + ENE+ cases can be obtained through the direct comparison of LNM + TD+ versus LNM+ cases and LNM + ENE+ versus LNM+ cases, by calculating the difference in the natural logarithms of the HRs between the two direct comparisons and exponentiating this difference. A network plot was generated to visually display the comparative relationships among the different tumour nodules for the different outcomes. Forest plots showing the direct and indirect results of the network meta-analysis were generated to assess inconsistency and the P-score was analysed to rank the different types of tumour nodules based on their prognostic value.17 The P-score is obtained by estimating the effect sizes of pairwise comparisons and ranks the compared groups with a value between 0 and 1, where a higher P-score means a stronger association with worse survival. Funnel plots were generated to qualitatively evaluate publication bias.
The paired meta-analyses were performed using the meta package, and the network meta-analyses using the netmeta package, both of R software (version 4.3.1).18-20
Results
Study selection, quality assessment and publication bias
A total of 2412 studies were retrieved by the literature search (Figure 1A) and after exclusion of duplicates, title and abstract screening and full article assessment, 20 studies were included (Tables 1 and 2). Examples of the different tumour nodules included in the analyses are shown in Figure 1B. All studies were subjected to quality assessment based on the reporting of predefined items important for histological studies (Supporting information, Table S2). The percentage of reported items ranged from 53 to 87%.
| Author | Year | Country | Rectal cancer cases | Inclusion period | Stages | Selected stages | Total no. of cases | No. selected cases for analyses | No. cases ENE+ (%) | Meta-analysis outcome univariable | Meta-analysis outcome multivariable | |
|---|---|---|---|---|---|---|---|---|---|---|---|---|
| Al Sahaf et al.32 | 2011 | Ireland | 0% | NR | III | III | 194 | 114 | 78 | (68%) | DFS, DSS | DFS, DSS |
| Ambe et al.33 | 2018 | Germany | 31% | 2009–2013 | III/IV (N+) | III/IV (N+) | 147 | 147 | 78 | (53%) | OS | – |
| Brabender et al.34 | 2012 | Germany | 100% | 1997–2007 | I–IV | III/IV (N+) | 231 | 95 | 52 | (55%) | OS | – |
| Kim et al.35 | 2016 | South Korea | 43% | 2005–2010 | III/IV | III/IV (N+) | 419 | 230 | 108 | (47%) | DFS, OS | DFS, OS |
| Kim et al., |colon36 | 2019 | South Korea | 0% | 2003–2011 | III | III | 1363 | 1363 | 551 | (40%) | DF | DFS |
| Kim et al., |rectum36 | 2019 | South Korea | 100% | 2003–2011 | III | III | 983 | 983 | 479 | (49%) | DFS | DFS |
| Komori et al.37 | 2013 | Japan | 100% | 1979–2001 | III | III | 101 | 52 | 19 | (37%) | DFS, OS | DFS, OS |
| Li et al.38 | 2021 | China | 69% | 2014–2018 | III/IV (N+) | III/IV (N+) | 389 | 389 | 244 | (63%) | OS | OS |
| Puppa et al.39 | 2007 | Italy | 0% | 1988–1999 | III/IV (N+) | III/IV (N+) | 228 | 228 | 99 | (43%) | DFS, DSS | DFS, DSS |
| Ueno et al.40 | 1998 | Japan | 100% | 1981–1993 | I–IV | III/IV (N+) | 218 | 93 | 35 | (38%) | OS | – |
| Wind et al.41 | 2008 | Netherlands | 0% | 1994–2005 | III | III | 111 | 111 | 58 | (53%) | DFS | DFS |
- DFS, disease-free survival; DSS, disease-specific survival; NR, not reported; OS, overall survival.
| Author | Year | Country | Rectal cancer cases | Inclusion period | Selected stages | Stages | Total no. of cases | No. of selected cases for analyses | No. of cases TD+ (%) | Meta-analysis outcome univariable | Meta-analysis outcome multivariable | |
|---|---|---|---|---|---|---|---|---|---|---|---|---|
| Al Sahaf et al.32 | 2011 | Ireland | 0% | NR | III | III | 194 | 114 | 33 | (29%) | DFS, DSS | DSS |
| Belt et al.42 | 2010 | Netherlands | 23% | 1996–2005 | III | II/III | 870 | 212 | 43 | (20%) | DFS | – |
| Goldstein et al.43 | 2000 | USA | 0% |
1973–1984/ 1986–1992 |
III | III | 400 | 400 | 89 | (22%) | – | DFS |
| Kim et al.35 | 2016 | South Korea | 43% | 2005–2010 | III/IV (N+) | III/IV | 419 | 230 | 72 | (31%) | DFS, OS | DFS, OS |
| Landau et al.44 | 2019 | USA | 0% | 2011–2013 | III | II/III | 256 | 136 | 48 | (35%) | DFS | DFS |
| Nagayoshi et al.45 | 2014 | Japan | 22% | 1999–2006 | III | II/III | 344 | 172 | 27 | (16%) | – | DFS, OS |
| Puppa et al.39 | 2007 | Italy | 0% | 1988–1999 | III/IV (N+) | III/IV (N+) | 228 | 228 | 100 | (44%) | DFS, DSS | – |
| Qiu et al.46 | 2011 | China | 50% | 2000–2005 | III | III | 1215 | 936 | 167 | (14%) | DFS | DFS |
| Shimada et al.47 | 2010 | Japan | 100% | 2000–2005 | III (N+) | I–III | 214 | 81 | 59 | (73%) | DFS | – |
| Tateishi et al. Colon48 | 2001 | Japan | 44% | 1985–1995 | III/IV (N+) | I–IV | 544 | 97 | 19 | (20%) | DSS | – |
| Tateishi et al. |Rectum48 | 2001 | Japan | 44% | 1985–1995 | III/IV (N+) | I–IV | 544 | 149 | 78 | (52%) | DSS | – |
| Ueno et al.49 | 2014 | Japan | 31% | 1994–1998 | III | II/III | 1716 | 315 | 83 | (23%) | DFS | – |
| Winterfeld et al.50 | 2014 | Germany | 39% | 2003–2007 | III | I–IV | 414 | 134 | 63 | (47%) | – | DFS, OS, DSS |
| Yabata et al.51 | 2014 | Japan | 20% | 2000–2008 | III | I–III | 464 | 170 | 43 | (25%) | OS | OS |
- DFS, disease-free survival; DSS, disease-specific survival; NR, not reported; OS, overall survival.
For all network meta-analyses, the direct and indirect estimates were calculated, and no indication of inconsistency was detected (Supporting information, Figure S1). Publication bias was assessed by generating network funnel plots based on the different survival outcomes, which did not reveal marked asymmetry among the studies, indicating the absence of significant publication bias (Supporting information, Figure S2). Sensitivity analyses were performed for subgroups based on tumour location and geographical origin of the patients but this had no impact on outcome.
Disease-free survival
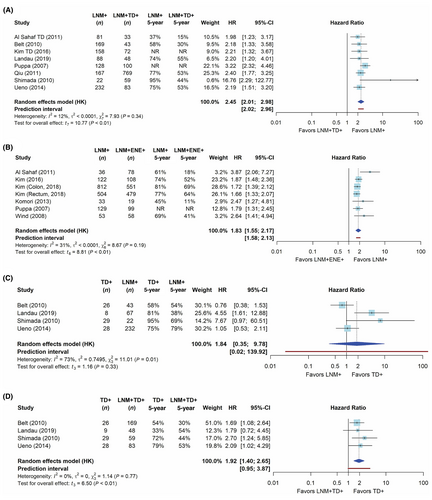
The network of comparisons for the frequentist meta-analysis of univariable DFS is shown in Figure 2; networks for the other outcome measures are provided in Supporting information, Figure S3. The network meta-analysis is based on the direct evidence from the paired analyses. In these analyses, both LNM + TD+ and LNM + ENE+ cases had a significantly worse DFS compared with LNM+ cases with a HR of 2.45 (95% CI = 2.01–2.98, Figure 3A) and 1.83 (95% CI = 1.55–2.17, Figure 3B), respectively. The network meta-analysis yielded a significantly worse DFS for LNM + TD+ compared with LNM + ENE+ cases (HR = 1.28, 95% CI = 1.07–1.54, Table 3). When ranking tumour nodules by prognostic value based on the P-score, LNM + TD+ had the largest impact on DFS (Supporting information, Figure S4).
| Outcomes | Number of cohorts (patients) | Comparison | LNM+ | TD+ | LNM + ENE+ |
|---|---|---|---|---|---|
| Disease-free survival | LNM+: 19 (3098) | ||||
| TD+: 8 (183) | TD+ | 1.04 [0.79–1.37] | – | – | |
| LNM + ENE+: 7 (1392) | LNM + ENE+ | 1.83 [1.64–2.05] | 1.77 [1.31–2.38] | – | |
| LNM + TD+: 12 (1566) | LNM + TD+ | 2.35 [2.03–2.73] | 2.27 [1.74–2.95] | 1.28 [1.07–1.54] | |
| Disease-specific survival | LNM+: 8 (656) | ||||
| TD+: 4 (69) | TD+ | 1.35 [0.72–2.54] | – | – | |
| LNM + ENE+: 2 (177) | LNM + ENE+ | 2.16 [1.10–4.23] | 1.60 [0.64–4.02] | – | |
| LNM + TD+: 6 (275) | LNM + TD+ | 1.96 [1.24–3.09] | 1.45 [0.79–2.66] | 0.91 [0.40–2.04] | |
| Overall survival | LNM+: 8 (755) | ||||
| TD+: 0 (0) | TD+ | – | – | – | |
| LNM + ENE+: 6 (536) | LNM + ENE+ | 2.18 [1.74–2.72] | – | – | |
| LNM + TD+: 2 (116) | LNM + TD+ | 3.97 [2.83–5.59] | – | 1.83 [1.22–2.74] |
- Statistically significant hazard ratios are coloured blue and non-significant hazard ratios are coloured orange.
For the analysis on multivariable DFS, paired analyses show that both LNM + ENE+ and LNM + TD+ cases had significantly worse DFS compared to LNM+ cases with HR of 1.74 (95% CI = 1.22–2.49) and 1.50 (95% CI = 1.25–1.82; Supporting information, Figure S5A). The network analysis resulted in a DFS for LNM + TD+ cases compared to LNM + ENE+ cases, which was not significantly different (HR = 1.13; 95% CI = 0.87–1.46, Supporting information, Table S3).
Disease-specific survival
For univariable DSS, the pairwise analyses showed a worse DSS for LNM + ENE+ and LNM + TD+ cases when compared to LNM+ cases (Figure S5B). High heterogeneity based on the I2 statistic was found for the comparison between LNM + ENE+ and LNM+ cases. The network meta-analysis showed that DSS was not statistically different between for LNM + TD+ cases compared with LNM + ENE+ cases (Table 3).
The multivariable DSS results were in line with the results for DFS and OS, as the network analysis showed a significantly worse DSS for LNM + TD+ cases compared with LNM + ENE+ cases (HR = 1.82; 95% CI = 1.08–3.08, Supporting information, Table S3).
Overall survival
For univariable OS, the pairwise comparisons yielded worse OS for LNM + ENE+ and LNM + TD+ cases compared with LNM+ cases with a HR of 3.97 (95% CI = 2.07–7.65) and 2.21 (95% CI = 1.49–3.28), respectively (Figure S5B). The network analysis showed a significantly worse OS for LNM + TD+ compared with LNM + ENE+ (HR = 1.83; 95% CI = 1.22–2.74, Table 2).
For pairwise comparisons of multivariable OS, a worse OS was found for LNM + ENE+ and LNM + TD+ cases compared with LNM+ cases with a HR of 2.56 (95% CI = 1.98–3.31) and 1.58 (95% CI = 1.07–2.34), respectively (Figure S5C). The network meta-analysis of the multivariable OS data showed a significantly worse OS for LNM + TD+ compared with LNM + ENE+ cases (HR = 1.62; 95% CI = 1.07–2.44; Supporting information, Table S3).
Discussion
Although the presence of both ENE and TD have a strong association with worse survival, they have not been compared or analysed together previously.3, 4 We confirmed that the presence of both TD and ENE leads to worse survival in node-positive CRC. Furthermore, using a network meta-analysis, we also showed that there is a trend towards worse survival for LNM + TD+ cases compared with LNM + ENE+ cases, illustrated by a HR of 1.27 (95 CI = 1.06–1.53) and 1.83 (95% CI = 1.22–2.74) for univariable 5-year DFS and OS, respectively, although this difference was not statistically significant in the multivariable meta-analysis for DFS.
The results from this study are in line with previous systematic reviews that performed paired meta-analyses showing a worse prognosis for TD and ENE-positive cases.2-4, 8, 21 The current study adds to this by including the most recent publications on ENE as well as by indirectly comparing LNM + ENE+ and LNM + TD+ cases. Furthermore, several of the meta-analyses on TD included studies in which the tumour nodules were not histologically revised (reassessing all nodules by an expert pathologist to distinguish between ENE and TD).2, 21 Histological revision is crucial to differentiate between ENE and TD, as it is known that the definition of TD is complex, and the lack of reassessment by an expert can lead to biased results.12 Therefore, revision by an expert pathologist was an inclusion criterion in the current study.
The only study that included data comparing LNM + TD+ with LNM + ENE+ cases was small and did not have this comparison as the main objective. Both groups had significantly worse DFS compared with LNM only, but between LNM + TD+ and LNM + ENE+ cases no significant difference in DFS was found, possibly due to insufficient power.22
The increasingly worse outcome from LNM to ENE and TD could be explained by more aggressive biology and thereby the increased complexity of the shape of these nodules. When tumour cells in LNM grow through the lymphatic capsule and develop ENE, they have acquired characteristics enabling migration through the extracellular matrix and across histological borders, relevant for distant metastasis formation.23 Similarly, TD are characterised by the destruction of histological boundaries. We have previously shown by transcriptome profiling that TD are indeed characterised by a more invasive phenotype (including epithelial mesenchymal transition, invasion and matrix remodelling) compared with LNM.24 This destruction of histological borders causes increasingly complex shapes of tumour nodules with less rounded shapes and more protrusions. Indeed, the complexity of the shape of tumour nodules increases from LNM to ENE to TD. Furthermore, increasingly complex shapes were found to be continuously associated with worse DFS.25 This finding is confirmed by the current study that ranked LNM + TD+ cases as having the worse outcomes, followed by LNM + ENE+ cases and cases with only LNM (Supporting information, Figure S4). However, further research is needed to investigate if this invasive biology, reflected in the more complex shape of ENE/TD, allows the tumour cells in these nodules to directly spread to other organs and form distant metastases, or whether these are merely biomarkers.
The use of a network meta-analysis for histopathological parameters is novel. It enabled us to compare the prognostic value of LNM+, TD+, LNM + ENE+ and LNM + TD+ cases in one single analysis, generating a uniquely comprehensive overview of the prognostic value of different types of tumour nodules in CRC, which was previously limited to paired comparisons. It is important to take some caution when interpreting the results in this innovative approach. Conventionally, network meta-analyses are applied to randomised clinical trials, which are different from the cohorts such as those used in the current study, the most important difference being the more uncontrolled nature of the reference group in histopathological studies. In the current study, LNM+ cases were used as the reference group to link the outcomes of LNM + ENE+ and LNM + TD+ cases. However, the studies that compared LNM + ENE+ with LNM+ cases were uncontrolled for TD prevalence. Therefore, a bias due to higher prevalence of TD in the LNM + ENE+ group is possible, which would enhance its HR. Similarly, the presence of ENE could have biased the results for the LNM + TD+ group, although if these biases are real, then this would mean that the true difference is larger than we estimated. High heterogeneity was found, mainly for DSS, which can be explained by the low number of cases in the included studies, as DSS is an infrequently reported outcome measure.26 Also, it is not possible to compare the results from the network meta-analysis for the comparison of LNM + ENE+ and LNM + TD with a paired meta-analysis, due to the lack of direct evidence for this comparison in the literature. However, the comparisons from the network meta-analyses and their paired meta-analyses in this study were generally in line with each other. Lastly, there is currently no evidence in the literature for the prognostic impact of LNM + ENE+TD+ cases, making it impossible to determine whether the prognostic effects of both ENE and TD are additive. Future research should address this.
Currently, the presence of ENE is not relevant for the final TNM stage of CRC cases and TD are included in the N1c category in the TNM, but only in the absence of LNM, despite their impact on prognosis.1 The results from the current meta-analyses show that both ENE and TD are associated with worse outcomes in the presence of LNM. In several other solid tumours, ENE is recognised as a prognostic factor in the TNM staging system, and we recommend to also include ENE as a prognostic factor in the nodal stage for CRC.1 With regard to TD, their association with poor survival has been widely established, and in this meta-analysis we have shown that LNM + TD+ cases have the worst outcome when compared to LNM+, and even show a trend towards worse outcomes when compared to LNM + ENE+ cases.2, 3, 21 Therefore, we recommend to provide TD with a more prominent position in the nodal stage in the TNM classification and regard them at least as equal, if not more important, than LNM.
When considering how to give TD a more prominent role in nodal staging, it is crucial to address the ‘counting principle’. The current meta-analysis focuses upon a present versus not present comparison, as we are limited by the available literature data. However, the addition of the number of TD added to the number of LNM (i.e. the counting principle) show improved prognostic accuracy.27-29 This was confirmed in post-hoc analyses of clinical trials.30, 31 Therefore, to improve prognostic accuracy TD should be included with LNM count.
In conclusion, this study has found a consistent trend towards worse survival for LNM + TD+ cases compared to LNM + ENE+ cases for DFS, DSS and OS, which was no longer statistically significant in the multivariable meta-analysis for DFS. Furthermore, both LNM + ENE+ and LNM + TD+ cases have worse survival compared with LNM alone. This provides a more comprehensive understanding of how to view the different types of tumour nodules in the context of locoregional spread in CRC. To improve the accuracy of the staging of CRC patients, we therefore recommend to provide a more important role for both ENE and TD in the nodal stage in the TNM classification, with the most prominent role for TD.
Conflicts of interest
The authors declare no conflicts of interest.
Open Research
Data availability statement
Data are available from the corresponding author upon reasonable request.


