Functional Mitral Valve Regurgitation, Pathophysiology, Leaflet ReModeling, and the Role of Imaging
ABSTRACT
Functional mitral regurgitation (FMR) is a complex left ventricle (LV) and left atrium (LA) disorder in which mitral valve regurgitation is just the “tip of the iceberg.” Unlike primary mitral cvalve regurgitation, in which regurgitation occurs due to anatomic abnormalities of the valve itself, the etiology of FMR is multifactorial. Regional and global LV dysfunction, extent and location of fibrotic myocardium (subendocardial/transmural scar), and annulus enlargement are the leading causes of valve regurgitation. A comprehensive understanding of the causes, mechanisms, severity, and clinical consequences of FMVR relies primarily on noninvasive imaging techniques. Echocardiography is the first-line and most commonly used imaging technique. Cardiac magnetic resonance (CMR) has gained growing consensus mainly because it can precisely identify the extent and location of fibrotic myocardium. This review aims to: (a) describe the pathophysiology of the most common phenotypes of FMR, (b) challenge the paradigm that mitral leaflets are structurally normal in FMR, and (c) illustrate the critical role of both echocardiography and CMR in the comprehensive assessment of FMR.
1 Introduction
Unlike degenerative mitral regurgitation, in which regurgitation is caused by anatomical abnormalities of the valve apparatus itself, functional mitral regurgitation (FMR) is an entirely different entity. In this valve disorder, regurgitation can be considered the “tip of the iceberg” or a kind of “collateral damage” of the underlying left ventricle (LV)/left atrium (LA) pathology [1]. Indeed, the mitral valve (MV) apparatus (i.e., leaflets, chordae tendineae, and papillary muscles [PMs]) is so anatomically and functionally integrated into the LV and LA that any anatomical/functional abnormality of these structures will inevitably impact valve function and vice versa in a vicious circle. Regional wall motion abnormalities (WMA) due to myocardial infarction (MI), global LV dysfunction due to idiopathic/ischemic cardiomyopathy, and annulus enlargement due to chronic atrial fibrillation (AF) are the main causes leading to FMR [2].
Severe FMR is associated with poor outcomes. Whether the adverse outcome depends on advanced LV dysfunction, regurgitation severity (through an additional LV volume overload), or both in a vicious circle is still unclear [3]. Yet, clarifying the mechanisms leading to severe FMR impacts therapeutic options. For instance, if the primary disorder is end-stage ischemic/idiopathic cardiomyopathy, valve regurgitation, though severe, can be considered an inevitable “side effect.” In such cases, the benefits of valve repair [either a surgical or percutaneous transcatheter edge-to-edge (TEER) approach] are limited or even non-existent. In contrast, if severe regurgitation is due to a regional dysfunction in otherwise moderately reduced LV function, it can be inferred that FMVR significantly contributes to the patient's clinical status. In such cases, the abolition or reduction of valve regurgitation will likely provide a clinical benefit. The same therapeutic approach should be used in the case of “mixed” pathology, that is, when leaflets, rather than being structurally normal, are thickened and contribute significantly to regurgitation.
A clear understanding of FMR's causes, mechanisms, and severity cannot be achieved without noninvasive imaging techniques. In particular, two-dimensional transthoracic (2D TTE) and transesophageal (2D TEE) echocardiography and, more recently, three-dimensional transthoracic (3D TTE) and transesophageal (3D TEE) echocardiography are the first-line and the most commonly used imaging techniques [4]. In the last decade, cardiac magnetic resonance (CMR) has gained growing consensus, mainly because it can precisely identify the extent and location of fibrotic myocardium [5].
This review aims to: (a) clarify the pathophysiological mechanisms of the most common phenotypes of FMR, namely asymmetric and symmetric tethering patterns, and atrial FMR; (b) challenge the paradigm that mitral leaflets are structurally normal in FMR, playing just a passive “opening/closing” role; and (c) describe the role, but also the limitations, of echocardiography and CMR in the comprehensive assessment of FMR.
2 Pathophysiology of FMR
2.1 Asymmetric and Symmetric Tethering Patterns
The mitral valve allows unrestricted LA-LV inflow in the diastole and perfect leaflet apposition in the systole which avoids even minimal backflow. This sophisticated mechanism is the result of a delicate balance between the closing forces generated by LV contraction, which act on the ventricular surface of the leaflets to ensure effective sealing, and the tethering forces that are exerted on the leaflets through the complex interplay between the LV wall, PMs, and chordae tendineae, which prevent leaflet prolapse beyond the annular plane in systole.
In FMR, this delicate physiological equilibrium is disrupted. Agricola et al. [3] described two distinct mechanisms leading to regurgitation: the asymmetric and symmetric tethering patterns. These patterns can be considered two extremes of a broad spectrum of intermediate stages.
The asymmetric tethering pattern is present in patients with inferior–posterior MI which involves the posteromedial PM. The mechanism of regurgitation consists of a regional remodeling of the infarcted area and posteromedial PM displacement. As a consequence, leaflets are tethered downwards causing regurgitation. In particular, the posteromedial PM is shifted posteriorly, making the anterior leaflet slide up to the level of the midline of the posterior leaflet, creating an image of “pseudo” prolapse. Consequently, the direction of the jet is usually posterior directed to the posterior wall of the LA (Figure 1).
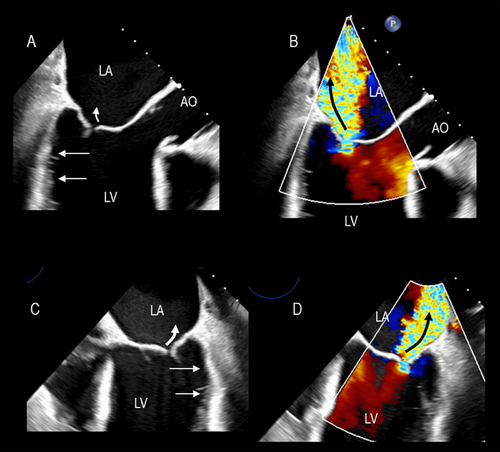
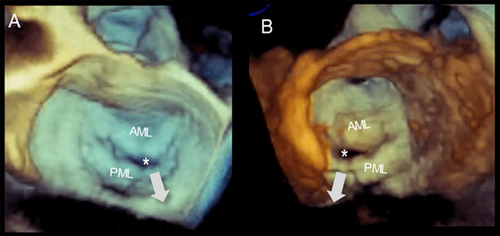
Characteristically, both leaflets are tethered downwards since the chordae arising from the posterior PMs insert into the medial half of the valve. Consequently, the regurgitant orifice is located medially. 3D TEE perfectly illustrates this mechanism (Figure 2).
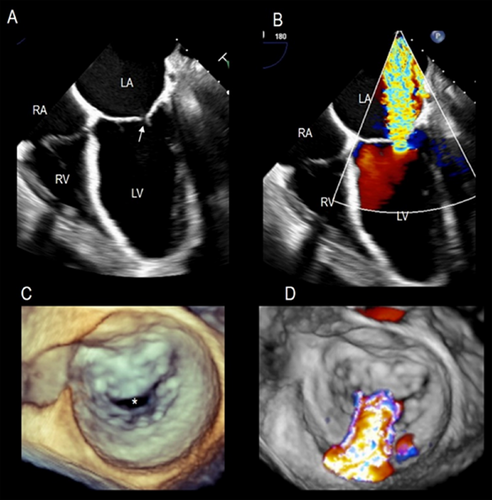
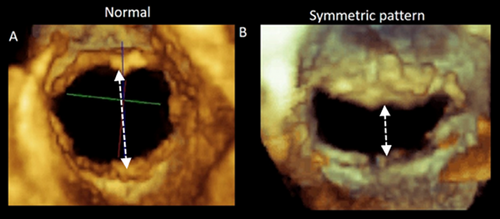
The symmetric tethering pattern is present in patients with a large anterior MI or multiple infarcts. In these patients, the LV remodels and dilates, becoming spherical and hypokinetic (ischemic cardiomyopathy). A similar pattern is found in patients with severe idiopathic dilated cardiomyopathy. The mechanisms of regurgitation are identical in both clinical scenarios. The outward and downward displaced PMs tether the mitral leaflets, causing a gap in leaflet apposition. This gap may extend along the entire coaptation line or be more accentuated in the central part (Figure 3).
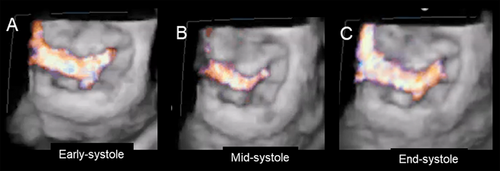
The severity of regurgitation varies through the systole. In early systole, weak closing forces and strong tethering forces tend to increase the time needed for the leaflets to reach their opposition, leading to a significant rise in early systolic regurgitation. In mid-systole, the leaflets reach their maximum possible apposition at the peak of intraventricular pressure and regurgitation diminishes. Finally, at end-systole, regurgitant flow increases when the interventricular pressures are again low (Figure 4).
Interestingly, the tethered leaflets cause restricted systolic motion and impeded diastolic motion. While the former is the leading cause of regurgitation, the latter does not affect the inflow volume or atrioventricular gradient due to the large valve area [6] (Figure 5).
Asymmetric and symmetric tethering patterns are two extremes of a broad spectrum. There is a “continuum” of intermediate stages with various degrees of LV impairment and mitral regurgitation. These intermediate stages depend on (a) the extent and location of underlying LV dysfunction, that is, a sizable posterior-inferior infarction may drag both leaflets downwards, resulting in symmetric tethering, or (b) the variable progression of LV remodeling, that is, progressive deterioration of LV dysfunction and adverse remodeling may shift an asymmetric pattern toward a symmetric pattern.
2.2 Atrial FMR
In patients with long-standing AF, the LA enlarges and undergoes structural remodeling with fibrosis and loss of contractile tissue, eventually resulting in so-called “atrial cardiomyopathy” [7]. The posterior annulus is a variable mixture of fibrous fibers, sparse atrial and ventricular musculature, and epicardial fat. Thus, it is unsurprising that left atrial enlargement may cause annular dilation. The natural redundancy of the mitral leaflets may compensate for small degrees of annular dilation. In contrast, significant annular dilation gradually moves the mitral valve leaflets apart, resulting in inadequate coaptation (Figure 6). Characteristically, these patients have normal or near normal LV volumes and function.
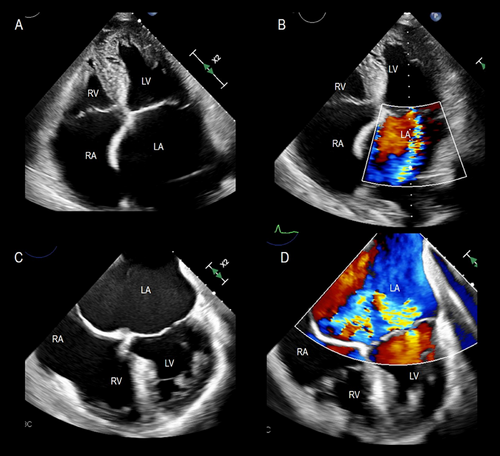
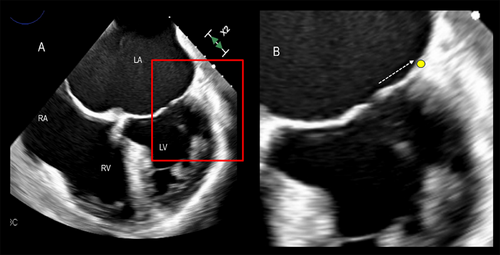
The mechanisms of regurgitation in atrial FMVR are still uncertain. The hinge line of the posterior leaflet slides laterally and anchors to the crest of the LV musculature. This displacement increases the distance between the leaflet insertion and PMs and, as a consequence, drags the posterior leaflet laterally, leading to leakage (Figure 7).
The annular dilation distorts the saddle-shaped configuration, making the annulus flatter. Since the saddle-shaped configuration protects the leaflets from systolic stress by converging the systolic forces on the two trigones the absence of this protective annular shape leaves the leaflets defenseless to the pressure load, likely exacerbating MR and increasing the stress acting on the surface (see the following paragraph Fig. 9).
3 Leaflets Are Not Innocent by Default!
In 2012, Dal-Bianco et al. challenged the long-held idea that MV leaflets are innocent bystanders in the pathophysiology of FMR [8]. The authors demonstrated that mechanical stresses due to leaflet tethering increase the leaflet surface area and spongiosa thickness, with cellular changes suggestive of reactivated embryonic pathways. In other words, adult leaflets maintain a “latent plasticity” that can be reactivated under stress. The authors called this phenomenon active “adaptation.” Though disregarded for several years, the concept that tethered leaflets may increase in size and thickness over time, making long-standing FMR at least in part “organic,” was revolutionary and disrupted the paradigm that leaflets and chordae are structurally normal in FMVR. The term “adaptation,” used by the authors, implies a finalistic mechanism that attempts to compensate for LV dilation and reduce valve regurgitation. Biology does not act according to finalistic processes but to triggers and responses. Insufficient leaflet growth in this setting is, in fact, frequent (thus challenging the term adaptive), and valve regurgitation remains significant in most cases. Moreover, in 2017, Beaudoin et al. [9] showed that histopathological changes in mitral leaflets after MI increased leaflet thickness and stiffness, ultimately increasing MVR by reducing systolic leaflet expansion and flexibility. The authors appropriately coined the term “maladaptive.” Thus, it can be speculated that in the early stages of the disease, the inherent leaflet plasticity leads to a rearrangement that may be considered “adaptive” when the augmented leaflet surface area predominates over leaflet stiffness. Later, excessive leaflet stiffness may prevail over increased leaflet area, becoming “maladaptive,” and worsening valve regurgitation.
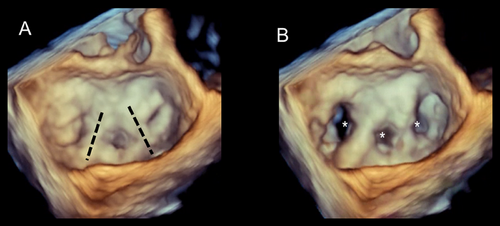
This “maladaptive” excessive leaflet stiffness, when unrecognized, may lead to suboptimal outcomes among patients scheduled for mitral valve transcutaneous TEER repair. Indeed, when the A2 and P2 leaflets are grasped, the flexibility of A1/P2 and A3/P3 scallops is essential to maintain an adequate valve area. The increased A1/P1 and A3/P3 stiffness reduce the residual scallop opening; consequently, the area of the neo-orifices is not large enough and this generates a significant transmitral gradient (Figure 8).
Interestingly, a lack of “adaptation” has been proposed as one cause of the aforementioned atrial FMR [7].
Using computational modeling and computed tomographic (CT) images, our group has shown that in normal subjects, the saddle-shaped configuration of the annulus concentrates the systolic stress peak near the trigones, thereby protecting the leaflets from excessive intraventricular pressure. In dilated cardiomyopathies, with or without valve regurgitation, the annulus is flat, and systolic stress is distributed over its entire surface rather than around the trigones, contributing to reactivation of embryonic pathways, which ultimately leads to an increased mitral leaflet length, area, and thickness (unpublished data) (Figure 9).

It is speculated that these maladaptive leaflet changes can be treated pharmacologically. Whether leaflet area can potentially be modified by a pharmacological approach that acts to modulate beneficial leaflet adaptation and growth versus leaflet fibrosis is a compelling challenge.
4 The Role and Limitations of Echocardiography and CMR
4.1 Echocardiography
2D TTE is typically the first and most commonly used method to assess FMVR [9]. LV volume quantification and evaluation of the severity of valve regurgitation are the main goals of 2D TTE.
4.1.1 Assessment of LV Volumes
Quantifying LV chamber size and function is an essential and routine part of the 2D TTE examination in all settings. The disk summation or modified Simpson rule method is the most extensively used in clinical practice [10]. Although this method is often critical for clinical decision-making, it is subject to significant inaccuracies. The main limitations are (a) the need for geometric assumptions to interpolate cross-sections not intersected by the ultrasound scans and (b) inaccuracies caused by foreshortened views or erroneous border detection. In particular, tracing the border of the LV cavity is challenging and probably one of the significant sources of incorrect measurement and poor reproducibility among users and institutions. It is still unclear whether the borders should be traced following the imaginary line on the peak of the trabeculations or following the compact myocardium. Both methods are, in fact, imprecise. The first includes the spaces between the trabeculations in the myocardium that belong to the blood pool. The second, on the contrary, includes myocardial trabeculations in the cavity. Moreover, while in diastole, the trabeculations are well defined, in systole, myocardial contraction squeezes the intertrabecular spaces and the trabeculations disappear, making the myocardium appear as if it were a wholly compact myocardial mass. These uncertainties in defining the blood/myocardium interface (not completely clarified even by guidelines [10]) make the measurement of the LV cavity with 2D TTE, at the very least, imprecise and poorly reproducible.
3D echocardiography (3D TTE) was thought to overcome most of these limitations. Still, when compared with CMR (the accepted gold standard), the method underestimated volumes because the relatively low spatial resolution did not allow for clear differentiation of the borders of the LV cavity [11].
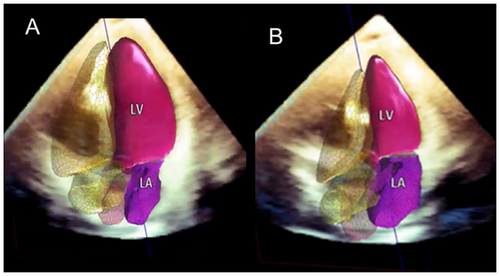
A new generation of fully automated software has been developed for left-heart chamber quantification (HeartModelA.I, Philips Healthcare, Andover, MA, USA) [12] and is currently available in clinical practice. Based on an adaptive analytic algorithm driven by artificial intelligence (AI), this novel technology appears feasible, fast, and reproducible. Quantitative measurements of LV volumes and EF have shown excellent agreement with CMR among patients with different pathologies. Currently, this method represents the state of the art in assessing LV volumes and EF (Figure 10). The most peculiar quality of this novel methodology is that it is highly reproducible with very low interobserver and interinstitutional variability, comparable with CMR [12].
4.1.2 Assessment of Valve Regurgitation
In FMR, assessing regurgitation severity is critical, and defining whether the regurgitation is “moderate” or “severe” is a crucial point in any echocardiography report. “Moderate” regurgitation should be followed regularly, while “severe” regurgitation deserves immediate intensive medical treatment or surgical or TEER repair. The term “moderate to severe” regurgitation should be avoided since it is ambiguous and is the main reason for requesting a “second opinion.”
2D TTE remains the cornerstone for estimating regurgitation severity and evaluating its impact on LA, LV, and systolic pulmonary artery pressure. Currently, the echocardiographic assessment of the severity of MVR relies on a multiparametric approach in which several qualitative and quantitative parameters must be taken into consideration (i.e., valve morphology, color Doppler, PW and CW Doppler, pulmonary venous flow, left ventricular and atrial volumes, etc.). Valve repair/replacement cut-offs are based on 2D TTE/TEE parameters [13].
Proximal isovelocity surface area (PISA) and derived parameters (i.e., effective regurgitant orifice area [EROA] and regurgitant volume [RVol]) are the most commonly used quantitative parameters [14]. However, the PISA method is based on two incorrect assumptions. The first is that to be accurate, it requires circular geometry of the regurgitant orifice and a hemispheric shape of flow convergence. In most cases of FMVR, the geometry of the regurgitant orifice is slit-like and the flow convergence semi-elliptic. The second assumption is based on the fact that regurgitation must be constant throughout the entire systole so that a measurement of a single still frame of PISA is representative of the whole systolic regurgitation. As mentioned above, in FMVR, regurgitant flow is rather dynamic, being more severe in early and late systole and less severe in mid-systole. Moreover, regurgitation is often composed of multiple jets; in such cases, PISA and derivative measurements are less reliable.
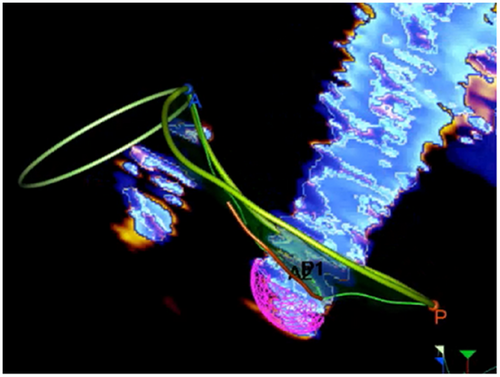
A new system for quantifying FMR has recently become available in clinical practice [15]. This system benefits from the extensive use of AI. A description of the new methodology, called 3D Auto Color Flow Quantification (CFQ) (Philips Research Medisys, Suresnes, France), is beyond the scope of this review. This new algorithm allows quantification in all types of FMVR, including complex cases with slit-like orifices, hemi-elliptical PISA, or multiple jets. Moreover, the method considers the variation of regurgitation through the entire systole. Currently, this methodology applies only to 3D TEE and needs acquiring perfect images of PISA to obtain reliable measurements; moreover, so far, is not extensively validated with other imaging techniques such as CMR. Further validation must involve a large number of patients and several institutions before it can be claimed that Auto CFQ is a real breakthrough in the assessment of FMR (Figure 11).
4.2 Cardiac Magnetic Resonance
Currently, the role of CMR in evaluating FMVR is well established. This technique is the gold standard for cardiac chamber quantification, LV mass, and EF. Moreover, it is regarded as a valuable technique for quantifying valve regurgitation [15]. However, the unique ability of CMR is to accurately assess the extent and location of replacement fibrosis after MI [16, 17].
4.2.1 Assessment of LV Volumes
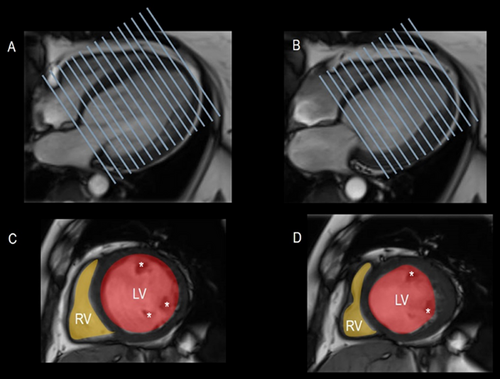
CMR provides accurate and reproducible LV volume and mass measurements using a balanced steady-state free precession (SSFP) sequence. These sequences have a short acquisition time and produce bright blood images with excellent contrast between myocardium and blood. They also provide images with elevated spatial and temporal resolution [16, 17].
As with echocardiography, an essential issue in assessing LV volume is whether or not to include major trabeculations and PMs as part of the myocardial mass. These myocardial structures account for nearly 9% of the total myocardial mass and ideally should be included. Unfortunately, no software package allows inclusion without manual tracing, which is time-consuming, challenging to accomplish, and, more importantly, would increaseinterobserver variability. Thus, in clinical practice, these structures are often included in the blood pool volume, which is acceptable, provided reference ranges of normalcy use the same approach [16, 17].
Contrary to general opinion, CMR has been universally accepted as the gold standard not because of its accuracy in quantifying LV volumes (which gold standard should CMR volumes be tested against to prove that they are accurate?) but because of its consistency. The low interobserver and interinstitutional variability is probably the most valuable quality of CMR (Figure 12).
4.2.2 Scar Burden
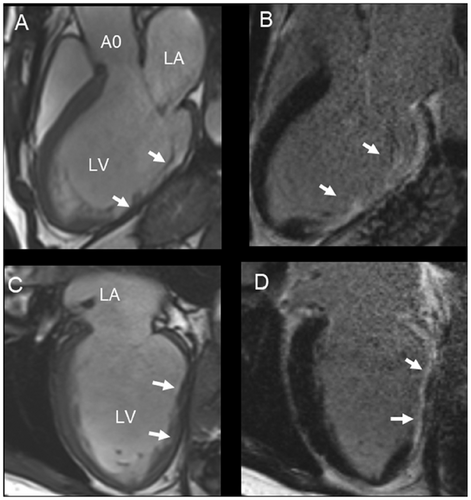
CMR has emerged as a unique technique that provides high-quality images of myocardial fibrosis [18]. It is beyond the scope of this paper to explain the physics behind this process. Normal myocardium, blood, and other tissues have different T1 relaxation times (i.e., the process by which the net magnetization returns to equilibrium [along the x-axis] after a radiofrequency pulse). T1-weighted and late gadolinium (GD) enhancement (LGE) sequences detect these differences visually. These sequences are based on the principle that GD diffuses rapidly out of capillaries into tissues but cannot cross intact cell membranes. After 10–20 min of intravenous injection of a 0.1–0.2 mmol/kg bolus, both normal myocardium and scar tissue accumulate GD. However, the kinetics are slower in scarred tissue and the interstitial spaces are wider than in the densely myocyte-packed myocardium. Consequently, the scarred tissue contains more GD per unit than the compact myocardium. Since GD greatly shortens T1 time on T1-weighted images, scarred myocardium has the shortest T1 time and appears hyperintense compared to the surrounding normal myocardium. A specific MRI sequence called inversion recovery is used as a kind of “image intensifier.” The selection of an adequate inversion time to null the signal intensity from normal myocardium (which therefore appears black) is a critical factor for acquiring diagnostic LGE images. Indeed, the combination of a brighter signal from the myocardial cavity, a very bright signal from the scar tissue, and a null signal from the myocardium makes it possible to obtain a precise distribution of scar tissue and distinguish between endo-, mid-, and epicardial fibrosis (Figure 13). Detecting and quantifying fibrotic tissue (currently, dedicated software is unable to quantify fibrosis within the myocardium) is of paramount relevance since FMR prognosis critically depends on the extent of fibrotic tissue [18]. Myocardial fibrosis is, in fact, one of the most important drivers of outcomes in a population with FMR. Several studies have shown that scar burden allows refining and patient selection for mitral valve interventions. In a setting of FMR, the presence and extension of myocardial scar is, in fact, a marker of residual LV contractile reserve and viability, and therefore a predictor of how the left ventricle responds to post-transcatheter mitral valve interventions [19, 20].
4.3 Assessment of Regurgitation
Cardiac magnetic resonance (CMR) is a versatile imaging technique that can distinguish whether mitral valve regurgitation is organic or functional. It also evaluates the hemodynamic effects of mitral regurgitation on the left ventricle and left atrium. Due to its consistent measurements, CMR is likely the best imaging method for longitudinal studies assessing the progression of regurgitation.
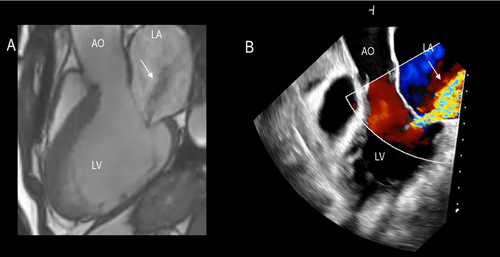
A qualitative, immediate assessment of mitral regurgitation can be performed using standard long-axis steady-state free-precession cine images in four-chamber, two-chamber, or three-chamber views. The flow turbulence of the mitral regurgitation jet causes spin–spin dephasing, which can be visualized as hypointense areas within the jet. This characterization includes determining whether the jet is central or eccentric and classifying it as early, mid, late, or pan-systolic. This assessment closely aligns with the results obtained from 2D transesophageal echocardiography (TEE) color Doppler imaging (Figure 14).
The severity of mitral regurgitation can be evaluated using several CMR-based quantitative techniques. The most commonly used method is 2D phase–contrast flow, which quantifies MR by combining left ventricular (LV) end-diastolic and end-systolic volumes with aortic flow quantification through phase-contrast velocity mapping. The difference between the two LV volumes represents the total LV stroke volume, which includes both the forward stroke volume and the regurgitant volume. Aortic flow quantification enables the calculation of the LV forward stroke volume in the ascending aorta. The difference between the total stroke volume and the forward stroke volume corresponds to the regurgitant volume. This calculation is valid in patients without aortic regurgitation or cardiac shunts. Over the years, several studies have demonstrated that mitral regurgitant volume quantified by CMR is more accurate than that calculated using the PISA method.
Additionally, the emerging technique of 4D phase–ontrast flow allows for the visualization of 2D velocity vectors in any plane, facilitating a comprehensive assessment of blood flow dynamics in the left atrium. This method is particularly useful when the MR jet is swirling within the left atrium, enabling the evaluation of hemodynamic effects on the vessel wall and myocardium.
4.3.1 Limitations of CMR
Several limitations of CMR deserve to be mentioned. First, in patients with MR or AF arrhythmias, the quality of CMR images might be less than optimal, and interpretation of CMR data is challenging. This is important since many patients with FMR develop AF. Second, many patients with FMR and heart failure cannot tolerate the prone position or hold their breath even for a few seconds. Indeed, patients with FMVR undergoing CMR must be well compensated. Third, the magnetic field interacts with ferromagnetic materials which may create dislocation, dysfunction, damage, and heating of ferrous material. Thus, metallic foreign bodies should be permanently excluded before CMR examination. This is a significant limitation with the increasing number of prostheses and metallic materials in patients. In particular, CMR is contraindicated in patients with CMR-non-compatible devices (cardiac pacemakers or cardioverter defibrillators) due to the risk of the abovementioned complications. Moreover, metallic and other electrically conductive medical devices, especially ICD systems, often cause more significant imaging artifacts or total signal void in cardiac images, mainly due to the larger battery. These complications should be taken into account before the patient undergoes CMR. However, many steps forward have been taken to reduce imaging artifacts due to ICD systems. Fourth, a small percentage of patients (<1%) refuse CMR because of claustrophobia. Finally, the CMR examination costs significantly more and takes longer than other imaging techniques.
5 Conclusions
This review explores the pathophysiology of FMR and the critical role of imaging. Without the current imaging techniques, particularly echocardiography and CMR, most knowledge of the mechanisms of FMR and the quantification of volume and severity of regurgitation would be vague and imprecise. However, echocardiography and CMR overlap in many fields, and care must be taken to choose the imaging modality that is the most reliable for the specific purpose and the specific patient to avoid redundant data. In general, when 2D TTE images are of good quality and when the above (or similar) quantitative software based on AI is used, a request for the CMR examination is redundant. Similarly, when mitral regurgitation is accurately assessed by 2D TTE/TEE as being severe, a request for CMR is superfluous. On the other hand, CMR is unique in defining the presence and location of fibrous tissue. In this respect, CMR is complementary to 2D TTE/TEE and should be used in conjunction with echocardiography.
Conflicts of Interest
Francesco F Faletra has received speker fee from Philips.
Open Research
Data Availability Statement
Data sharing not applicable to this article as no datasets were generated or analysed during the current study.


