Gut microbiome as a biomarker for predicting early recurrence of HBV-related hepatocellular carcinoma
Abstract
To investigate the potential of the gut microbiome as a biomarker for predicting the early recurrence of HBV-related hepatocellular carcinoma (HCC), we enrolled 124 patients diagnosed with HBV-associated HCC and 82 HBV-related hepatitis, and 86 healthy volunteers in our study, collecting 292 stool samples for 16S rRNA sequencing and 35 tumor tissue samples for targeted metabolomics. We performed an integrated bioinformatics analysis of gut microbiome and tissue metabolome data to explore the gut microbial–liver metabolite axis associated with the early recurrence of HCC. We constructed a predictive model based on the gut microbiota and validated its efficacy in the temporal validation cohort. Dialister, Veillonella, the Eubacterium coprostanoligenes group, and Lactobacillus genera, as well as the Streptococcus pneumoniae and Bifidobacterium faecale species, were associated with an early recurrence of HCC. We also found that 23 metabolites, including acetic acid, glutamate, and arachidonic acid, were associated with the early recurrence of HCC. A comprehensive analysis of the gut microbiome and tissue metabolome revealed that the entry of gut microbe-derived acetic acid into the liver to supply energy for tumor growth and proliferation may be a potential mechanism for the recurrence of HCC mediated by gut microbe. We constructed a nomogram to predict early recurrence by combining differential microbial species and clinical indicators, achieving an AUC of 78.0%. Our study suggested that gut microbes may serve as effective biomarkers for predicting early recurrence of HCC, and the gut microbial–tumor metabolite axis may explain the potential mechanism by which gut microbes promote the early recurrence of HCC.
Abbreviations
-
- ER
-
- early recurrence
-
- HCC
-
- hepatocellular carcinoma
-
- LEfSe
-
- linear discriminant analysis effect size
-
- n-6 PUFA
-
- n-6 polyunsaturated fatty acid
-
- NER
-
- no early recurrence
-
- OUTs
-
- operational taxonomic units
-
- PCoA
-
- principal coordinates analysis
-
- PICRUSt2
-
- phylogenetic investigation of communities by reconstruction of unobserved states
-
- PLS-DA
-
- partial least squares discriminant analysis
-
- RFS
-
- recurrent free survival
-
- ROC
-
- curve receiver operating characteristic curve
-
- SCFA
-
- short-chain fatty acids
1 INTRODUCTION
Primary liver cancer is the sixth most prevalent malignancy and the third leading cause of cancer-related mortality worldwide.1 HCC is the most prevalent primary liver tumor, accounting for 85%–90% of all liver cancers.2 Chronic hepatitis B virus (HBV) and chronic hepatitis C virus (HCV) infection are responsible for 78% of HCC cases globally, with China being home to more than half of the world's HCC patients.3 Radical resection is the preferred treatment for HCC, but the high postoperative recurrence rate limits patients’ prognosis. In actuality, the cumulative recurrence rate at 5 years after radical hepatectomy ranges from 69% to 75%.4 Recurrence could be classified into early recurrence as well as late recurrence according to the date of postoperative recurrence. Early recurrence is typically defined as recurrence happening within 1 or 2 years after surgery,4-6 while late recurrence occurs 2 years after the operation. Therefore, identifying biomarkers associated with postoperative recurrence is essential to predict the likelihood of postoperative recurrence and guide postoperative therapy decisions for patients.
The gut microbiome, the body's most significant micro-ecosystem, plays a significant role in a number of gastrointestinal and liver diseases, controlling host metabolism, inflammation, and immunity.7 Several studies have shown that the abundance of particular gut microbes is connected with the prognosis of cancer patients, and specific strains of bacteria can be used as biomarkers to predict the outcome and prognosis of cancer patients effectively.8-10 Alterations in gut microbes have been demonstrated to be related to the development and progression of nonalcoholic hepatitis, cirrhosis, and HCC.11, 12 Therefore, gut microbes are expected to be useful noninvasive indicators for predicting the prognosis of HCC.
The gut–liver axis refers to the interplay and communication network between the intestine and the liver, wherein some gut microbiota can influence liver function and metabolism, thus exerting an impact on the occurrence and prognosis of liver cancer.13, 14 Thus, a deeper understanding of the mechanisms underlying the gut–liver axis can aid in predicting the prognosis of liver cancer and developing more effective therapeutic strategies.
This study aimed to examine the gut microbiome of individuals with HBV-associated HCC and control subjects, as well as to explore the relationship between the gut microbiome and postoperative recurrence. In addition, we investigated the tissue metabolomics of HCC patients and identified metabolite patterns that were associated with the early recurrence of HCC. Our study integrated the gut microbiome profile and metabolomics of HCC patients and identified the gut microbiome–liver metabolite axis that was associated with the early recurrence of HCC. Based on these findings, we developed a model for predicting the early recurrence of HCC that incorporated the gut microbiome as a biomarker. The results of our study suggested that the gut microbiome can serve as an effective biomarker for predicting the early recurrence of HCC.
2 MATERIALS AND METHODS
2.1 Study design and sample collection
The research route of this study is shown in Figure 1. This study adhered to the standards of prospective sample collection and blinded evaluation.15 We prospectively collected stool samples from 485 patients with pre-admission imaging findings suggestive of intrahepatic space-occupying lesions at the First Affiliated Hospital of Wenzhou Medical University between March 2019 and December 2021. In total, 145 healthy individuals were recruited from the Physical Examination Center of the First Affiliated Hospital of Wenzhou Medical University to serve as the healthy control group. Additionally, 82 fecal samples from patients with HBV-related hepatitis were obtained from the Department of Infectious Diseases, constituting the second control group. A medical history was obtained from all patients, including tobacco, alcohol, and drug exposure. Fecal samples were collected within the initial two days of patient admission. All patients utilized sterile fecal sampling tubes for self-collection of fecal samples. These samples were promptly transferred to −20°C refrigerators within respective wards, followed by permanent preservation at −80°C. The preservation process entailed no use of preservatives or any other form of treatment. Exclusion criteria for this study were as follows: (1) no radical surgical therapy during hospitalization; (2) pathological findings of nonprimary hepatocellular carcinoma; (3) combination with other malignant tumors; (4) other antitumor treatment before surgery; (5) non-HBV-associated HCC. After removing 327 patients based on the exclusion criteria, 158 patients were included in this study. Following surgery, patients were systematically followed up in our hospital according to the following schedule: outpatient review every month for the first 3 months, outpatient review every 3 months for the next 24 months, and outpatient review every 6 months thereafter. The review included serum AFP, abdominal ultrasound, CT, or MRI.
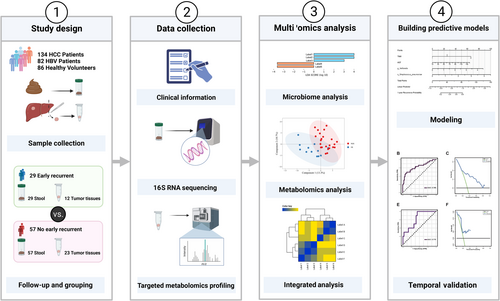
Recurrence of HCC was defined as an increase in serum AFP and the detection of new intrahepatic nodules or extrahepatic metastases with the characteristics of HCC on imaging examination. RFS was defined as the time between the initial operation and the date of confirmation of recurrence. After excluding 34 patients lost to follow-up and those who underwent additional antitumor interventions (interventional therapy, targeted therapy, or immunotherapy) postoperatively, a population of 124 patients was enrolled in our study. Eighty-six patients admitted prior to January 1, 2021 were designated as the training group, while 38 patients admitted from that date onwards were allocated for temporal validation. Meanwhile, 86 healthy volunteers were included in the control group after matching the HCC group for sex, age, and body mass index (BMI). Stool samples were collected from each volunteer. In this study, we define ER as a recurrence that occurs within 1 year.16 Tumor tissue samples were collected from 35 patients during surgery, and all samples were promptly frozen at −80°C.
2.2 Clinical information
Clinical data were obtained from the medical record system for each patient, including gender, age (mean ± SD), presence of cirrhosis, BMI (mean ± SD), Child–Pugh score, surgical procedure performed, length of postoperative hospital stay, and postoperative treatment administered. Blood indicators, including alpha-fetoprotein (AFP), transaminases, low-density lipoprotein (LDL, mmol/L), high-density lipoprotein (HDL, mmol/L), and triglycerides, were also recorded. In addition, pathological data, such as tumor number, tumor size (in cm), and microvascular invasion (MVI) status, were collected.
2.3 16S rRNA sequencing and analysis
The 16S rRNA sequencing analysis service was performed by LC-Bio Technology Co. Detailed information on DNA extraction, PCR amplification and 16S rDNA sequencing, and data analysis is provided in File S1.
Alpha diversity and beta diversity were assessed using the QIIME2 pipeline, and R v3.5.2 was used to generate images. Taxonomy assignment was performed using Blast, with the SILVA and NT-16S databases serving as the alignment databases. LEfSe was used to identify differentially abundant taxa. We employed the Bonferroni correction method to counteract the potential occurrence of type I errors (false positives) resulting from the multiple testing conducted on the multivariate microbiota data. The potential functional content of pathways was predicted using PICRUSt2 based on the Kyoto Encyclopedia of Genes and Genomes (KEGG) database. A clustering correlation heatmap was generated using the OmicStudio tools available at https://www.omicstudio.cn.
2.4 Targeted metabolomics profiling and analysis
The targeted metabolomics profiling of tissue samples was performed by Metabo-Profile. Tissue homogenization, metabolite extraction and derivatization, and quality control are provided in File S2.
The concentration of each analyte in the sample was determined from the raw UPLC-MS/MS data using the iMAP platform (v1.0; Metabo-Profile). PLS-DA was also conducted using iMAP (v1.0). The Z-score specifies the number of standard deviations above or below the mean of the control group observation. We used unidimensional tests (T test or Mann–Whitney U-test, determined by normality and cardinality of the data) to access the differential metabolites between the two groups, and Bonferroni correction was applied to address multiple testing. Pathway enrichment analysis of differential metabolites was conducted using selected pathway-associated metabolite sets (SMPDB) libraries.
2.5 Construction and validation of the gut microbiota-based prediction model
The process of constructing and validating the gut microbiota-based prediction model for HCC recurrence involves several steps. First, univariate Cox regression analysis was performed to identify variables that had a significant association with the recurrence of HCC (p < 0.05). We applied a forward stepwise regression method for adjusting confounding factors in a multifactor regression analysis and, ultimately, variables with p ≤ 0.05 were included in our final predictive model. The variables with p ≤ 0.05 in the multivariate analysis were used to construct the final prediction model, which was represented as a nomogram. The predictive performance and clinical utility of the nomogram were then evaluated using various statistical analyses such as the Harrell consistency index (C-index), ROC curve analysis, calibration curve, and decision curve analysis (DCA). R version 4.0.5 is used for all statistical analyses, and several R packages such as survminer, stdca, survival, ggplot2, forestplot, rms, and timeROC were used to perform the necessary analyses. Ultimately, the goal was to develop a reliable and clinically useful gut microbiota-based prediction model for ER of HCC.
3 RESULTS
3.1 Characteristics of the study population
During the period spanning from March 2019 to September 2021, we enrolled a total of 86 participants with HBV-associated HCC, 86 healthy controls, and 82 HBV-associated hepatitis patients in our study. The baseline characteristics of the study population can be found in Table 1. Of the participants, 29 individuals experienced ER, while 57 experienced NER. No significant differences were observed in gender, BMI, cirrhosis, hypertension and diabetes between the four groups (p > 0.05). No significant differences were observed in aspartate transaminase (AST), alanine transaminase (ALT), albumin, total cholesterol, HDL, LDL, surgical approach, tumor number, tumor size, or differentiation between the ER group and NER group (p > 0.05). However, we did find that the MVI and TNM grades were significantly different between the two groups (p < 0.05).
| Characteristic | ER (29) | NER (57) | Health controls (86) | HBV (82) | p-value |
|---|---|---|---|---|---|
| Age, mean ± SD | 55.76 ± 10.48 | 59.02 ± 11.13 | 55.64 ± 11.95 | 43.695 ± 11.340 | <0.001 |
| BMI, mean ± SD | 22.75 ± 2.84 | 23.45 ± 2.83 | 23.95 ± 2.77 | 23.072 ± 3.225 | 0.148 |
| Gender, n (%) | |||||
| Female | 6 (20.7%) | 10 (17.5%) | 24 (27.9%) | 23 (28.1%) | 0.427 |
| Male | 23 (79.3%) | 47 (82.5%) | 62 (72.1%) | 59 (72.0%) | |
| Cirrhosis, n (%) | |||||
| No | 10 (34.5%) | 11 (19.3%) | 86 (100.0%) | 69 (84.1%) | nan |
| Yes | 19 (65.5%) | 46 (80.7%) | 0 (0.0%) | 13 (15.9%) | |
| TNM, n (%) | |||||
| I | 11 (37.9%) | 40 (70.2%) | 0.005 | ||
| II | 14 (48.3%) | 16 (28.1%) | |||
| 4 (13.8%) | 1 (1.8%) | ||||
| Operation mode, n (%) | |||||
| Open | 25 (86.2%) | 37 (64.9%) | 0.044 | ||
| Laparoscopy | 4 (13.8%) | 20 (35.1%) | |||
| Hypertension, n (%) | |||||
| No | 25 (86.2%) | 40 (70.2%) | 63 (73.3%) | 69 (84.1%) | 0.112 |
| Yes | 4 (13.8%) | 17 (29.8%) | 23 (26.7%) | 13 (15.9%) | |
| Diabetes, n (%) | |||||
| No | 24 (82.8%) | 51 (89.5%) | 73 (84.9%) | 75 (91.5%) | 0.467 |
| Yes | 5 (17.2%) | 6 (10.5%) | 13 (15.1%) | 7 (8.5%) | |
| Smoke, n (%) | |||||
| No | 14 (48.3%) | 31 (54.4%) | 74 (86.0%) | 50 (61.0%) | <0.001 |
| Yes | 15 (51.7%) | 26 (45.6%) | 12 (14%) | 32 (39.0%) | |
| Alcohol intake, n (%) | |||||
| No | 15 (51.7%) | 31 (54.4%) | 66 (76.7%) | 63 (76.8%) | 0.002 |
| Yes | 14 (48.3%) | 26 (45.6%) | 20 (23.3%) | 19 (23.1%) | |
| MVI, n (%) | |||||
| No | 13 (44.8%) | 41 (71.9%) | 0.019 | ||
| Yes | 16 (55.2%) | 16 (28.1%) | |||
| Tumor number, n (%) | |||||
| Single | 25 (86.2%) | 53 (93%) | 0.434 | ||
| Mutiple | 4 (13.8%) | 4 (7%) | |||
| Differentiation, n (%) | |||||
| Low | 12 (41.4%) | 13 (22.8%) | 0.127 | ||
| Middle | 15 (51.7%) | 33 (57.9%) | |||
| High | 2 (6.9%) | 11 (19.3%) | |||
| Child-pugh, n (%) | |||||
| A | 27 (93.1%) | 55 (96.5%) | 0.600 | ||
| B | 2 (6.9%) | 2 (3.5%) | |||
| RFS, median (IQR) | 223 (122, 291) | 581 (493, 716) | <0.001 | ||
| AFP, median (IQR) | 20.19 (5.26, 480.23) | 14.16 (4.71, 224.82) | 0.337 | ||
| ALT, median (IQR) | 35 (22, 55) | 30 (22, 43) | 0.368 | ||
| AST, median (IQR) | 38 (27, 61) | 32 (27, 44) | 0.137 | ||
| Albumin, mean ± SD | 39.62 ± 4.01 | 39.96 ± 3.7 | 0.702 | ||
| Total bilirubin, median (IQR) | 13 (9, 17) | 10 (8, 15) | 0.086 | ||
| Triglyceride, median (IQR) | 0.99 (0.89, 1.67) | 1.25 (0.91, 1.8) | 0.435 | ||
| Total cholesterol, median (IQR) | 4.81 (4.01, 5.35) | 4.54 (3.84, 5.08) | 0.371 | ||
| HDL, mean ± SD | 1.11 ± 0.3 | 1.06 ± 0.25 | 0.354 | ||
| LDL, median (IQR) | 2.61 (2.12, 3.37) | 2.6 (2.18, 2.97) | 0.953 | ||
| Maximum diameter, median (IQR) | 3.5 (2.5, 5.5) | 3.5 (2.5, 5.5) | 0.938 | ||
- Abbreviations: AFP, alpha-fetoprotein; ALT, alanine aminotransferase; AST, aspartate aminotransferase; ER, early recurrence; HDL, high-density lipoprotein; IQR, interquartile range; LDL, low-density lipoprotein; MVI, microvascular invasion; NER, no early recurrence; SD, standard deviation.
3.2 Microbiota profile of healthy control, HBV-associated hepatitis patients, ER groups, and NER groups
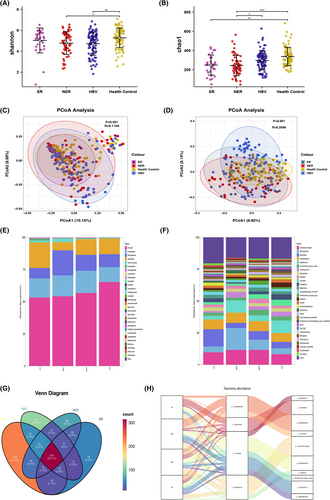
The study compared the microbiota profile of healthy controls, HBV-associated hepatitis patients, ER, and NER groups. Alpha diversity, as measured by the Shannon and Chao1 indices, was significantly different between the HCC and healthy control groups (Figure 2A,B). However, there were no significant differences in alpha diversity between the ER group and the NER group. Similarly, no notable distinctions in alpha diversity were observed between the HBV group and either the ER or NER group (Figure 2A,B). Beta diversity, as analyzed by nonweighted PCoA, showed significant differences between the four groups (Figure 2C,D). The taxonomic profiles of the four groups were also examined at different levels (Figure 2E,F). Firmicutes, Bacteroidota, Proteobacteria, and Actinobacteriota were the major phyla in all four groups. Firmicutes was the predominant phylum in the ER group and least abundant in the healthy control group (Figure 2E). At the genus level, Escherichia–Shigella, Bacteroides, Faecalibacterium, Bifidobacterium, and Streptococcus were the major genera in all four groups (Figure 2F). The abundance of Bacteroides was relatively high in the healthy control group but relatively low in the other groups. Additionally, the relative abundance of Bacteroides was lower in the ER group than in the NER group, while the relative abundance of Streptococcus was higher in the ER group than in the NER group. Venn diagrams were used to show the shared and unique amplicon sequence variants among the ER, NER, HBV and healthy control groups (Figure 2G). Sankey diagrams were employed to illustrate the main proportions of phyla and genera in the four groups, as well as the variations of different species under different classifications (Figure 2H).
3.3 Certain gut microbes are linked to postoperative recurrence
To determine the gut microbiota associated with ER, we performed a LEfSe analysis. The results showed that, at the genus level, Dialister, Veillonella, Eubacterium coprostanoligenes group (E. coprostanoligenes), and Lactobacillus were significantly increased in the ER group while, at the species level, Streptococcus pneumoniae and Bifidobacterium faecale were also significantly increased in the ER group (q-value < 0.05) (Figure 3A). The abundance differences of these six taxa were displayed in the mountain plot (Figure 3B). Figure 3C–H displayed the difference in abundance of Dialister, Veillonella, Eubacterium coprostanoligenes group, Lactobacillus, Streptococcus pneumoniae, and Bifidobacterium faecale between the two groups.
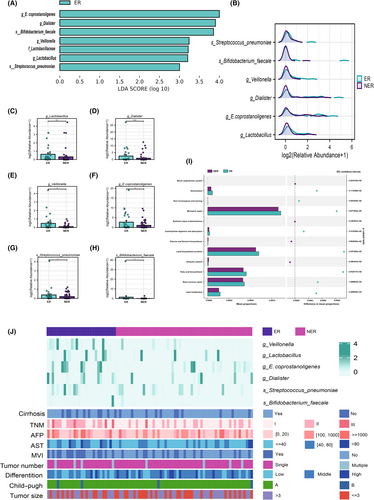
To further investigate the potential roles undertaken by the diverse bacteria, we used PICRUSt2 to compare genomic data with the KEGG database. The results showed that fatty acid biosynthesis, lipid metabolism, lipid biosynthesis proteins, and carbohydrate digestion and absorption were overrepresented in the ER group, indicating that the microbiota of the ER group possessed stronger energy conversion ability and fatty acid and lipid synthesis capacity. Furthermore, we compared the microbiota data of the ER group and NER group with clinical variables. The heatmap showed that Dialister, Veillonella, Eubacterium coprostanoligenes group, and Lactobacillus were significantly enriched in the ER group, which had higher TNM stages and higher rates of microvascular invasion (Figure 3K). These findings suggested that these gut microbes may contribute to the development of ER after surgery.
3.4 Analyses of tissue metabolomes identify recurrence-related metabolites
The study conducted targeted metabolomic analyses on 35 hepatocellular carcinoma (HCC) tissues from the study cohort and identified 178 metabolites, mainly comprising bile acids, organic acids, fatty acids, amino acids, carnitines, SCFAs, and carbohydrates (Figure 4A). Partial least squares discriminant analysis (PLS-DA) showed a certain trend of separation between the ER and NER groups (Figure 4B). To further identify metabolic variations between the ER and NER groups, we identified 23 differential metabolites, including acetic acid, arachidonic acid, proline, glutamate, and ornithine, all of which were in high abundance in the ER group (Mann–Whitney tests, or t test, p-value < 0.05, q-value < 0.25) (Figure S1). To visualize the variation trends of differential metabolites, we also performed z-transformation of differential metabolites and visualized them using a heatmap that displayed the z-scores of the metabolites in each sample (Figure 4C). Seven amino acids, 11 fatty acids, and a few SCFAs, indoles, organic acids, peptides, and phenylpropanoic comprised the majority of the 23 distinct metabolites. One of the SCFAs, acetic acid, was significantly enriched in the ER group. Pathway analysis revealed that the ER group was enriched in the metabolic pathways of linolenic acid metabolism, glutathione metabolism, aspartate metabolism, propanoate metabolism, arginine and proline metabolism, and the urea cycle (Figure 4D).
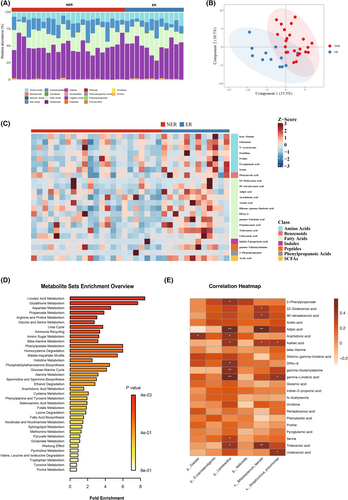
The study investigated whether gut microbiota mediated HCC progression via their derivative metabolites. Spearman's correlation analysis on differential taxa and metabolites identified 20 significantly positively correlated differential species-metabolite pairs, including Lactobacillus with arachidonic acid, gamma-linolenic acid, and DPAn-6, Dialister with arachidonic acid, and Streptococcus pneumoniae with azelaic acid and gamma-linolenic acid. Although there was a positive correlation trend between the abundance of six differential taxa and acetic acid, no significant correlation was observed.
3.5 Development and validation of a gut microbiome-based prediction model
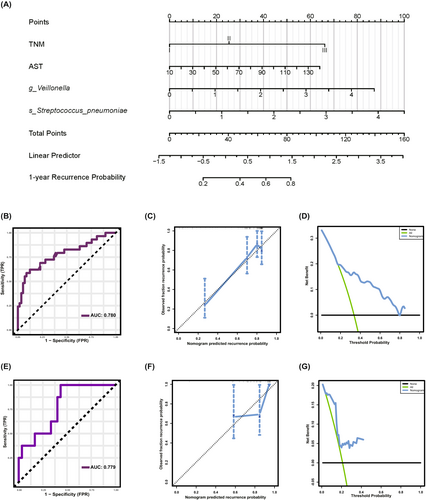
To further investigate the relationship between differential taxa and HCC prognosis, we conducted Kaplan–Meier survival analyses, which showed that high abundance of Dialister, Veillonella, Lactobacillus, Streptococcus pneumoniae, and Bifidobacterium faecale were significantly associated with poor RFS (Figure S2A–F). Next, we attempted to develop a prediction model for recurrence based on the gut microbiome. Initially, we performed univariate Cox regression analyses on the six differential microbial genera and 24 clinical indicators. We selected variables with significant findings (p < 0.05) for inclusion in the subsequent multivariate regression analyses. We employed a forward stepwise regression method for multifactor regression to adjust for confounding factors. Ultimately, variables with a p-value less than 0.05 were included in the final predictive model. The forest plots illustrate the results of the univariate and multivariate regression analyses (Figure S2G,H). The multivariate identified four independent prognostic indicators for ER prediction: TNM, AST, Veillonella, and Streptococcus pneumoniae. Based on these results, we developed a nomogram for postoperative recurrence prediction using outcomes from the multivariate Cox regression analysis (Figure 5A). The nomogram demonstrated excellent performance with a C-index of 0.730 (95% confidence interval: 0.681–0.779). ROC curve analysis was utilized to evaluate the predictive value of the model, with the area under the curve (AUC) being 78.0% for ER (Figure 5B). The calibration curve revealed good agreement with the 1-year recurrence probability (Figure 5C). Additionally, a DCA was carried out to measure the net benefits based on various threshold probabilities to determine the clinical value of the nomogram (Figure 5D). The nomogram underwent temporal validation in an independent cohort of 38 patients admitted to the hospital after January 1, 2021, resulting in an AUC of 77.9% (Figure 5E). The calibration curve and DCA curve demonstrated that the model exhibited favorable calibration in the validation set and achieved a substantial net benefit (Figure 5F,G). In conclusion, we developed a predictive model for ER of HCC based on the gut microbiome, which demonstrates strong predictive performance and generates positive net clinical benefit.
4 DISCUSSION
Radical surgical resection is the therapy of choice for HCC; however, postoperative recurrence and metastasis are the primary determinants of patients' prognoses. Recurrence can be categorized into early and late recurrence based on the time to recurrence (TTR) after surgery. However, the definition of early and late recurrence remains controversial. While some studies define recurrence within 2 years after surgery as ER, others have used shorter TTRs, such as 1 year or even 6 months.16-19 In this report, we define ER as a recurrence that occurs within 1 year.16
In our study, we identified six differential taxa, including Dialister, Veillonella, Eubacterium coprostanoligenes group, Lactobacillus, Streptococcus pneumoniae, and Bifidobacterium faecale, whose abundance was elevated in the ER group by comparing the preoperative stool microbiome of postoperative patients with and without ER of HCC. Dialister, a genus within the phylum Firmicutes, produces variable amounts of acetic acid, lactate, and propionate as its metabolic end products.20 Previous studies have shown that the abundance of Dialister was markedly higher in HCC patients with cirrhosis than in patients with cirrhosis alone,12 suggesting that gut Dialister abundance may be related to the course of the liver disease–cirrhosis–hepatocellular carcinoma pathway. The Eubacterium coprostanoligenes group is an anaerobic Gram-positive coccus that degrades cholesterol, with metabolites including acetic acid, formic acid, and succinic acid. Veillonella is a common Gram-negative anaerobic micrococcus found in the mouth cavity and intestine,21 which can utilize lactic acid to create propionate and acetic acid.22 Wang et al. found that Lactobacillus reuteri regulates type 3 innate lymphoid cells (ILC3s) in HCC through acetic acid.23 Bifidobacterium faecale uses the fructose 6-phosphate pathway as the main pathway of carbohydrate metabolism, with acetic acid, lactate, and ethanol as the final metabolites.24 In conclusion, all four genera and one species we identified could produce acetic acid. We used PICRUSt2 analysis to investigate the metabolic pathways of the gut microbiota and found that the gut microbiota of the ER group had a higher capacity for lipid biosynthesis proteins, fatty acid biosynthesis, and lipid metabolism, with short-chain fatty acids (SCFAs) being the most important type of fatty acid synthesized by the gut microbiota.25 Microbial-derived short-chain fatty acids in the gut can directly provide energy to host cells26 and, therefore, we speculate that the gut microbiota may mediate tumor recurrence by generating more SCFAs to provide energy for tumor growth. Our metabolomic analysis confirmed this hypothesis, as we found that the ER group had higher levels of acetic acid content in the tumors. Acetic acid is a short-chain fatty acid that plays a crucial role in various physiological processes, and intestine microbial-derived acetic acid is a significant source of exogenous acetic acid in the human body.26 Similar to other SCFA, acetic acid is absorbed by the intestine and transported to the liver via the portal vein.27, 28 Numerous studies have demonstrated that acetic acid drives a variety of tumor metabolic pathways,29-31 and tumor cells exhibit an overexpression of transporter proteins and enzymes associated with their acetic acid use processes.32-34 Bjornson et al. discovered that the expression of mitochondrial acetyl-CoA synthetase (ACSS1), an enzyme that provides energy to cancer cells by converting acetic acid to acetyl coenzyme A, was dramatically elevated in HCC.35 In addition, mitochondrial acetic acid is a substrate for fatty acid production and plays a key role in the growth and proliferation of HCC, and the uptake of cellular acetic acid is substantially associated with the malignancy of HCC.35 Given the results of the aforementioned studies, we propose the hypothesis that gut bacterial derivative acetic acid enters the liver through the portal vein to provide energy for growth (Figure 6).
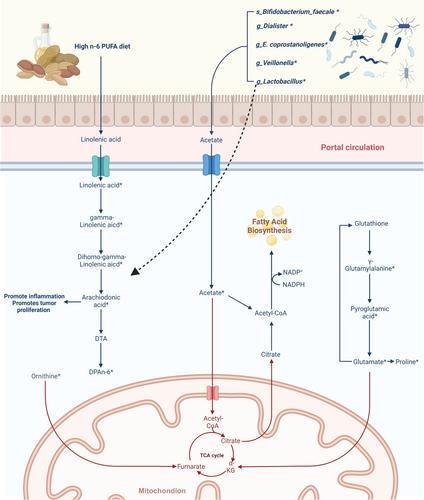
Our targeted metabolomic analysis of HCC tumor tissues revealed the enrichment of n-6 PUFA, including linoleic acid, gamma-linolenic acid, dihomo-gamma-linolenic acid, arachidonic acid, and DPAn-6, in the ER group of tumor tissues. Furthermore, we observed an association between Lactobacillus and the abundance of arachidonic acid, DPAn-6, and gamma-linolenic acid, indicating that Lactobacillus is involved in hepatic linoleic acid metabolism. The metabolic derivatives from n-6 PUFA are known to have proinflammatory effects,36 and studies have demonstrated that arachidonic acid derivatives, such as PGE2, PGF2α, and TxB2, can promote HCC cell proliferation and metastasis.37, 38 In conclusion, the above-mentioned studies and the results of our analysis suggest that enhanced metabolic pathways of n-6 polyunsaturated fatty acid are associated with a poor prognosis in HCC and that Lactobacillus is related to the metabolism of n-6 PUFA (Figure 6).
Several independent risk factors for HCC recurrence, such as tumor size, microvascular tumor invasion, tumor number, and higher preoperative AFP values, have been established. Prognostic prediction models based on these clinical characteristics have been extensively published.39 However, few studies have investigated the relationship between gut microbiota and ER of HCC, and predictive models for HCC recurrence based on gut microbiota have not been developed. Studies have demonstrated that gut microbiota have a substantial effect on the treatment outcome and overall survival of cancer patients. For instance, Huh et al. identified four microbes associated with colorectal cancer prognosis by analyzing the preoperative stool microbes of colorectal cancer patients and constructed a risk-scoring system based on gut microbes, which can accurately predict the prognosis after colorectal cancer surgery.9 Similarly, Derosa et al.40 discovered that gut Akkermansia muciniphila abundance was associated with the clinical efficacy of PD-1 inhibitors in patients with non–small-cell lung cancer. As ER accounts for more than 70% of HCC recurrence,41 we focused our study on the impact of gut microbiota on ER of HCC. In this study, we developed a predictive model for ER of HCC based on gut microbiota. Our model showcased exceptional predictive prowess, achieving an AUC of 0.780. Furthermore, it sustained its performance in the validation cohort, with an AUC of 0.779. This model could assist surgeons in making treatment decisions.
Compared with liquid biopsy, stool samples are easier to collect and can be collected noninvasively by patients themselves, without technology barriers. Therefore, this model has high clinical application value.
Our study has several limitations. First, the cohort was small, cross-sectional, and conducted in a single center. We did not track the dynamic changes of gut microbes in patients with HCC after surgery, and we did not validate our findings in a multicenter cohort. Second, although we were able to test the fecal microbiome of 86 patients with liver cancer, only 35 matched tissue samples were available, which limits the reliability of our results. Despite these limitations, our study provides valuable insights into the relationship between gut microbiota and ER of HCC and highlights the potential for gut microbiota-based predictive models in clinical practice.
In summary, our study suggests a correlation between specific gut microbiota and poor prognosis in HBV-related HCC, possibly facilitated by the entry of gut microbiota-derived acetic acid into the liver through the gut–liver axis, which may support tumor growth. We have developed a gut microbiota-based model for predicting ER of HCC. The model was evaluated in the validation cohort, showcasing the marked potential of gut microbiota in predicting HCC recurrence. These results highlight the potential significance of the gut–liver axis in the pathogenesis and progression of liver cancer, emphasizing the importance of targeting the gut microbiota as a potential therapeutic strategy in the treatment of liver cancer. Our research provides a new perspective on the role of the gut microbiome in HCC treatment, but larger scale studies are needed to validate our findings.
AUTHOR CONTRIBUTIONS
Chongming Zheng: Data curation; formal analysis; methodology; visualization; writing – original draft. Fei Lu: Data curation; resources; validation. Bo Chen: Validation; visualization. Jinhuan Yang: Formal analysis; resources. Haitao Yu: Formal analysis; resources. Daojie Wang: Methodology. Haonan Xie: Resources. Kaiwen Chen: Resources. Yitong Xie: Data curation. Jiachen Li: Software. Zhiyuan Bo: Software. Yi Wang: Methodology; software. Gang Chen: Funding acquisition; investigation; project administration; resources; supervision; writing – review and editing. Tuo Deng: Funding acquisition; project administration; resources; writing – review and editing.
ACKNOWLEDGMENTS
The authors thank the volunteers who participated in the study.
CONFLICT OF INTEREST STATEMENT
The authors declare no conflict of interest.
ETHICS STATEMENT
Approval of the research protocol by an Institutional Reviewer Board: the study protocol was approved by the Ethics Committee of the First Affiliated Hospital of Wenzhou Medical University (reference number 2020-074).
Informed Consent: All participants provided written informed consent.
Registry and the Registration No. of the study/trial: N/A.
Animal Studies: N/A.
CONSENT FOR PUBLICATION
All authors have read the manuscript and agreed to its publication.
Open Research
DATA AVAILABILITY STATEMENT
The datasets generated during and analyzed during the current study are not publicly available due to participant privacy issues but are available from the corresponding author upon reasonable request.


