Chemokine (C-X-C motif) ligand 1 and CXCL2 produced by tumor promote the generation of monocytic myeloid-derived suppressor cells
Abstract
Accumulation of myeloid-derived suppressor cells (MDSC) in tumor-bearing hosts is a hallmark of tumor-associated inflammation, which is thought to be a barrier to immunosurveillance. Multiple factors secreted by tumor cells and tumor stromal cells are reported to be involved in promoting the expansion of MDSC. Herein, we showed that s.c. inoculation of tumor cells and i.v. injection of tumor-conditioned medium increased the number of MDSC. Subsequent investigation elucidated that chemokine (C-X-C motif) ligand 1 (CXCL1) and CXCL2, which were originally characterized as the chemokines of neutrophils, specifically promoted the expansion of monocytic MDSC (mo-MDSC), a subtype of MDSC, in the presence of granulocyte-macrophage colony-stimulating factor. Depletion of CXCL1 or CXCL2 in B16F10 cells or in B16F10-bearing mice noticeably decreased the generation of mo-MDSC in bone marrow. Moreover, we found that, in addition to the tumor cells, tumor-infiltrated CD11b+ myeloid cells also expressed CXCL1 and CXCL2. Furthermore, CXCL1- and CXCL2-induced increase of mo-MDSC was not correlated with chemotaxis, proliferation or apoptosis of mo-MDSC. These findings show a novel role of CXCL1 and CXCL2 in promoting mo-MDSC generation by favoring the differentiation of bone marrow cells in tumor-bearing conditions, which suggests that inhibition of CXCL1 and CXCL2 could decrease mo-MDSC generation and improve host immunosurveillance.
1 INTRODUCTION
Tumor progression is often accompanied by host inflammatory responses.1 Although the prevailing theory holds that the immune system exerts immunosurveillance to eliminate malignant tumor cells, the tumor often uses the host immune system for its own purpose.2 During tumor progression, tumor-associated changes in myelopoiesis are considered a significant barrier to immunosurveillance. Disrupted myelopoiesis results in excessive expansion of myeloid-derived suppressor cells (MDSC) in tumor-bearing hosts, which protect the tumor cells from immunosurveillance.3 Of note, in pathological conditions, multiple immunosuppressive factors in MDSC are upregulated, such as reactive oxygen species (ROS), arginase 1 and inducible nitric oxide synthase (iNOS), which lead to suppression of T-cell function.3, 4 In addition to immunosuppression, MDSC are also reported to promote tumor metastasis by constructing a premetastatic niche.5 MDSC are a heterogeneous population consisting of myeloid progenitor cells and immature myeloid cells. In mice, the phenotype of MDSC is CD11b+Gr1+, which is further subdivided into two subtypes: monocytic MDSC (mo-MDSC), with a phenotype of CD11b+Ly6C+, and granulocytic MDSC (G-MDSC), with a phenotype of CD11b+Ly6G+. In humans, mo-MDSC are characterized as CD11b+HLA-DR−CD33+CD14+, and G-MDSC are defined as CD11b+HLA-DR−CD33+CD15+.6
Hematopoiesis is a coordinated process that is well controlled by multiple factors, such as cytokines secreted by activated immune cells or stromal cells, as well as cells from organs, such as the liver and kidney.7 In physiological conditions, immature myeloid cells are mainly derived from hematopoietic stem cells (HSC) in bone marrow and differentiated into mature immune cells, such as granulocytes, monocytes and macrophages.8 In pathological situations, such as with a tumor, acute or chronic inflammation and trauma, along with the changed expression profile of cytokines, the pathways of differentiation from HSC are partially blocked, which results in excessive expansion of MDSC.6, 9 Studies have shown that the factors implicated in the expansion and activation of MDSC could be divided into two main groups. One group consists of the factors mainly produced by tumor cells, which induce MDSC expansion by promoting myelopoiesis and inhibiting differentiation into mature myeloid cells. The other group consists of the factors primarily produced by tumor stromal cells, which are involved in the activation of MDSC.6
Numerous studies have reported the immunosuppressive mechanism of MDSC, whereas the expansion mechanism of MDSC is still poorly elucidated. It has been reported that tumor-derived granulocyte-macrophage colony-stimulating factor (GM-CSF) drives the development of MDSC in mouse models of pancreatic ductal adenocarcinoma and breast carcinoma.10, 11 In addition to GM-CSF, the combination of G-CSF and interleukin (IL)-6 leads to a rapid generation of MDSC from precursors in the bone marrow.12 Vascular endothelial cell growth factor (VEGF), stem cell factor (SCF) and IL-1β are also reported to drive the expansion of MDSC.13, 14 It is well known that the development of MDSC not only involves the expansion of MDSC but also requires the activation of immunosuppression. IL-4 and IL-13 were found to be involved in the upregulation of arginase 1.15 In addition, interferon (IFN)-γ also increases the immunosuppression of MDSC. IL-18 has been found to not only differentiate CD11b− bone marrow progenitor cells into mo-MDSC but also to enhance the immunosuppressive responses of MDSC.16 In addition to the reported growth factors and cytokines, chemokines CXCL16 and CCL21 are also reported to induce MDSC expansion and thereby contribute to the failure of T-cell immunosurveillance.17, 18
Chemokine (C-X-C motif) ligand 1 (CXCL1) and chemokine (C-X-C motif) ligand 2 (CXCL2), which are 90% identical in amino acid sequence and share the same receptor, CXCR2, have been extensively studied with regard to their role in recruiting neutrophils.19, 20 Herein, we identified CXCL1 and CXCL2 as novel factors in promoting mo-MDSC generation from bone marrow cells, and knock down of CXCL1 or CXCL2 decreased the percentage of mo-MDSC. We found that CXCL1 and CXCL2 were secreted by tumor cells and tumor-infiltrated CD11b+ myeloid cells. Moreover, the CXCL1 and CXCL2-induced increase of mo-MDSC was not involved in chemotaxis, proliferation or apoptosis of mo-MDSC.
2 MATERIALS AND METHODS
2.1 Mice and cell lines
C57BL/6 mice and BALB/c mice (8-10 weeks old) were purchased from the Animal Experimental Center of Jilin University (Changchun, China). All mice were housed in a specific pathogen-free environment under protocols approved by the Animal Care Committee of Northeast Normal University, China, and all methods related to mice were carried out in accordance with the approved guidelines. Mouse melanoma B16F10 cells, mouse breast cancer 4T1 cells, mouse embryo fibroblast (MEF) cells and human embryonic kidney HEK-293T cells were purchased from the ATCC. All cells were maintained in DMEM supplemented with 10% heat-inactivated FBS (HyClone, Logan, UT, USA) and 1% penicillin/streptomycin.
2.2 Reagents and antibodies
Recombinant murine CXCL1 (250-11), CXCL2 (250-15), CXCL10 (250-16) and GM-CSF (315-03) were purchased from PeproTech (Rocky Hill, NJ, USA). Directly conjugated anti-mouse mAbs CD11b-FITC (M1/70), CD45-PE/Cy7 (30-F11), Ly6G-APC/Cy7 (1A8), Ly6C-PE (AL-21), CXCR2 (SA044G4)-Alexa Fluor 647 and NK1.1-APC (561117) were from BD Pharmingen (San Jose, CA, USA). Directly conjugated anti-mouse mAbs CD11b-biotin (M1/70), Ki-67-FITC (16A8) were purchased from Biolegend (San Diego, CA, USA). Directly conjugated anti-mouse mAbs CD4-FITC (GK1.5) and CD8a-PE (53.6.7), anti-mouse mAbs CD3 (17A2) and CD28 (PV-1) and the Annexin V-APC apoptosis analysis kit (AO2001-11P-G) were obtained from Sungene (Tianjin, China). Carboxyfluorescein succinimidyl ester (CFSE) was from Molecular Probes (Eugene, OR, USA). The mouse cytokine array panel A (ARY006) was purchased from R&D Systems (Minneapolis, MN, USA). The myeloid-derived suppressor cell isolation kit was from Miltenyi Biotec (Bergisch Gladbach, Germany)and the streptavidin particles were from BD IMag (San Jose, CA, USA).
2.3 Flow cytometry analysis
Bone marrow and spleen were ground and filtered through a 100-μm cell strainer. Single-cell suspensions were treated with hypotonic lysis buffer to eliminate erythrocytes. Then, the single-cell suspensions were stained with fluorochrome-conjugated antibodies at 4°C for 30 minutes. The treated cells were tested by flow cytometry using a FACSCanto II (BD Biosciences , San Jose, CA, USA), and the data were analyzed with FACSDiva software (BD Biosciences) and Flow Jo 7.6.1 software.
2.4 T-cell proliferation assay
The T-cell proliferation assay was carried out as previously described.21 Splenocytes (2 × 10⁶) from normal mice were prestained with CFSE at room temperature for 5 minutes and then quenched with 10% FBS. The treated splenocytes were plated in wells and stimulated with the antibodies of anti-CD3 (0.5 μg/mL) and anti-CD28 (1 μg/mL) in the presence of increasing ratios of MDSC. On day 3 of the coculture, cells were collected and evaluated by flow cytometry.
2.5 In vivo mo-MDSC induction assay
Conditioned medium was collected from the serum-free medium cultured with B16F10 cells, 4T1 cells and MEF cells for 18 hours. For in vivo induction experiments, the collected supernatant was concentrated at 300 g for 20 minutes at 4°C using a 3000 nominal molecular-weight limit centrifugal filter (Merck Millipore, Burlington, MA, USA). The concentrated cell-conditioned medium (300 μL) was injected i.v. daily for 7 days in the absence or presence of CXCL1 (50 μg/mouse) or CXCL2 (50 μg/mouse).
2.6 Cytokine array for cell-conditioned medium
For the cytokine array, the conditioned medium collected from B16F10 cells, 4T1 cells and MEF cells was processed according to the manufacturer's instructions (R&D Systems).
2.7 Induction of mouse bone marrow cells in vitro
Induction of mouse bone marrow cells was carried out as previously described.22 Briefly, mouse bone marrow cells were flushed out from the femurs and tibias using a syringe with a 26-gauge needle and ground into a single-cell suspension. Erythrocytes were eliminated using hypotonic lysis buffer. The remaining cells were cultured in complete medium supplemented with GM-CSF (10 ng/mL) for 5 days. In a separate experiment, CXCL1 or CXCL2 was added to the induction system.
2.8 Construction of the lentiviral expression plasmid and transfection
PLL3.7 Cloning Vector (Addgene, Cambridge, MA, USA) was used to knock down the expression of CXCL1 and CXCL2. The CXCL1 ShRNA sequences were #1: 5′- TGCACCCAAACCGAAGTCATTTCAAGAGAATGACTTCGGTTTGGGTGCTTTTTTC-3′ and 5′- TCGAGAAAAAAGCACCCAAACCGAAGTCATTCTCTTGAAATGACTTCGGTTTGGGTGCA-3′; and #2: 5′- TGGAGACCACTAAGTGTCAATTCAAGAGATTGACACTTAGTGGTCTCCTTTTTTC-3′ and 5′- TCGAGAAAAAAGGAGACCACTAAGTGTCAATCTCTTGAATTGACACTTAGTGGTCTCCA-3′. The CXCL2 shRNA sequences were #1: 5′- TGGGTTGACTTCAAGAACATTTCAAGAGAATGTTCTTGAAGTCAACCCTTTTTTC-3′ and 5′- TCGAGAAAAAAGGGTTGACTTCAAGAACATTCTCTTGAAATGTTCTTGAAGTCAACCCA-3′; and #2: 5′- TGCCAAGGGTTGACTTCAAGTTCAAGAGACTTGAAGTCAACCCTTGGCTTTTTTC-3′ and 5′- TCGAGAAAAAAGCCAAGGGTTGACTTCAAGTCTCTTGAACTTGAAGTCAACCCTTGGCA-3′. The synthesized shRNAs were cloned into the vectors, and the constructed plasmids and shCtrl plasmid were transfected into 293T cells, together with the packaging plasmid psPAX2 and the envelope plasmid pMD2.G (both from Addgene) by using Lipofectamine 2000 reagent (Invitrogen, Carlsbad, CA, USA). To knock down CXCL1 or CXCL2, the collected supernatant and 4 mg/mL polybrene (Sigma, St Louis, MO, USA) were used to infect the B16F10 cells. Stable cell lines infected with CXCL1 ShRNA (shCXCL1), CXCL2 ShRNA (shCXCL2) or control ShRNA (shCtrl) were separated by flow cytometry sorting. To knock down CXCL1 or CXCL2 in tumor-bearing mice, the collected supernatant was concentrated and i.v. injected into mice four times every other day.
2.9 Cell isolation
Monocytic MDSC and G-MDSC were sorted by using the AutoMACS sorter (Miltenyi Biotech) with a myeloid-derived suppressor cell isolation kit according to the manufacturer's instructions. To isolate CD11b+ cells, the primary tumor was minced into small fragments and then digested into a single-cell suspension with 2 mg/mL collagenase II at 37°C for 1 hour. The cells were separated into two layers using Ficoll, and the middle layer was collected. Then, CD11b+ cells were isolated by positive selection with the biotin-conjugated CD11b antibody and streptavidin particles according to the manufacturer's instructions (BD IMag).
2.10 RNA extraction and real-time PCR
Total RNA was extracted with TRIzol (Invitrogen), and the cDNA was synthesized with reverse transcriptase (Thermo Fisher Scientific, Waltham, MA, USA). Real-time PCR analysis was carried out using SYBR Green Master Mix (Roche, Basel, Switzerland) on a Roche LightCycler 480 (Roche). Sequences of primers used for PCR were as follows: 5′-ATGGCTGGGATTCACCTCAA-3′ and 5′-CAAGGGAGCTTCAGGGTCAA-3′ for CXCL1; 5′-GCCCAGACAGAAGTCATAGCC-3′ and 5′-TCAGTTAGCCTTGCCTTTGTTC-3′ for CXCL2; 5′-GACAGGGCTCCTTTCAGGAC-3′ and 5′-CTTGGGAGGAGAAGGCGTTT-3′ for Arg1; and 5′-TCCCTTCCGAAGTTTCTGGC-3′ and 5′-CTCTCTTGCGGACCATCTCC-3′ for iNOS. Primers used for the housekeeping gene actin were 5′-AACAGTCCGCCTAGAAGCAC-3′ and 5′-CGTTGACATCCGTAAAGACC-3′.
2.11 Transwell analysis
Sorted mo-MDSC or G-MDSC (5 × 10⁴) were loaded on the upper wells, and the chemokines, such as CXCL1 or CXCL2, were placed in the lower wells. Based on the size of the cells, a 5-μm pore transwell chamber was used for mo-MDSC, and a 3-μm pore was used for G-MDSC. The migrated cells were collected in the lower chamber and calculated after incubation at 37°C with 5% CO2 for 3 hours.
2.12 Statistical analysis
The data were analyzed by Student's t test using GraphPad Prism software.
3 RESULTS
3.1 Monocytic MDSC expand under tumor-bearing conditions
Tumor progression is often accompanied by immunity and inflammation, and the immune system is altered by the tumor environment.1 To test the effect of tumors on immune cells, we examined multiple immune cell populations in a B16F10-bearing mouse model. Data showed that the percentages of CD11b+Ly6G+ cells, CD11b+Ly6C+ cells, CD4+T cells, CD8+T cells and natural killer (NK) cells were significantly changed compared to that of normal controls (Figure 1A). Considering the increase in the immune cells (CD45+ cells), the absolute number of CD11b+Ly6C+ cells and CD11b+Ly6G+ cells increased significantly in the blood of tumor-bearing mice compared to that of normal mice, whereas the number of CD4+T cells, CD8+T cells and NK cells showed no significant change (Figure 1B).
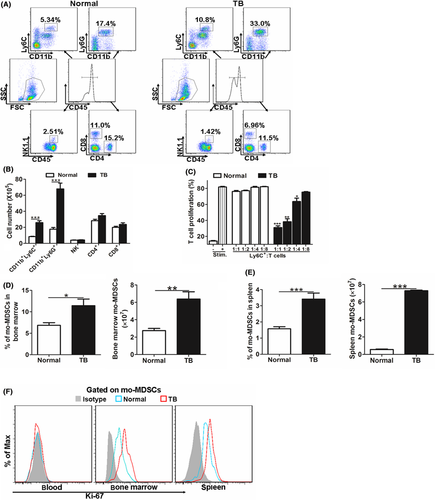
As CD11b+Ly6C+ cells exert important roles in the immune system,23 and mo-MDSC were described as CD11b+Ly6C+, which were suggested to suppress T-cell activity,6 a T-cell suppression assay was carried out. Results showed that isolated CD11b+Ly6C+ cells from tumor-bearing mice inhibited T-cell proliferation, whereas the counterpart from normal mice did not show immunosuppressive potential (Figure 1C), indicating that the CD11b+Ly6C+ cells from tumor-bearing mice contain mo-MDSC. Consistent with the tendency in blood, the percentage and number of mo-MDSC in bone marrow and spleen were also increased in tumor-bearing mice (Figure 1D,E). To address the expansion of mo-MDSC, we analyzed Ki-67 expression in mo-MDSC, which was associated with cellular proliferation. Ki-67 expression of mo-MDSC was detected in the bone marrow and spleen only, not in the blood, regardless of type of mouse (normal or tumor-bearing) (Figure 1F). Furthermore, mo-MDSC from the bone marrow and spleen of tumor-bearing mice expressed a higher level of Ki-67 compared with that from normal mice (Figure 1F), suggesting the increased mo-MDSC in tumor-bearing mice was, at least to some extent, a result of the expansion of mo-MDSC in bone marrow and spleen. Together, these results indicate that the tumor-bearing condition drives the accumulation of mo-MDSC.
3.2 Tumor cell-secreted cytokines promote the expansion of mo-MDSC
Given the link between the tumor-bearing condition and the accumulation of mo-MDSC in the tumor-bearing model, we hypothesized that tumor-secreted cytokines might drive the generation of mo-MDSC. We i.v. injected normal mice with B16F10-conditioned media (B16F10-CM) or cell-free media (Media). MEF-conditioned media (MEF-CM) was also injected, as it was found that MEF cells could not form detectable primary tumor (data not shown). The results showed that the B16F10-CM, but not the cell-free media and MEF-CM, triggered the accumulation of mo-MDSC in the blood, bone marrow and spleen (Figure 2A). To further confirm the correlations between tumor-secreted cytokines and mo-MDSC expansion, the implanted primary tumors were surgically removed, and decreased numbers of mo-MDSC were observed in the blood, bone marrow and spleen 2 weeks later (Figure 2B). Together, these data suggest that B16F10 cell-secreted cytokines were responsible for the expansion of mo-MDSC.
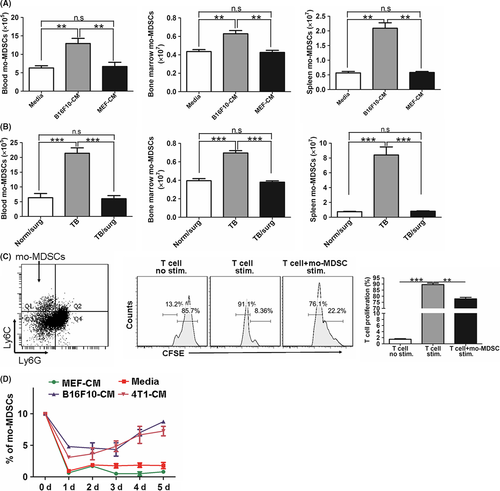
Similar to B16F10 cells, 4T1 cell-inoculated mice also showed an increased frequency of mo-MDSC in the blood (Figure S1). Therefore, we deduced that B16F10 cells and 4T1 cells could secrete similar cytokines to induce the expansion of mo-MDSC in vitro. As bone marrow cells were widely used to generate MDSC in vitro,24 we cultured bone marrow cells for 5 days in the presence of GM-CSF in vitro according to published reports (Figure 2C).24-26 The induced mo-MDSC were sorted and observed with obviously suppressive potential, which significantly suppressed the proliferation of T cells (Figure 2C), verifying the immunosuppressive function of these induced mo-MDSC. Furthermore, the conditioned medium derived from B16F10 cells and 4T1 cells induced greater mo-MDSC differentiation from bone marrow cells than the MEF-CM and cell-free media (Media) on day 5 (Figures 2D; S2). Together, these data suggest that factors secreted by B16F10 cells and 4T1 cells but not by MEF cells could induce the differentiation of bone marrow cells into mo-MDSC.
3.3 Tumor cells highly express CXCL1 and CXCL2
To identify the tumor-secreted factors that contribute to the generation of mo-MDSC from bone marrow cells, we conducted a cytokine array analysis by using conditioned medium from B16F10 cells, 4T1 cells and MEF cells. As the results showed, GM-CSF and G-CSF were highly expressed in 4T1 cells but not in B16F10 cells or MEF cells. CXCL10 was only highly expressed in B16F10 cells, and CXCL12 was only highly expressed in MEF cells. Although CCL5 was expressed in both B16F10 cells and 4T1 cells, the expression level was different between them (Figure 3A,B). Of note, we found that in the medium from both B16F10 cells and 4T1 cells, CXCL1 and CXCL2 were more highly expressed than in the medium of MEF cells (Figure 3A,B), which was confirmed by the real-time PCR results (Figure 3C). Furthermore, melanocytes and breast epithelial cells were separated from mice (Figure S3), and the expression of CXCL1 and CXCL2 in melanocytes and breast epithelial cells was significantly lower than in B16F10 and 4T1 (Figure S4).
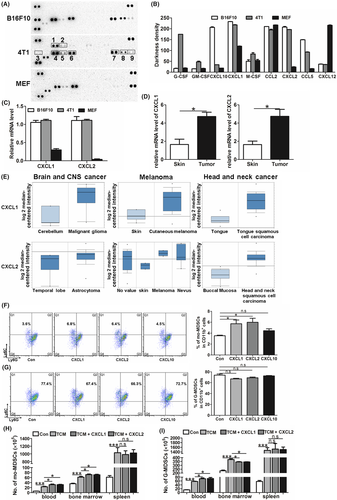
Besides tumor cells, high-level expressions of CXCL1 and CXCL2 were also detected in the primary tumor of B16F10-bearing mice (Figure 3D). Furthermore, the expression levels of CXCL1 and CXCL2 in human carcinoma samples were obtained from the cancer microarray database, Oncomine.27 The data showed that CXCL1 and CXCL2 were more highly expressed in carcinomas than in normal tissue samples in multiple carcinoma types, such as melanoma, head and neck cancer and brain and central nervous system (CNS) cancer (Figure 3E). Together, these data indicate that CXCL1 and CXCL2 were highly expressed in tumor cells, and their expression was widely distributed in clinical carcinoma samples.
3.4 Giving CXCL1 and CXCL2 increases the generation of mo-MDSC both in vivo and in vitro
As the conditioned medium from B16F10 cells and 4T1 cells could trigger the accumulation of mo-MDSC, and CXCL1 and CXCL2 were specifically expressed in B16F10 cells and 4T1 cells, we therefore presumed that CXCL1 and CXCL2 were associated with the expansion of mo-MDSC. Recombinant CXCL1 or CXCL2 was given in our in vitro induction assay. In the negative control group, bone marrow cells were treated with equal concentrations of CXCL10. The data showed that CXCL1 and CXCL2 promoted the differentiation of bone marrow cells into mo-MDSC (Figure 3F) rather than into G-MDSC (Figure 3G).
Furthermore, the function of CXCL1 and CXCL2 in inducing the generation of mo-MDSC was also detected in vivo. As giving B16F10-CM could induce the accumulation of mo-MDSC, CXCL1 or CXCL2 accompanied with B16F10-CM was i.v. injected into normal mice. The data showed that, compared with the mice injected with B16F10-CM alone, giving CXCL1 or CXCL2 increased mo-MDSC in the blood and bone marrow (Figure 3H). These results indicate that CXCL1 and CXCL2 could promote the expansion of mo-MDSC. Importantly, the increased levels of mo-MDSC were only detected in the blood and bone marrow, rather than in the spleen, suggesting that the CXCL1 and CXCL2 administration-induced increase of mo-MDSC in blood mainly derived from bone marrow. In addition, increased G-MDSC in blood and decreased G-MDSC in bone marrow were found, further verifying the function of CXCL1 and CXCL2 in recruiting G-MDSC (Figure 3I). Moreover, the number of G-MDSC in spleen was not affected by giving CXCL1 and CXCL2 (Figure 3I).
3.5 Knockdown of CXCL1 or CXCL2 attenuates the expansion of mo-MDSC
To further identify the function of CXCL1 and CXCL2 in promoting the expansion of mo-MDSC, we knocked down CXCL1 or CXCL2 in B16F10 cells using shRNA technology. The data showed that the silencing of CXCL1 or CXCL2 expression did not influence the cell growth kinetics (Figure S5). Then, the above cells were s.c. implanted into normal mice, and the mice were examined at the indicated time points. Beginning from the 14th day, the number of mo-MDSC in the blood of shCXCL1 or shCXCL2-bearing mice was decreased, compared with that of the WT and shCtrl-bearing mice, and this tendency was maintained until the 21st day (Figure 4A). Also, the number of mo-MDSC in the bone marrow was decreased in the 3rd week (Figure 4B).
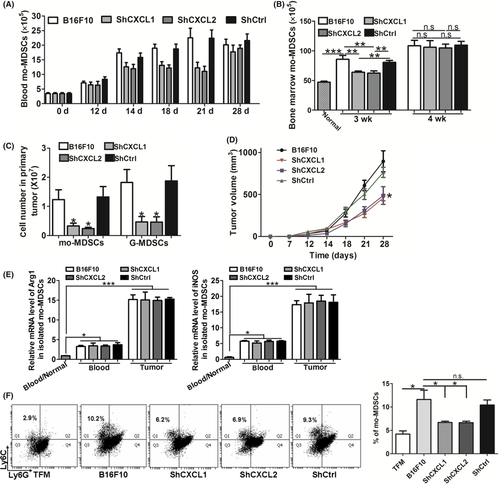
We also analyzed the accumulation of mo-MDSC in the primary tumor when CXCL1 or CXCL2 were knocked down. Consistent with the decreased mo-MDSC in blood and bone marrow, the number of mo-MDSC in primary tumor was also decreased (Figure 4C). Moreover, a decreased number of G-MDSC was observed (Figure 4C), which was in line with the fact that CXCL1 and CXCL2 were chemoattractants of G-MDSC. In addition, we found that the knockdown of CXCL1 or CXCL2 in B16F10 cells delayed the growth of primary tumor (Figure 4D). In response to the inhibition of tumor growth, the number of G-MDSC in the blood and bone marrow of shCXCL1- or shCXCL2-bearing mice was obviously decreased from the 3rd week after tumor cell inoculation (Figures S6 and S7). In addition, there was no significant relevance between the immunosuppressive activity of mo-MDSC and CXCL1 or CXCL2 (Figure 4E).
Furthermore, knockdown of CXCL1 or CXCL2 in B16F10 cells significantly decreased the percentage of mo-MDSC compared with that in WT B16F10 and shCtrl B16F10 cells when the tumor cell-conditioned media was obtained and used in our in vitro induction assay (Figure 4F). These data further verified that CXCL1 and CXCL2 were required for the generation of mo-MDSC.
3.6 Tumor-infiltrated CD11b+ myeloid cells contribute to the expression of CXCL1 and CXCL2
Interestingly, the mo-MDSC decrease in the blood which was induced by knockdown of CXCL1 or CXCL2 was attenuated on the 28th day (Figure 4A). A similar result was obtained from bone marrow, in which the decrease began to reverse in the 4th week (Figure 4B). These results implied that there were other sources of CXCL1 and CXCL2 besides tumor cells in the late stage of carcinoma. To test this possibility, the cell composition of the primary tumor was analyzed, and the expression of CXCL1 and CXCL2 in these cells was tested. The data showed that a great number of CD11b+ myeloid cells, including mo-MDSC, G-MDSC and macrophages, were recruited into the primary foci (Figure 5A). Knockdown of CXCL1 or CXCL2 in B16F10 cells attenuated the accumulation of myeloid cells in primary tumors from the 14th to the 21st day, and the phenomenon disappeared on the 28th day (Figure 5B). We then sorted the CD11b+ myeloid cells (Figure S8), with a purity of ≥90%, and examined their expression of CXCL1 and CXCL2. We found that, compared with the myeloid cells in the blood and spleen, myeloid cells in the primary tumor expressed more CXCL1 and CXCL2 (Figure 5C), indicating that the recruited myeloid cells in the primary tumor were another significant contributor of CXCL1 and CXCL2 in addition to the tumor cells. Furthermore, the residual cells after removing CD11b+ myeloid cells showed decreased expression of CXCL1 and CXCL2 in the primary tumor of shCXCL1- or shCXCL2-bearing mice compared with the WT and shCtrl-bearing mice on the 28th day (Figure S9). These data exclude the possibility that the recovery of the decreased mo-MDSC in the shCXCL1 and shCXCL2 groups resulted from inefficient interference.
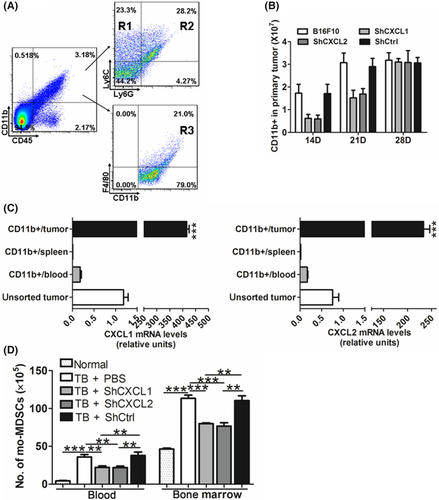
As tumor-recruited myeloid cells could also produce CXCL1 and CXCL2, lentivirus-based RNA interference against CXCL1 or CXCL2 was i.v. injected into B16F10-bearing mice. Data showed that the percentages of mo-MDSC in the blood and bone marrow were significantly lower than that in the mice injected with PBS or shCtrl lentivirus when CXCL1 or CXCL2 was effectively knocked down in the primary tumor (Figures 5D and S10). Together, these results further verified that CXCL1 and CXCL2 produced by both tumor cells and recruited myeloid cells promote the expansion of mo-MDSC.
3.7 Chemokine (C-X-C motif) ligand 1 and CXCL2 do not impact chemotaxis, proliferation or apoptosis of mo-MDSC
As a reduced recruitment of mo-MDSC was detected in the primary tumor when CXCL1 or CXCL2 were knocked down and CXCL1 and CXCL2 were initially discovered as chemokines to recruit CD11b+Ly6G+ cells,20 a transwell assay was conducted to examine whether CXCL1 and CXCL2 also recruit mo-MDSC. CCL12 was used as a positive control.28 Data showed that CXCL1 and CXCL2 could recruit G-MDSC, but not mo-MDSC, regardless of whether the mo-MDSC were isolated from the blood or the bone marrow (Figure 6A). In addition, G-MDSC, but not mo-MDSC, expressed high levels of CXCR2 (Figure 6B). Taken together, these results suggest that the decrease in the levels of mo-MDSC detected in the blood was not related to the chemotaxis of mo-MDSC. Furthermore, mo-MDSC isolated from the primary tumor did not express CXCR2 (Figure S11), indicating that the reduced recruitment of mo-MDSC in the primary tumor of shCXCL1- or shCXCL2-bearing mice did not result from knockdown of CXCL1 or CXCL2.
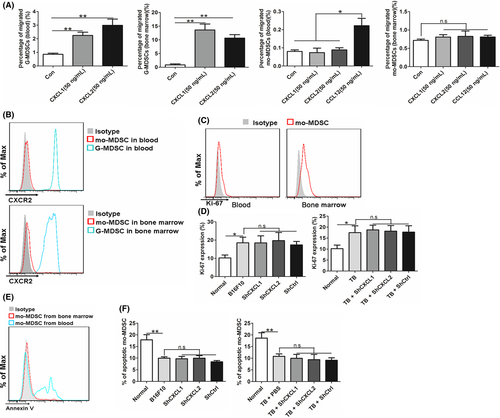
Proliferation and apoptosis of mo-MDSC were also examined. Data showed that mo-MDSC from the bone marrow, but not from the blood, have proliferative activity (Figure 6C). Similar results were obtained by examining the cell-cycle profile (Figure S12). Lung recruited-mo-MDSC were used as a negative control, which was reported without proliferation potential.29 Moreover, there was greater Ki-67 expression in mo-MDSC from the bone marrow of B16F10-bearing mice than that from normal mice (Figure 6D). In addition, mo-MDSC from the blood showed obvious apoptosis, and no apoptosis of mo-MDSC from the bone marrow was detected (Figure 6E). Additionally, the apoptosis of mo-MDSC in blood were not affected by the interference of CXCL1 or CXCL2 (Figure 6F). Together, these results suggest that CXCL1 and CXCL2 do not affect the chemotaxis, proliferation or apoptosis of mo-MDSC.
4 DISCUSSION
The process of MDSC generation and expansion is known to be controlled by multiple factors such as growth factors and cytokines. In addition to GM-CSF, which was initially found to be necessary to induce MDSC generation,11 many factors, such as IL-6, G-CSF, IL-18 and CXCL16, have been discovered to promote the expansion of MDSC, and these factors are often combinatorial and complementary.12 CXCL1 and CXCL2 were originally characterized as chemokines of neutrophils. Increasing evidence has been provided to support the potential relationship of CXCL1 and CXCL2 with cancer progression as well as with metastatic recurrence.30, 31 For example, CXCL1 and CXCL2 regulate tumor epithelial-stromal interactions to facilitate tumor growth and invasion and are associated with angiogenesis.32 In this study, we reported for the first time that CXCL1 and CXCL2 promoted the differentiation of bone marrow cells into mo-MDSC. Giving CXCL1 or CXCL2 increased the percentage of mo-MDSC both in vivo and in vitro (Figure 3F,H), and silencing CXCL1 or CXCL2 significantly decreased mo-MDSC generation (Figure 4A,B). In contrast, CXCL1 and CXCL2 have no direct effect on the generation of G-MDSC (Figure 3G,I), although the recruitment of G-MDSC into the primary tumor was decreased because of CXCL1 or CXCL2 silence (Figure 4C). Mo-MDSC were an important component of perturbed tumor-associated myelopoiesis and were reported to construct the premetastatic niche.6, 28 Our results suggest a novel role of CXCL1 and CXCL2 in promoting tumor progression by increasing the expansion of mo-MDSC. Furthermore, although the tumor-bearing condition induces the increase of both mo-MDSC and G-MDSC, CXCL1 and CXCL2 specifically promoted the generation of mo-MDSC rather than G-MDSC. In addition, CXCL1- and CXCL2-promoted mo-MDSC generation was dependent on GM-CSF administration.24, 25
CXCL1 and CXCL2 are expressed at low levels in homeostatic conditions, whereas in inflammatory conditions, they are highly produced by a number of different cells,20 and their expression levels are primarily regulated by growth factors/mediators, such as VEGF, transforming growth factor (TGF)β, JNK, and PI3K.33, 34 Extensive expression of CXCL1 and CXCL2 in tumor tissue has been reported.35 In a tumor microenvironment, CXCL1 and CXCL2 are not only expressed in tumor cells but also in endothelial cells and epithelial cells.36, 37 In our work, we found that in addition to tumor cells, tumor-infiltrated CD11b+ myeloid cells also contributed to the expression of CXCL1 and CXCL2 (Figure 5C). Furthermore, these myeloid cells in the blood and spleen expressed almost undetectable levels of CXCL1 and CXCL2 (Figure 5C), implying that the tumor microenvironment could transform the recruited myeloid cells and make them beneficial for tumor progression. So, we reported a new source of CXCL1 and CXCL2 in the tumor microenvironment.
The expansion of immune cells involves several aspects, including differentiation from progenitor cells, increased proliferation and decreased apoptosis.38 CXCR2 has been reported to be involved in the proliferation of T cells.39 Our results showed that CXCL1 and CXCL2 had no effect on the proliferation of mo-MDSC (Figure 6D), excluding the possibility that CXCL1 and CXCL2 may play roles in mo-MDSC proliferation. Cytokines such as IL-33 and macrophage inflammatory protein 2 (MIP2) have been shown to be correlated with the apoptosis of cells,40, 41 and we found that the apoptosis of mo-MDSC was also not affected by CXCL1 and CXCL2 (Figure 6F). These findings support the conclusion that CXCL1 and CXCL2 favor the expansion of mo-MDSC only by promoting the differentiation of bone marrow cells to mo-MDSC.
Bone marrow cells are a heterogeneous cell population, which consist of HSC and multipotent progenitors. We showed that CXCL1 and CXCL2 promoted the differentiation of bone marrow cells into mo-MDSC in the presence of GM-CSF, whereas the ligand response of the receptor and progenitor cells remained unclear. Although GM-CSF has been reported to trigger the generation of Gr-1+CD11b+cells from c-kit+ precursors in the spleens of tumor-bearing KPC mice,11 c-kit+ precursors are a heterogeneous population, including hematopoietic stem cell (HSC, Flk2− Lin− Sca1+ c-Kit+), multipotent progenitor (MPP, CD34+ Flk2+ Lin− Sca1+ c-Kit+), common myeloid progenitor (CMP, Lin− IL7R+ c-Kit+ Sca1− CD34+ CD16−), GMP (Lin− IL7R− c-Kit+ Sca1− CD34+ CD16+) and macrophage dendritic-cell progenitor (MDP, c-Kit+ CD115+ Flk2+ Ly6C− CD11b−).38 Therefore, the exact precursors that CXCL1 and CXCL2 act on remain to be further explored. Recently, CXCR2 was reported to be differentially expressed in CD34+ stem/progenitor cells,42 which may provide a possibility for further studies. In conclusion, our results show that the expression of CXCL1 and CXCL2 in tumor cells and tumor-infiltrated CD11b+ myeloid cells is critically involved in the promotion of the generation of mo-MDSC from bone marrow cells. CXCL1 and CXCL2, which were originally characterized as chemokines to recruit neutrophils, were found to specifically promote the expansion of mo-MDSC rather than G-MDSC. Our findings provide novel evidence for the association of tumor progression and immunity and suggest that abrogation of CXCL1 and CXCL2 might weaken tumor progression.
ACKNOWLEDGMENTS
The authors thank Dr JC Zhang for important discussions, Dr WG Liu for advice on the cytokine analysis array, and Dr X. Jin for providing technical assistance with flow cytometry. We thank the staff of the Experimental Animal Center of Northeast Normal University for assistance with animal care. This work was supported by grants from the National Natural Science Foundation of China (81670095, 81372288 and 31270916) and the Natural Science Foundation of Jilin Province (20150101186JC).
CONFLICTS OF INTEREST
Authors declare no conflicts of interest for this article.


