Pim1 supports human colorectal cancer growth during glucose deprivation by enhancing the Warburg effect
Funding information
Hospital Foundation of the Fudan University Shanghai Cancer Center (Grant/Award Number: ‘YJ201504’), Shanghai Key Developing Disciplines (Grant/Award Number: ‘2015ZB0201’), Shanghai Science and Technology Development Fund (Grant/Award Number: ‘15ZR1407400’), Science and Technology Commission of the Shanghai Municipality (Grant/Award Number: ‘15495810300’), National Natural Science Foundation of China (Grant/Award Numbers: ‘81272299’,’81472220’,’81472222’,’81572254’,’81602087’,’81602269’,’81772583’), Domestic Science and Technology Cooperation Project (Grant/Award Number: ‘14495800300’), Shanghai Hospital Development Centre Emerging Advanced Technology joint research project (Grant/Award Number: ‘HDC12014105’)
Abstract
Cancer cells metabolize glucose mainly by glycolysis and are well adapted to metabolic stress. Pim1 is an oncogene that promotes colorectal cancer (CRC) growth and metastasis, and its expression is positively correlated with CRC progression. However, the mechanism underlying Pim1 overexpression during CRC progression and the role of Pim1 in CRC metabolism remains unclear. In the present study, we discovered that Pim1 expression was significantly upregulated in response to glucose deprivation-induced metabolic stress by AMP-activated protein kinase signaling. Pim1 promoted CRC cell proliferation in vitro and tumorigenicity in vivo. Clinical observations showed that Pim1 expression was higher in CRC tissues than in adjacent normal tissues. Pim1 overexpression in CRC tissues not only predicted CRC prognosis in patients but also showed a positive relationship with 18F-fluorodeoxyglucose uptake. Further in vitro experiments showed that Pim1 promoted the Warburg effect and that Pim1 expression was positively correlated with hexokinase 2 and lactate dehydrogenase A expression. Pim1-silenced cells were more vulnerable to glucose starvation, and Pim1-induced tumor proliferation or tolerance to glucose starvation was attenuated by blocking the Warburg effect. In conclusion, glucose deprivation is one of the mechanisms that leads to elevated Pim1 expression in CRC, and Pim1 upregulation ensures CRC growth in response to glucose deprivation by facilitating the Warburg effect in a compensatory way.
Abbreviations
-
- 18F-FDG
-
- 18F-fluorodeoxyglucose
-
- AJCC
-
- American Joint Committee on Cancer
-
- AMPK
-
- AMP-activated protein kinase
-
- CI
-
- confidence interval
-
- CRC
-
- colorectal cancer
-
- DFS
-
- disease-free survival
-
- FDUSCC
-
- Fudan University Shanghai Cancer Center
-
- HK2
-
- hexokinase 2
-
- HR
-
- hazard ratio
-
- IHC
-
- immunohistochemistry
-
- LDHA
-
- lactate dehydrogenase A
-
- OS
-
- overall survival
-
- SUVmax
-
- maximum standard uptake value
1 INTRODUCTION
Metabolic stress often occurs in rapidly proliferating cells that persistently need more energy for survival and growth.1-3 Overcoming metabolic stress is certainly a critical step during the growth of solid tumors. A key signaling pathway involved in metabolic adaptation is the LKB1-AMPK pathway.4 AMPK functions as a critical sensor of cellular energy status and is activated under energy stress conditions.5 The underlying mechanisms of cell death and survival under metabolic stress are not well understood. In addition, cancer cells have their own ways to adapt to metabolic deprivation.6-8 One study reported that nutrient deprivation can induce the Warburg effect, thereby indicating the role of the Warburg effect in helping cancer cells to overcome metabolic stress.9
Otto Warburg first discovered that even with normal concentrations of oxygen, cancer cells prefer anaerobic breakdown of glucose over mitochondrial oxidative phosphorylation to generate energy, and this phenomenon is known as the “Warburg effect”.10 The Warburg effect is characterized by enhanced glucose uptake and lactate production, representing one of the most important metabolic transformations accompanying tumorigenesis.10
Pim1 is a member of constitutively activated serine/threonine kinases and was first identified as the proviral integration site for Moloney murine leukemia virus, which causes murine leukemia.11-13 Pim1 can interact with and phosphorylate several targets that are involved in cell cycle progression or apoptosis.14 It is overexpressed in many types of cancer cells, including hepatocellular cancer, prostate cancer, glioblastoma, lung cancer, breast cancer and CRC, and its overexpression is associated with tumor development and progression.13, 15-19 In colon cancer, Pim1 repression leads to major changes in oncogenic signal transduction with regard to p21Cip1/WAF1, STAT3, JNK, c-Myc, and survivin and in the levels of apoptosis-related proteins Puma, Bax, and Bcl-xL.19 However, the underlying mechanism of Pim1 in CRC remains unclear.
In the present study, we aimed to address some key questions regarding the expression pattern of Pim1 in CRC. Thus, we carried out a series of in vitro and in vivo experiments to identify the role of Pim1 in CRC progression. We discovered that Pim1 is upregulated by glucose deprivation in CRC through AMPK signaling and that Pim1 overexpression promotes the Warburg effect and consequently facilitates tumor progression.
2 MATERIALS AND METHODS
2.1 Patients and specimens
A total of 296 patients who were newly diagnosed with CRC and had undergone surgical resection without any preoperative therapy at FDUSCC between 2008 and 2009 were selected for this retrospective study. Written informed consent was obtained from all patients. All specimens were reviewed by two pathologists to confirm the diagnosis. The pathologists selected representative tumor regions from primary formalin-fixed paraffin-embedded (FFPE) blocks. Corresponding fresh tumor tissue samples were obtained from the tissue bank of FDUSCC. This study was conducted in accordance with the Declaration of Helsinki and approved by the institutional review board of FDUSCC.
Data regarding clinicopathological features of CRC patients including age, gender, AJCC stage, tumor differentiation, vascular invasion, Ki-67 index, TNM stage and differentiation were recorded.
2.2 Immunohistochemistry
Tissue microarrays (TMA) containing 296 cancer tissues and adjacent normal colorectal epithelial tissues were prepared and incubated with primary antibodies against Pim1 (1:100; Abcam, Cambridge, UK) at 4°C overnight. IHC results were evaluated by two certificated pathologists who were blinded to patient information. Pim1 expression was evaluated and quantified based on the intensity and extent of staining.20, 21 Briefly, cytoplasmic and/or nuclear staining of Pim1 was assigned an intensity score (0 [no staining], 1 [weak], 2 [moderate], and 3 [strong]) and an extent score (0 [no staining], 1 [<10% cells], 2 [10%-50% cells], 3 [>50% cells]). The intensity and extent scores were then added to give a total score ranging from 0 to 6. Cases with scores 0-2 were considered negative, 3-4 weakly positive and 5-6 strongly positive.
2.3 Cell lines and culture conditions
A series of human CRC cell lines (HT29, RKO, SW480, SW620, LOVO, HCT116, SW1116, and Caco2) were purchased from the Cell Bank of Shanghai Institute of Biochemistry and Cell Biology (Shanghai, China). The cell lines were cultured in DMEM (Gibco, Waltham, MA, USA) with 25 mmol/L glucose, 10% FBS (Gibco) and 1% mixture of penicillin and streptomycin in a 5% CO2 incubator at 37°C. To induce metabolic stress, cells were cultured in glucose-free DMEM (Gibco).
2.4 RNA extraction, reverse transcription (RT) and real-time qPCR
Total RNA was extracted by TRIzol (Invitrogen, Carlsbad, CA, USA) according to the manufacturer's instructions. Then, 500 ng RNA was transcribed into cDNA using the PrimeScript RT reagent kit (Takara, Shiga, Japan). Quantitative real-time PCR was completed with SYBR Premix Ex Taq II according to the manufacturer's protocol (Takara). β-Actin was used as the internal control to normalize mRNA levels. Relative mRNA level was calculated using the 2−ΔΔCt comparative method. The following primer sequences were used: 5′-CCCGACAGTTTCGTCCTGAT-3′ (forward) and 5′-ACCCGAAGTCGATGAGCTTG-3′ (reverse) for Pim1; 5′-ACAGAGCCTCGCCTTTGCCGAT-3′ (forward) and 5′-CTTGCACATGCCGGAGCCGTT-3′ (reverse) for actin; 5′-GATTTCACCAAGCGTGGACT-3′ (forward) and 5′-CCACACCCACTGTCACTTTG-3′ (reverse) for HK2; and 5′-CAGCTTGGAGTTTGCAGTTAC-3′ (forward) and 5′-TGATGGATCTCCAACATGG-3′ (reverse) for LDHA.
2.5 Proliferation and colony formation assays
Cells transfected with vectors or siRNAs were resuspended and seeded in triplicate in 96-well plates at a density of 5000 cells/well. CCK8 reagent (10 μL; Dojindo, Kumamoto, Japan) was added to each well at 0, 24, 48, 72 and 96 hours. Absorbance was measured at 450 nm after incubation for 2 hours at 37°C. For the colony formation assay, single-cell suspensions were prepared and seeded into 6-well plates at a density of 500 cells/well and cultured in complete medium for 14 days. The cell colonies were fixed, stained and then photographed.
2.6 Western blotting
Western blotting was carried out as previously described.22
2.7 Glucose uptake and lactate production assays
For the glucose uptake assay, CRC cells were transfected with plasmids or siRNAs and incubated for 24 hours. Glucose concentrations in the media were measured using a colorimetric glucose assay kit (BioVision, Milpitas, CA, USA) and normalized according to cell number.23
Levels of lactate produced were examined using a Lactate Colorimetric Assay Kit (BioVision). Indicated cells were seeded in 96-well plates at a density of 5000 cells/well. After incubation for 24 hours, the culture medium was replaced with FBS-free DMEM. After 8 hours, lactate assays were carried out according to the manufacturer's protocol using the culture medium collected from each sample.24
2.8 Cancer xenograft models in nude mice
Animal experiments were carried out according to the Guide for the Care and Use of Laboratory Animals (NIH publication no. 80-23, revised in 1996) and in compliance with the institutional ethical guidelines. Approximately, 5 × 10⁶ stable CRC cell lines with different Pim1 levels were injected into 6-week-old male athymic nude mice. The animals were killed after 4 weeks, and tumors were removed.
2.9 Antibodies and reagents
The following antibodies were used in this study: anti-Pim1 (Abcam, Cambridge, UK); anti-β-actin (13E5) rabbit mAb (4970; Cell Signaling Technology, Danvers, MA, USA); anti-AMPKα (D63G4) rabbit mAb (5832S; Cell Signaling Technology); anti-phospho-AMPKα (Thr172) (40H9) rabbit mAb (2535S; Cell Signaling Technology); anti-LDHA (C4B5) rabbit mAb (3582; Cell Signaling Technology); and anti-HK2 (C64G5) rabbit mAb (2867; Cell Signaling Technology).
Pim1 siRNAs (si1: sense 5′-GGAACAACAUUUACAACUCdTdT-3′, antisense 5′-GAGUUGUAAAUGUUGUUCCdTdT-3′; si2: sense 5′-GAUAUGGUGUGUGGAGAUA-3′, antisense 5′- UAU-CUCCACACACCAUAUC-3′), and a negative control siRNA (Scramble: sense 5′-CUUACGCUGAGUACUUCGAdTdT-3′, antisense 5′- UCGAAGUACUCAGCGUAAGdTdT-3′) were purchased from GenePharma (Shanghai, China). 2-Deoxyglucose (2-DG, Sigma Chemical Co., St Louis, MO, USA), A769662 and Compound C (Selleck Chemicals, Houston, TX, USA) were added to the medium as indicated.
2.10 Statistical analysis
The chi-squared-test or Fisher's exact test was used to analyze the association between the clinicopathological features and Pim1 expression and gene copy numbers. The Kaplan-Meier method with log-rank test was used to analyze patients’ survival curves. A Cox proportional hazards model was used to evaluate the associations between clinicopathological features and survival. Student's t test and one-way ANOVA were used for analyzing statistical significance. Statistical analyses were carried out using SPSS software, version 20.0 (SPSS Inc., Chicago, IL, USA). P < .05 was considered statistically significant.
3 RESULTS
3.1 Clinical information
Specimens were collected from 296 patients (173 men and 123 women) with a median age of 57 years (range, 27-81 years). Follow up ended on 31 Jan 2016, with a median follow-up duration of 80 months (range, 1-97 months). At the last follow up, 214 patients were still alive, and 82 had died. In total, 68 of the 248 patients experienced recurrence.
3.2 Pim1 is upregulated in CRC tissues
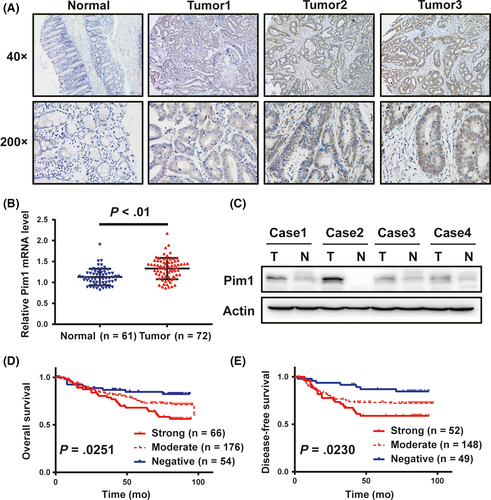
First, we conducted IHC analysis in 296 patients with CRC to determine whether Pim1 expression was altered in cancer tissues. As shown in Figure 1A, Pim1 immunoreactivity was observed in both the nucleus and the cytoplasm of tumor cells. Pim1 was significantly upregulated in 81.8% (242 of 296) of primary cancer specimens and in 24.6% (35 of 142) of normal tissue specimens. qRT-PCR and western blot assays were carried out to investigate the level of Pim1 in fresh tissue samples. Compared to those in normal mucosa, both Pim1 mRNA and protein levels were upregulated in cancer tissues (Figure 1B,C).
3.3 Correlation of Pim1 levels with clinicopathological characteristics and survival of patients with CRC
Next, we determined the correlation between Pim1 expression and clinicopathological characteristics of CRC patients (Table 1). Pim1 expression was positively correlated with tumor size (P < .01) and invasion depth (T stage, P = .018). Kaplan-Meier curves with a log-rank analysis showed a significant difference in OS and DFS among patients with different levels of Pim1 (Figure 1D,E). Patients with Pim1-positive tumors had a significantly lower OS than patients with Pim1-negative tumors (69.8% vs 83.3%). In univariate analysis, patients with Pim1-positive tumors had markedly lower DFS and OS than those with Pim1-negative tumors (DFS, HR 3.296 [95% CI 1.400-7.757]; OS, HR 2.638 [95% CI 1.231-5.654]) (Table 2). In addition, AJCC stage, T stage, N stage, and M stage were correlated with OS; and AJCC stage, T stage, and N stage were correlated with DFS. In multivariate analysis, Pim1 expression was not an independent prognostic factor for OS and DFS for CRC patients (Table 3). Collectively, these data suggest a potential promotive role of Pim1 in CRC progression.
| Parameter | n | Pim1 expression | P-value | ||
|---|---|---|---|---|---|
| Negative | Weak | Strong | |||
| Cases (n, %) | 296 | 54 (18.2) | 176 (59.5) | 66 (22.3) | |
| Age, years (n, %) | |||||
| <57 | 137 | 18 (13.1) | 86 (62.8) | 33 (24.1) | .106 |
| ≥57 | 159 | 36 (22.6) | 90 (56.6) | 33 (20.8) | |
| Gender (n, %) | |||||
| Male | 173 | 33 (19.1) | 99 (57.2) | 41 (23.7) | .646 |
| Female | 123 | 21 (17.1) | 77 (62.6) | 25 (20.3) | |
| Tumor size (n, %) | |||||
| ≤4 cm | 123 | 37 (30.1) | 65 (52.8) | 21 (17.1) | <.01a |
| >4 cm | 173 | 17 (9.8) | 111 (64.2) | 45 (26.0) | |
| T stage (n, %) | |||||
| T1-T3 | 99 | 23 (23.2) | 63 (63.6) | 13 (13.1) | .018a |
| T4 | 197 | 31 (15.7) | 113 (57.4) | 53 (26.9) | |
| N stage (n, %) | |||||
| N0 | 122 | 27 (22.1) | 73 (59.8) | 22 (18.0) | .083 |
| N1 | 94 | 19 (20.2) | 56 (59.6) | 19 (20.2) | |
| N2 | 80 | 8 (10.0) | 47 (58.8) | 25 (31.3) | |
| M stage (n, %) | |||||
| M0 | 248 | 48 (19.4) | 148 (59.7) | 52 (21.0) | .323 |
| M1 | 48 | 6 (12.5) | 28 (58.3) | 14 (29.2) | |
| AJCC stage (n, %) | |||||
| I | 24 | 4 (16.7) | 17 (70.8) | 3 (12.5) | .270 |
| II | 83 | 21 (25.3) | 48 (57.8) | 14 (16.9) | |
| III | 141 | 23 (16.3) | 83 (58.9) | 35 (24.8) | |
| IV | 48 | 6 (12.5) | 28 (58.3) | 14 (29.2) | |
| Differentiation (n, %) | |||||
| High | 17 | 3 (17.6) | 10 (58.8) | 4 (23.5) | .119 |
| Moderate | 206 | 42 (20.4) | 126 (61.2) | 38 (18.4) | |
| Low | 73 | 9 (12.3) | 40 (54.8) | 24 (32.9) | |
| Vascular invasion (n, %) | |||||
| Yes | 90 | 15 (16.7) | 54 (60.0) | 21 (23.3) | .885 |
| No | 206 | 39 (18.9) | 122 (59.2) | 45 (21.8) | |
| Ki-67 index (n, %) | |||||
| Negative | 118 | 21 (17.8) | 73 (61.9) | 24 (20.3) | .760 |
| Positive | 178 | 33 (18.5) | 103 (57.9) | 42 (23.6) | |
- AJCC, American Joint Committee on Cancer; CRC, colorectal cancer.
- a P <.05 is statistically significant.
| Variable | OS | DFS | ||
|---|---|---|---|---|
| HR (95% CI) | P-value | HR (95% CI) | P-value | |
| Pim1 expression | 2.638 (1.231-5.654) | .013a | 3.296 (1.400-7.757) | .006a |
| AJCC stage | 5.703 (3.941-8.255) | <.001a | 3.421 (1.996-5.865) | <.001a |
| T stage | 2.988 (1.828-4.882) | <.001a | 1.894 (1.279-2.804) | .001a |
| N stage | 2.457 (1.850-3.263) | <.001a | 2.026 (1.509-2.719) | <.001a |
| M stage | 10.687 (6.744-16.94) | <.001a | 1.092 (0.848-1.408) | .494 |
| Ki-67 index | 0.983 (0.785-1.231) | .882 | 0.848 (0.535-1.345) | .485 |
- AJCC, American Joint Committee on Cancer; CRC, colorectal cancer; DFS, disease-free survival; HR, hazard ratio; OS, overall survival.
- a P < .05 is statistically significant.
| Variable | OS | DFS | ||
|---|---|---|---|---|
| HR (95% CI) | P-value | HR (95% CI) | P-value | |
| Pim1 expression | 1.511 (0.697-3.276) | .295 | 2.275 (0.949-5.453) | .065 |
| AJCC stage | 4.626 (3.092-6.922) | <.001a | 2.464 (1.137-5.339) | .022a |
| T stage | 1.856 (1.132-3.044) | .014a | 1.451 (0.984-2.141) | .061 |
| N stage | 1.245 (0.901-1.718) | .184 | 1.249 (0.797-1.958) | .333 |
| Ki-67 index | 1.113 (0.887-1.396) | .354 | 1.203 (0.929-1.559) | .161 |
- AJCC, American Joint Committee on Cancer; CRC, colorectal cancer; DFS, disease-free survival; HR, hazard ratio; OS, overall survival.
- a P < .05 is statistically significant.
3.4 Pim1 is upregulated in CRC as a result of glucose deprivation by AMPK signaling
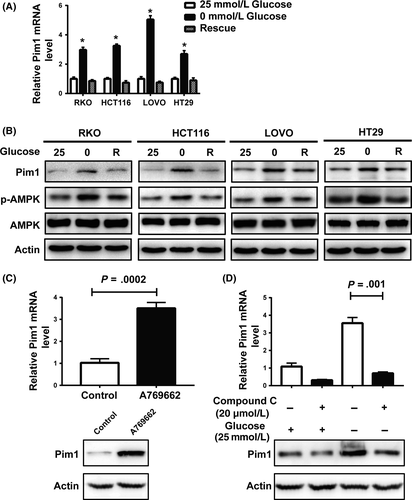
To determine whether glucose deprivation influences Pim1 expression, CRC cells were cultured with various concentrations of glucose. Pim1 mRNA (Figure 2A) and protein (Figure 2B) expression was markedly increased in response to glucose deprivation (0 mmol/L) in RKO, HCT116, LOVO and HT29 cells. In addition, this glucose deprivation-induced overexpression of Pim1 was reverted by culture in complete medium with 25 mmol/L glucose (Figure 2A,B). AMPK is known as an intracellular energy sensor, and the Thr172 phosphorylated form of AMPK indicates the severity of glucose restriction.3 Our results showed that phosphorylated AMPK and Pim1 protein expression correspondingly increased in CRC cells (Figure 2B), suggesting that AMPK may act as a mediator of the response of Pim1 under glucose deprivation conditions. In addition, treatment of A769662 (an AMPK activator) induced Pim1 expression (Figure 2C), whereas AMPK inactivation by compound C (an AMPK inhibitor) treatment significantly attenuated glucose deprivation-induced Pim1 expression (Figure 2D). Taken together, these findings suggest that Pim1 is a gene that responds to glucose deprivation at least partly through the AMPK pathway.
3.5 Determination of the efficiency of Pim1 overexpression and knockdown
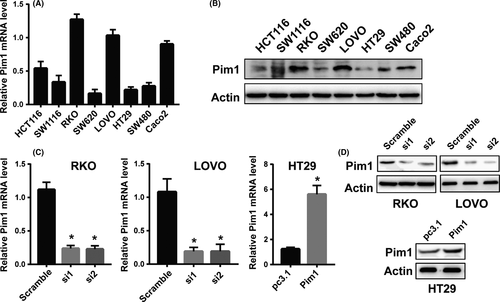
Baseline expression of Pim1 was examined in 8 CRC cancer cell lines, including HCT116, SW1116, RKO, SW620, LOVO, HT29, SW480 and Caco2, by both qRT-PCR and western blotting (Figure 3A,B). Pim1 was expressed in all 8 CRC cell lines, and its expression was relatively lower in HT29 cells and relatively higher in RKO and LOVO cells. Thus, both RKO and LOVO cells were transfected for 48 hours with siRNAs against Pim1, and HT29 cells were transfected with pc3.1-Pim1, followed by western blotting and qRT-PCR. Pim1 levels were decreased in both protein and mRNA levels in RKO and LOVO cells transfected with siRNA (Figure 3C,D). However, the mRNA and protein levels of Pim1 were significantly higher in pc3.1-Pim1-transfected HT29 cells than in the vector-transfected counterparts (Figure 3C,D).
3.6 Pim1 mediates cell proliferation in vitro and tumorigenicity in vivo
To investigate the effect of Pim1 on tumor cell proliferation, we conducted CCK8 assays. In RKO and LOVO cells, knockdown of Pim1 by siRNA effectively inhibited cell proliferation (Figure 4A). In contrast, growth of Pim1-overexpressing HT29 cells was significantly higher than that of control HT29 cells (Figure 4A). Colony formation assay showed that compared with control treatment, Pim1 knockdown inhibited colony formation in RKO and LOVO cells, whereas Pim1 overexpression promoted colony formation (Figure 4B).
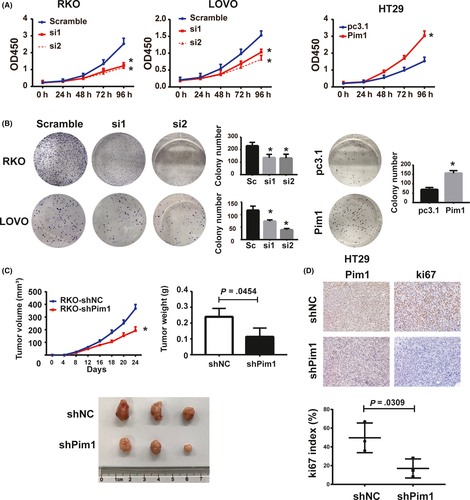
To further validate the effects observed in vivo, we s.c. injected RKO-shPim1 and control (RKO-shNC) cells into nude mice. Consistent with our results in vitro, volumes and weights of tumors formed by RKO-shPim1 cells were significantly lower than those of tumors formed by RKO-shNC cells (Figure 4C). Ki-67 index was also lower in the Pim1 knockdown groups than in the control groups (Figure 4D). Therefore, Pim1 promotes CRC tumorigenesis both in vitro and in vivo.
3.7 Altered Pim1 expression affects the Warburg effect in CRC cells
Next, we attempted to verify whether Pim1 promotes the Warburg effect in CRC cells. Pim1 knockdown decreased glucose uptake and lactate production in cells, whereas Pim1 overexpression markedly increased these phenomena (Figure 5A,C). In addition, mRNA (Figure 5B,D) and protein (Figure 5E,F) levels of HK2 and LDHA, which are key enzymes responsible for the Warburg effect, were positively regulated by Pim1 expression.
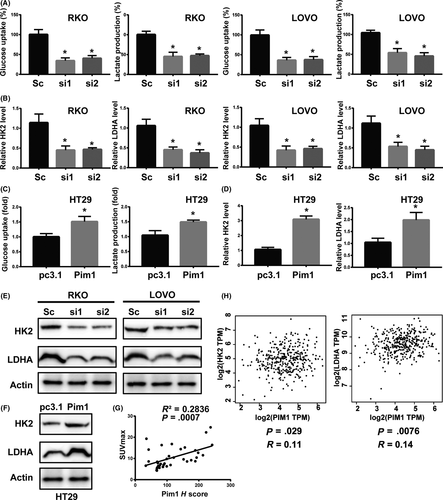
SUVmax was used as an index of 18F-FDG accumulation. To investigate the relationship between Pim1 expression and metabolism in CRC cells, we analyzed the relationship between Pim1 H scores (based on IHC) and SUVmax in 37 CRC patients. Pim1 H score was positively correlated with SUVmax (Figure 5G, R2 = 0.2836, P = .0007), suggesting that Pim1 expression was correlated with glucose uptake. Bioinformatics analysis using GEPIA (http://gepia.cancer-pku.cn/) further verified that Pim1 expression was positively related to HK2 and LDHA expression in CRC patients (Figure 5H), indicating that Pim1 enhances the Warburg effect in CRC.
3.8 Pim1 ensures CRC cell survival and resists glucose deprivation by the Warburg effect
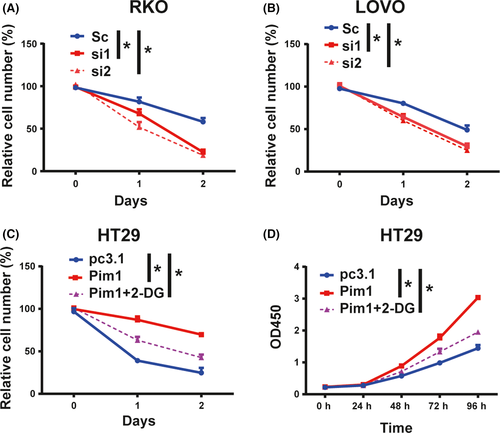
Finally, we evaluated cell viability under glucose deprivation conditions by CCK8 assay. Knockdown of Pim1 reduced cell number in the setting of glucose deprivation (Figure 6A,B). Likewise, Pim1 overexpression increased HT29 cell survival under glucose deprivation conditions (Figure 6C). However, when the Warburg effect was blocked by 2-deoxyglucose (2-DG, 5 mmol/L), Pim1-induced cell tolerance for glucose starvation was at least partially attenuated (Figure 6C). Furthermore, CCK8 assays showed that 2-DG could partially abolish Pim1 overexpression-induced cell proliferation when cells were cultured with glucose (Figure 6D). Collectively, these results suggested that Pim1 ensures CRC cell survival and resists metabolic stress by the Warburg effect.
4 DISCUSSION
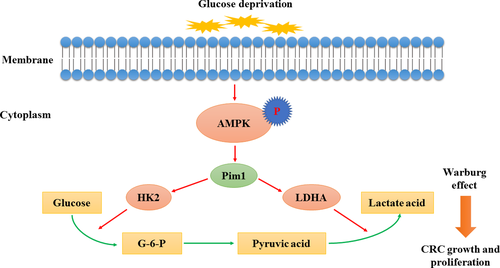
Metabolic stress is considered a common impediment to tumor growth; however, it remains unclear how cancer cells overcome metabolic stress to keep growing.3 Our study showed that Pim1 was upregulated by AMPK signaling in response to glucose deprivation, indicating that Pim1 acts as an oncogene that is responsive to glucose deprivation. Clinical observations showed that Pim1 overexpression in CRC tissues was a predictor of prognosis and that Pim1 expression had a positive relationship with 18F-FDG uptake. Further in vitro experiments indicated that Pim1 promoted the Warburg effect and that Pim1 expression was positively correlated with HK2 and LDHA expression. Finally, Pim1-silenced cells were more vulnerable to glucose starvation, and Pim1-induced tumor proliferation or tolerance to glucose starvation was attenuated by blocking of the Warburg effect. These findings provided evidence that Pim1 is overexpressed in CRC under glucose deprivation conditions and that it ameliorates metabolic stress by promoting the Warburg effect, thereby enhancing CRC progression (Figure 7).
Oncogenic PIM1 is a constitutively active serine-threonine kinase. Pim1 can promote cell cycle progression by phosphorylating CDC25A, CDC25C, p21cip1, p27kip1, and c-TAK1.14, 25-28 In addition to its essential roles in the cell cycle, Pim1 is involved in proliferation, migration, apoptosis, cell death, tumor growth, and chemotherapy response in cancer cells.16, 29, 30 Pim1 is overexpressed in many types of cancer cells, including hepatocellular cancer, prostate cancer, glioblastoma, lung cancer, breast cancer and CRC, and its overexpression is associated with tumor development and progression.13, 15-19 In the present study, we used CRC TMA containing 296 CRC patient samples and 72 fresh CRC samples. Based on our results, Pim1 was overexpressed in CRC tissues relative to that in adjacent normal tissues, and Pim1 overexpression was correlated with tumor size and invasion depth. Despite the critical role of Pim1 in cancer development and progression, there is little evidence regarding the function of Pim1 in cancer metabolism, especially in CRC.
Cancer metabolism is an important link between the tumor microenvironment and tumor progression.31 Hirayama A et al1 reported that CRC tumor tissues have much lower glucose and higher lactate levels than do normal tissues, indicating that metabolic stress plays an important role in colorectal carcinogenesis. In the present study, AMPK was activated under glucose deprivation and, in turn, upregulated Pim1 expression, suggesting that Pim1 upregulation in response to glucose deprivation may be a compensatory mechanism by which CRC cells overcome stress. For cancer cells, glycolysis is an important mechanism for the generation of energy and sustaining proliferation and aggressive features.13 Even with normal oxygen concentrations, cancer cells consume more glucose and produce more lactate than do normal cells.32 One possible explanation for this phenomenon is the overexpression of glucose transporters and enzymes in the glycolytic pathway resulting from oncogene activation.23, 33 In the present study, we found that altered Pim1 expression influenced glucose consumption and lactate production by regulating the expression of HK2 and LDHA. In addition, Pim1 expression was positively correlated with HK2 and LDHA expression in CRC tissues.
It is well established that Pim1 is closely linked with c-myc. Jongchan Kim et alreported that Pim1 promotes tumorigenicity at least in part by enhancing c-MYC transcriptional activity in prostate cancer.34 Coexpression of both Pim1 and c-myc has been observed in prostate cancer and triple-negative breast cancer.14, 35 The first identified glucose metabolism-associated gene that is directly regulated by c-myc is LDHA,36, 37 and the subsequently identified genes are GLUT1 and HK2.38, 39 Knockdown of Pim1 has also been reported to reduce glycolysis in hepatocellular carcinoma by targeting the PI3K/AKT pathway.13 These findings highlight the possible role of Pim1 in cancer metabolism.
In summary, for the first time, the present study provided critical insights into the role of Pim1 in CRC metabolism. Pim1 was upregulated in CRC tissues under conditions of glucose deprivation, which facilitated the Warburg effect in a compensatory manner to promote CRC cell survival and proliferation. Our results thus indicate a diagnostic and therapeutic role of Pim1 in CRC.
ACKNOWLEDGMENTS
This study was supported by a grant from the National Natural Science Foundation of China (81572254, 81472220, 81472222, 81772583, 81602269, 81602087 and 81272299), the Science and Technology Commission of the Shanghai Municipality (15495810300), the Shanghai Hospital Development Centre Emerging Advanced Technology joint research project (HDC12014105), the Shanghai Key Developing Disciplines (2015ZB0201), the Shanghai Science and Technology Development Fund (No. 15ZR1407400), the Domestic Science and Technology Cooperation Project (No. 14495800300) and the Hospital Foundation of Fudan University Shanghai Cancer Center (YJ201504).
CONFLICTS OF INTEREST
Authors declare no conflicts of interest for this article.


