Tobacco aquaporin NtAQP1 and human aquaporin hAQP1 contribute to single cell photosynthesis in Synechococcus
Abstract
Background Information
Aquaporins are H2O-permeable membrane protein pores. However, some aquaporins are also permeable to other substances such as CO2. In higher plants, overexpression of such aquaporins has already led to an enhanced photosynthetic performance due to improved CO2 mesophyll conductance. In this work, we investigated the effects of such aquaporins on unicellular photosynthetically active organisms, specifically cyanobacteria.
Results
Overexpression of aquaporins NtAQP1 or hAQP1 that might have a function to improve CO2 membrane permeability lead to increased photosynthesis rates in the cyanobacterium Synechococcus sp. PCC7002 as concluded by the rate of evolved O2. A shift in the Plastoquinone pool state of the cells supports our findings. Water permeable aquaporins without CO2 permeability, such as NtPIP2;1, do not have this effect.
Conclusions and Significance
We conclude that also in single cell organisms like cyanobacteria, membrane CO2 conductivity could be rate limiting and CO2-porins reduce the respective membrane resistance. We could show that besides the tobacco aquaporin NtAQP1 also the human hAQP1 most likely functions as CO2 diffusion facilitator in the photosynthesis assay.
INTRODUCTION
Photosynthesis plays a key role in earth's ecosystem as it converts inorganic carbon (Ci) to sugars, thereby generating O2 as a vital byproduct. For photosynthesis, the availability of CO2, respectively Ci, is rate limiting and thus also for the transfer of solar energy into bioavailable, chemical energy. In this regard, it is of general importance to understand the CO2 transport path from environment to the location of photosynthetic CO2 fixation.
CO2 flux across the cell membrane is passive, unlike the active transport of bicarbonate in cyanobacteria (Liu et al., 2022). The direction of CO2 flux depends on a partial pressure gradient between environment and intracellular space. However, in Cyanobacteria, the active conversion of CO2 to HCO3− in the cell via an CO2 uptake complex ensures a low intracellular CO2 concentration and promotes CO2 diffusional influx (Burnap et al., 2015). Unoccupied cell membranes (without sterols) represent only a low diffusion barrier for the small, nonpolar molecule CO2 (Itel et al., 2012; Kai & Kaldenhoff, 2014). However, it is suggested that CO2 flux across the biomembrane of cyanobacteria could also be channel-protein mediated (Burnap et al., 2015; Ding et al., 2013; Hagemann et al., 2021; Tchernov et al., 2001). This is because usually numerous membrane proteins are integrated in or attached to biomembranes. In addition, the incorporation of, for example, cholesterols into the membrane also represents a barrier for CO2 diffusion (Cooper et al., 2015; Itel et al., 2012; Kai & Kaldenhoff, 2014). Aquaporins, are membrane proteins and largely known for their function as water pores. For some human and plant aquaporins a CO2 permeability function has been proposed (Heckwolf et al., 2011; Mori et al., 2014; Nakhoul et al., 1998; Uehlein et al., 2003; Xu et al., 2018). Therefore, it is not surprising that CO2-permeable aquaporins could also be found in cyanobacteria. However, the scientific literature in this regard is restricted (Ding et al., 2013; Tchernov et al., 2001). The question arises whether a possible CO2 membrane diffusion facilitator could have an effect in a single cell organism respectively microalgae such as Synechococcus sp. PCC7002 that in addition, already possesses a CO2 concentration mechanism. In aqueous solutions, inorganic carbon (Ci) enters these cells as bicarbonate (HCO3−) or CO2, whereby the CO2 flow into the cell is only half as great as the HCO3− transport (Sültemeyer et al., 1995). Cyanobacteria have adapted to fluctuating CO2 and Ci concentrations, which often occur in marine environment (Badger et al., 2005) by developing a CO2 concentration mechanism (CCM). At high CO2 concentrations, a basic level of constitutive bicarbonate transporters, such as BicA, and a CO2 conversion complex called Ndh1-4 (also referred to as CO2 uptake complex) is active, especially in Synechococcus sp. PCC7002. In this stage cells have a moderate affinity for the respective substrates (Ohkawa et al., 2000; Price et al., 2004; Shibata et al., 2001). At low CO2 concentrations, additional HCO3− -transporters like SbtA and porB and the CO2 uptake complex Ndh1-3 are induced having a higher substrate affinity (Ohkawa et al., 2000; Price et al., 2004; Shibata et al., 2001). Thus, the lower amount of Ci can be captured more effectively.
In cyanobacteria, HCO3− transport by bicarbonate transporters occurs actively and requires ATP or Na+ symport (Omata et al., 1999; Price et al., 2004; Shibata et al., 2002; Woodger et al., 2007). CO2 enters the cell by diffusion. It is converted to HCO3− by CO2 uptake complexes of the CCM at the thylakoid membrane (Schuller et al., 2020; Xu et al., 2008; Zhang et al., 2004). Together, intracellular HCO3− concentrations 100–1000 times higher than environmental can be achieved (Badger et al., 1985; Miller & Colman, 1980). The accumulated HCO3− migrates into carboxysomes—polyhedral microcompartments—through charged pores in the carboxysomal shell. These pores are formed by specific proteins that build the envelope of the carboxysomes. Furthermore, due to these proteins, the envelope is almost impermeable to CO2 and O2. (Kinney et al., 2011) The carboxysomes contain Ribulose-1,5-bisphosphatcarboxylase/-oxygenase (RuBisCO) as well as carbonic anhydrases (CA), which catalyze the hydration of CO2 + H2O to HCO3− + H+ and the backreaction. Hence, in carboxysomes a rapid re-equilibration of HCO3− and CO2 is ensured. The resulting high CO2 concentration in carboxysomes leads to a high CO2 partial pressure close to RuBisCO (Price et al., 1998). As a result, photorespiration is reduced (Qian et al., 2017) and the photosynthesis rate is high.
Further enhancing the CO2 fixation rate may lead to improved biomass production or growth rate. An increased CO2 fixation rate can be achieved, for example, by elevated CO2 availability in the carboxysomes or a generally improved intracellular Ci availability. When the bicarbonate transporters BicA and SbtA were overexpressed, an increased biomass production was observed (Gupta et al., 2020; Kamennaya et al., 2015). In general, the influence of bicarbonate transporters on photosynthesis and other physiological processes such as growth or biomass production in cyanobacteria has been carefully examined (Gupta et al., 2020; Kamennaya et al., 2015; Price et al., 2004; Woodger et al., 2007).
For CO2 permeable aquaporins, it was demonstrated in plants that the knock-out or integration of foreign and overexpression of native CO2-permeable aquaporins has an impact on the CO2 flux rate across the membrane (Bi et al., 2015; Flexas et al., 2006; Heckwolf et al., 2011; Uehlein et al., 2003; Xu et al., 2018). This affected photosynthesis rates. Since CO2 availability limits photosynthesis, it is proposed that the improved CO2 diffusion by overexpression of CO2 permeable aquaporins is the reason for increased photosynthesis rates.
In this study, we aimed to investigate the effect of enhanced aquaporin-mediated CO2 flux across the membrane on photosynthesis and other physiological processes in unicellular cyanobacteria. For this purpose, the cyanobacterium Synechococcus sp. PCC7002 was transformed with genes for CO2 permeable aquaporins from human (hAQP1, Nakhoul et al., 1998) or tobacco (NtAQP1, Uehlein et al., 2003) as well as the water diffusion facilitator NtPIP2;1 that has been shown to be CO2 impermeable (Kai & Kaldenhoff, 2014). Synechococcus sp. PCC7002 has one endogenous aquaporin, AQP Z (ACB00406.1), with uncertain function regarding CO2 diffusion. There is evidence of CO2 permeability for AQP Z in strain Synechococcus sp. PCC7942 (Ding et al., 2013; Tchernov et al., 2001).
METHODS
Plasmid construction
Plasmids were generated using In-Fusion® HD Cloning Kit (TaKaRa Bio Europe, St-Germain-en-Laye, France). Plasmid pBK47_pcpc560_NS_2_kanR_GFP (Kachel & Mack, 2020) was used as vector. The plasmid allows integration into “neutral site 2” (Ruffing et al., 2016) of Synechococcus sp. PCC7002 genome and gene expression under control of the “super strong” cpc560 promoter (Zhou et al., 2014). The cDNA from ntaqp1, ntpip2;1, and haqp1 was introduced as an insert to replace vector sfgfp gene. (The cDNA for tobacco aquaporins was obtained from mRNA of tobacco leaves. hAQP1 cDNA was purchased from ImaGene Gmbh.) Selection was done in 100 µg/mL ampicillin.
Synechococcus sp. PCC7002 transformation
Total 400 µL of cells in exponential growth phase (concentrated to OD730nm 2.5) were mixed with 200 ng of plasmid DNA and incubated in the dark for 5 h at 37°C. The cells were spread on A+ agar plates without antibiotics and incubated at 30°C and 150 µmol/(m2*s) white light. After 40 h incubation, 1 mL kanamycin (2.5 mg/mL) was added to the agar for selection of transformed cells. Cells were incubated for another 10 days (Kachel & Mack, 2020; Stevens & Porter, 1980, modified). Integration was verified by PCR.
Cell cultivation and growth curves
Strain Synechococcus sp. PCC7002 was used throughout the experiments (kindly provided by Kachel and Mack, 2020). In a 500 mL bubble column bioreactor, cells cultured in A+ medium (Stevens et al., 1973) at 30°C with 250 µmol/(m2*s) white light (measured in PAR/photosynthetically active radiation) were aerated with air containing 1% CO2. Transformed cells were grown in medium supplemented with 100 µg/mL kanamycin. OD730nm, cell count/mL (Neubauer chamber), dry weight and chlorophyll a content were determined in triplicate. Cryostocks were prepared by freezing a cell suspension with 5% DMSO in liquid nitrogen and storage at −80°C (Kachel & Mack, 2020).
Chlorophyll a quantification
Chlorophyll a was extracted by a modified protocol of Palmqvist and Sundberg (2002). 1 mL of cell suspension (OD730nm < 2.5) was centrifuged at 7500 × g for 10 min and cells were washed with ddH2O. A spatula tip of each MgCO3 and glassbeads (Ø 0.5 mm) as well as 1 mL of methanol was added. Cells were disrupted in a BeatBlaster24 (Benchmark Scientific, Sayreville, NJ) at 7000 m/s for 2 cycles of 30 s each, with a 10-s break in between. The mixture was incubated at 60°C for 10 min. Cell debris were centrifuged at 7500 × g for 5 min. OD of supernatant was measured at 665 and 730 nm (FoodALYT Photometer Extra, OMNILAB-Laborzentrum, Bremen, Germany). Chlorophyll a content was calculated following equation Chla [µg/mL] = 12.9447*(A665nm−A730nm) (Ritchie, 2006). For comparability, chlorophyll a contents were normalized per OD730nm of cell suspension.
qPCR
For RNA extraction, cells in exponential growth phase were harvested by centrifugation at 3500 × g for 15 min, frozen in liquid nitrogen and freeze-dried. Total 100 mg of freeze-dried cells were grinded in liquid nitrogen. The powder was diluted in 1 mL lysis buffer of SpectrumTM plant total RNA kit (Sigma-Aldrich, St. Louis, MO) or according to Sokolovsky et al. (1990). RNA was further isolated following the instructions of the kit or a slightly modified protocol given in Sokolovsky et al. (1990). DNA impurities were removed using DNase I. Successful isolation was visualized in a 1 % MEN-agarose gel (10x MEN-buffer: 0.2 M MOPS, 0.01 M EDTA, 0.05 M Sodium citrate). cDNA was prepared according to the protocol provided by New England Biolabs for M-MuLV-RT (#M0253) or RNA was used directly for RT-qRT-PCR. For quantitative analysis of transcript levels, 2x qPCRBIO SyGreen Mix Hi-ROX or qPCRBIO SyGreen 1-Step Detect Hi-ROX Mix (both PCR Biosystems Ltd, London, UK) and the Step One Real-Time PCR system (Applied Biosystems, Waltham, MA) were used. Normalization was performed by amplification of secA (and ppC) (according to Szekeres et al., 2014). Expression levels were given in relation to that of controls. Mean control ΔCT value was used for calculation of ΔΔCT values (n = 10). Primers sequences are listed in a table as supplement.
Measurement of oxygen concentration
To determine changes in O2 concentration, an O2 sensitive optode was used with a sensing foil. Its fluorescence is quenched according to O2 concentration. Cells were inoculated one day prior to measurements and grown to OD730nm≈2. OD730 nm, cell count/mL as well as chlorophyll a content was determined right before the measurement. Glass cuvettes with glued-in O2 sensor foil (SF-RPSu4, PreSens Precision Sensing GmbH, Regensburg, Germany) were filled with 3.8 mL of cell suspension and sealed by lids using silicone grease. After 40 min of dark incubation, the cuvette containing the cyanobacteria was positioned in front of the detector unit DU01 and a time measurement was started using VisiSens™ AnalytiCal 1 software (PreSens Precision Sensing GmbH). Light was turned on and fluorescence was detected every 3 min (light was turned off for O2 detection 20 s prior to each measurement). The cells were kept at 30°C throughout. Fluorescence levels were evaluated using VisiSens™ AnalytiCal 1 software. The slope of the change in O2 concentration during the first 9 min of illumination was calculated (= O2 production rate) and plotted against the illumination level of 0, 100, 190, 290, 510, 715, 840, 1140, 1300, or 1480 µmol/m2/s (measured in A+ medium using a US-SQS/L Sensor from Walz). In the light-limited period of photosynthesis between 0 and 290 µmol/(m2*s), the increase in O2 production rates with increasing light intensity was then calculated as a slope for the PI curves ( and is mentioned in the results section. Calibration was done with ambient air (O2 saturation: 100 %), a gas mixture containing 40% O2 (O2 saturation: 190.5 %) or 10 g/L Na2SO3 (O2 saturation: 0 %).
77K Fluorescence spectra
To record 77 K fluorescence spectra, 4 mL cell-suspension at early exponential growth phase were dark-incubated for 40 min and illuminated at 210 µmol/(m2*s) white light for 5 min. 4 mL of 0.5 M potassium phosphate buffer (pH 6.8) was added (Joshua & Mullineaux, 2004; Mullineaux, 1993). The cells were illuminated for another 5 min, centrifuged at 900 × g for 5 min and resuspended in 1.6 mL potassium phosphate buffer (OD730nm 1.6). The suspension was mixed with 2.4 mL of 86% glycerol and 2 mL of the mix were frozen in a plastic cuvette in liquid N2. Emission spectra were recorded in a Jasco-FP-6500 upon excitation at 550 and 440 nm. At the same time, the OD730nm was measured in a photometer for normalization. Each sample was measured five times, mean value was calculated, and the rolling average determined. The data are represented relative to the emission at 640 nm and the values of three recorded samples each were averaged.
Curve fitting
Pn is the net-O2-production rate, α is the initial slope of the curve, I is the photon flux density (illumination level), Pmax is the potential light-saturated maximum net-O2-production rate, ξ is a parameter for the convexity of the curve and Rd is the dark respiration rate. The parameters α, ξ, and Pmax were optimized using the solver add in of Excel to minimize chi2 (R2 ≥ 0.91). Growth curves were fitted in the same way using the Gompertz function (R2 ≥ 0.94, n = 3 for 1 % CO2 and R2 ≥ 0.86, n = 2 for air).
Data analysis
Data sets were tested for normal distribution and variance homogeneity. Statistically significant differences were analyzed respectively by students-t-, Welch´s-t-, Mann–Whitney U or Kruskal–Wallis test. (More details of the statistical test used and the exact significance level can be found in the supplementary.) Data are expressed as means ± SE.
RESULTS
The effect of heterologous aquaporin expression on photosynthesis was analyzed by comparative O2 release determination. As expected, oxygen content in the cuvette slightly decreased in the dark and steadily increased for at least 20 min until it reached a plateau under illumination (see Figure S1).
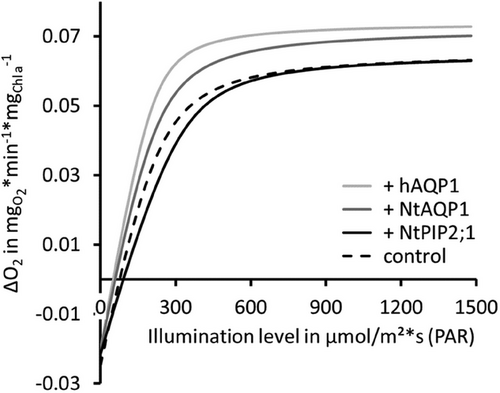
For photosynthesis-irradiance curves (PI-curves, Figure 1) OD730nm, cell count and chlorophyll a content was also determined. Chlorophyll a content of controls and the aquaporin transformant samples were highly similar (+hAQP1 6.34 ±0.33 µg/mL, +NtAQP1 6.52 ±0.30 µg/mL, +NtPIP2;1 6.38 ±0.19 µg/mL, control 5.98 ±0.29 µg/mL (n≥12, p ≥ 0.192)). Dark respiration rate in transformants equals that of controls (p ≥ 0.167). As expected for PI-curves, in the light-limited period of photosynthesis (between 0 and 290 µmol/(m2*s)), a linear increase of net O2 production rates with increasing light levels was registered. The slope of this increase in O2 production rate was calculated for each cell line. Here, the steepest slope was 0.0003 for +hAQP1. For +NtAQP1 the slope was 0.00027, for the control 0.00024 and for +NtPIP2;1 0.0002. In addition, we compared mean net O2 production rates to (maximum) values of controls (Table 1). It revealed a 41%–71% higher net O2 production rate for +hAQP1 at illumination levels 290 and 190 µmol/(m2*s) respectively (p ≤ 0.006). For +NtAQP1, no increase was detected in the light limited stage of photosynthesis (100–290 µmol/(m2*s), p ≥ 0.087). However, mean values of net O2 production rates were 11%–27% increased. Light compensation points for +NtAQP1 or +hAQP1 were shifted toward lower illumination, while that of +NtPIP2;1 required higher light intensity.
| 0 µmol/(m2*s) (n ≥ 20) | 100 µmol/(m2*s) (n ≥ 20) | 190 µmol/(m2*s) (n ≥ 20) | 290 µmol/(m2*s) (n ≥ 20) | 510–1480 µmol/(m2*s)(n ≥ 120) | |
|---|---|---|---|---|---|
| + hAQP1 | −33.3 (± 0.6) % a | 23.3 (± 5.4) % b,d | 78.1 (± 5.7) % e (+71 %) | 104.2 (± 8.0) % h,i,j (+ 41 %) | 119.7 (± 4.9) % j,l (+20 %) |
| + NtAQP1 | −34.1 (± 0.7) % a | 14.6 (± 3.9) % b (+11 %) | 57.7 (± 5.1) % f (+26 %) | 94.1 (± 9.4) % e,h,j (+ 27 %) | 115.1 (± 3.3) % i,l (+15 %) |
| + NtPIP2;1 | −35.4 (± 1.3) % a | −4.4 (± 2.4) % c | 35.4 (± 7.8) % d,g | 56.8 (± 6.5) % f,k | 102.8 (± 3.8) % h |
| control | −40.7 (± 5.0) % a | 13.1 (± 4.3) % b | 45.7 (± 6.1) % f,g | 74.0 (± 6.1) % e,k | 100.0 (± 2.8) % h |
Above 510 µmol/(m2*s) further increase of the illumination level did not increase net O2-production rates. It was assumed that at 510 µmol/(m2*s) the light saturated stage of photosynthesis was reached. Therefore, all strains were compared regarding their respective average net O2 production rate within illumination levels of 510–1480 µmol/(m2s) (Table 1). According to this, the maximum net O2-production rate of +hAQP1 was increased by 20% (p = 0.021) and that of +NtAQP1 by about 15% (p < 0.001) compared to controls.
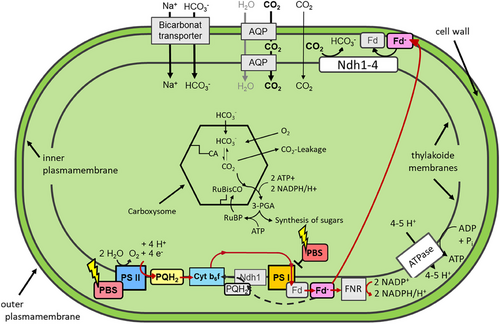
After interpretation of the obtained data and considering known photosynthetic CO2 pathways in Synechococcus we build a hypothesis that could explain the function of CO2 permeable aquaporins in our approach (Figure 2). CO2-permeable aquaporins increase membrane CO2 diffusion rates. Consequently, conversion rate of the CO2 uptake complex (Ndh1-4) is increased. Additional reduced ferredoxin (Fd−) is required for this, which is produced by the linear electron transport pathway via PSII. This causes a decreased local accumulation of reduction equivalents NADPH or Fd−. As a result, less reduced plastoquinone accumulates at the Cytochrome b6f complex. The latter triggers a so-called state transition of phycobilisomes (light harvesting antennae complex of cyanobacteria), which then transmit more of the captured light energy to PSII. This results in increased PSII efficiency and higher O2 production compared to controls.
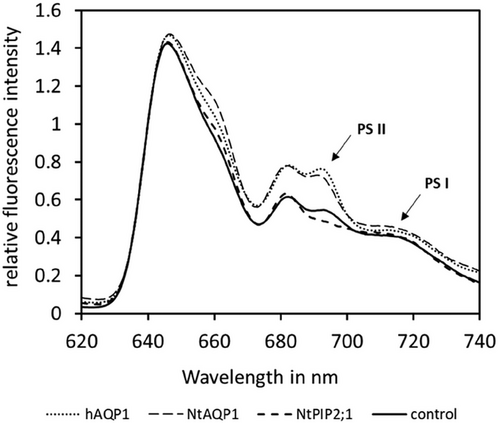
To investigate this, the light transmittance distribution of Phycobilisomes to PSI or PSII was determined by 77 K fluorescence spectra (Figure 3). Ratio of PSII/PSI fluorescence (695/715 nm) was increased for +NtAQP1 and +hAQP1, while it decreased for +NtPIP2;1 compared to the control. This indicates that a state transition towards PSII occurs in +NtAQP1 and +hAQP1 and one to PSI in +NtPIP2;1, which explains the different O2-Producion rates in light limited photosynthesis.
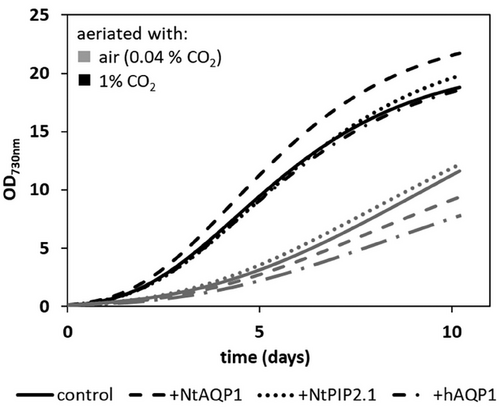
Because the expression of specific aquaporins in Synechococcus sp. has significant effects on photosynthesis, it is of interest to estimate the expression levels of related genes as well as that of the heterologous aquaporins. Consequently, relative transcript levels of RuBisCO large subunit (RbcL), the (inducible) Bicarbonate-transporters BicA, SbtA & porB, NdhF3, a subunit of the inducible CO2 uptake complex, as well as those of endogenous (AQP Z) and foreign aquaporins were determined (Figures S2 and S3). In General, no changes in relative RNA levels of endogenous genes could be observed in the transformants. However, for +NtAQP1 a slight decrease in average RNA-levels of BicA and NdhF3 to about 0.74-fold was observed, which was considered as fluctuation. From these results we concluded that the heterologous production of aquaporins has no influence on the expression levels of other photosynthesis-related genes and that of the CCM. Thus, for example, the general CO2-affinity of the CO2 uptake complexes should be comparable in all cell lines. Expression levels of the heterologous aquaporins hAQP1, NtAQP1, and NtPIP2;1 were respectively 181, 198, or 338 times higher than that of the reference gene secA in the corresponding transformant (Figure S3). Despite the altered photosynthesis rates, overexpression of these aquaporin genes had no significant positive or negative effect on biomass production or growth rate determined by OD730nm (Figure 4), cell count (not shown), dry mass (not shown) or chlorophyll a content (not shown) regardless of whether the cells were aeriated with 1% CO2 or air.
DISCUSSION
We assumed the hypothesis that the integration of CO2 porins such as NtAQP1 increase net photosynthesis rates also in single cell organisms, whereas pure aquaporins, such as NtPIP2;1, facilitating the diffusion of water only, do not. A prerequisite to observe such differences in cells with CO2-porins compared to controls is that CO2 membrane diffusion rates limit the availability of CO2 at the site of carbon fixation. Under these conditions, it is possible to test the CO2 diffusion facilitation function of other aquaporins. Since, in the case of human AQP1, this function is still under debate, we included investigation of hAQP1 overexpressing Synechococcus sp. PCC7002. As a first confirmation of our hypothesis and a possible CO2-porin function of hAQP1, we observed improved O2 production rates in light limited and light saturated phases of photosynthesis (Figure 1 and Table 1) when the gene for NtAQP1 or hAQP1 was expressed. There is evidence that hAQP1, in contrast to NtAQP1, has a double function as a CO2 and water permeable pore (Kai & Kaldenhoff, 2014; Nakhoul et al., 1998). In this study, there was no significant difference between +hAQP1 and +NtAQP1 in O2 production rates (p = 0.814). From this we conclude that the possible H2O permeability of hAQP1 had no direct influence on the increased O2 production rates in +hAQP1.
For evaluation of the results, it must be considered that O2 production rates, as obtained herein by the oxygen optode, provide some information about net photosynthesis rates because oxygen evolves during the light reaction of photosynthesis by H2O photolysis. However, not the entire electrons obtained are used for reduction of CO2. Instead, these could be transmitted from PSI to, for example, terminal oxidases in the respiration pathway and vice versa (Liu et al., 2012). Therefore, the relation between evolved oxygen and CO2 fixation is not one by one, it can vary depending on the reducing reaction.
The common picture about Ci acquisition in Synechococcus is that in the so called carboxysomes elevated cellular CO2 availability improves CO2 fixation rates. CO2 availability in carboxysomes depends on the overall influx of Ci into the cell. Intracellular CO2 is actively converted to HCO3− at the thylakoid membrane by CO2 uptake complexes. This retains the apparent low intracellular CO2 concentration and the CO2 partial pressure gradient (outside vs. inside the cell) and promotes passive CO2 influx. However, the cells total Ci concentration is high due to the concentration of HCO3− inside the cell.
Our data support the notion that cellular CO2 diffusion is limited by cell-membranes and that the expression of the gene for NtAQP1 as well as hAQP1, that had been shown to be CO2 permeable in vitro, facilitate it. NtPIP2;1, which was found to be exclusively H2O permeable, didn't show this effect and was like controls. The increased CO2 diffusion rates in the former strains probably lead to increased internal HCO3− rates by conversion of the CO2 uptake complexes.
Reduced Ferredoxin, the proposed electron donor for the conversion, is mainly generated during linear electron transport (LET) in the light-driven part of photosynthesis, involving PSII. It is usually employed to support NADPH for the Calvin cycle. In case of increased CO2 diffusion, the demand of reduced Ferredoxin also grows (see Figure 2). Consequently, photosynthesis favors LET instead of cyclic electron transport (CET). This results in less accumulation of reduced plastoquinol at the Cyt b6f complex and a more oxidative redox state of the plastoquinol pool. Plastoquinol oxidation is known to trigger a state transition of phycobilisomes from PSI to PSII, which can be measured. It was found to be in favor of PSII in NtAQP1 as well as hAQP1 producing cells (Figure 3). The improved LET explains the increased O2 production rate of +hAQP1 in the light-limited region of photosynthesis by 41%–71%. For +NtAQP1, a similar tendency was observed in the light-limited region and an increase of 15% O2 production rate in light saturation conditions could be detected. In contrast, for +NtPIP2;1, no change in O2 production rate was measured except for a slight decrease under illumination level of 100 µmol/(m2*s). This findings support the notion that bio-membrane integration of CO2 impermeable proteins could not significantly reduce the comparably low CO2 diffusion rates in specific cells because the lipid bilayer is often occupied by proteins as well as sterols (Kai & Kaldenhoff, 2014).
Cellular Ci concentrations are generally detected via secondary messengers such as cAMP or c-di-AMP, NADP+, Calvin cycle- (3-PG, 2-PG and RuBP) or TCA cycle-products (2-OG) which then inhibit or activate regulators of the inducible CCM components, such as NdhR (CcmR), CmpR, Sbtb, or cyABrB2 (Daley et al., 2012; Hagemann et al., 2021; Mantovani et al., 2022; Orf et al., 2016; Woodger et al., 2007). In wild-type Synechococcus sp. PCC7002, a decrease in Ci-affinity (by downregulation of CCM inducible components) has been observed at CO2 concentrations equivalent to that of air (Sültemeyer et al., 1995). Since the cells were aerated by 1% CO2, no regulation of the CCM was expected for controls and transformants +NtAQP1 or +hAQP1. Just in case of +NtPIP2.1 an upregulation of the respective genes could be possible. However, this was not observed (Figure S2) presumably because, due to 1% CO2 aeriation, the intracellular Ci concentrations were still in a range that did not trigger a change in expression of the genes for the respective CCM components.
In earlier studies with transgenic plants, we were able to observe improved growth when CO2 availability was improved due to incorporation of CO2-permeable aquaporins in the cell membrane (Uehlein et al., 2003). This was not the case in cyanobacteria (Figure 4). This could be because, for example, the increased CO2 availability due to the increased CO2 conversion at the CO2-uptake complex limits the availability of the reduction equivalents (reduced ferredoxin or NADPH) for the Calvin cycle itself. Therefore, the energy gain during photosynthesis could be similar to the control and lead to similar growth rates.
Taken together our data support the notion that (i) cell-membrane CO2 diffusion in Synechococcus is rate limiting, (ii) the plant aquaporin NtAQP1 from tobacco also functions in the single cell organism Synechococcus as CO2 diffusion facilitator, (iii) hAQP1 has a comparable function, (iv) even for organisms with a CCM, photosynthesis is limited by CO2 diffusion rates and could be improved by increasing these, (v) expression of membrane proteins that do not increase membrane CO2 diffusion do not show this effect, and (vi) gene expression of CCM related genes as well as growth rates were only slightly affected by overexpression of the genes under investigation.
AUTHOR CONTRIBUTIONS
Franziska M. Joseph conducted all experiments. Ralf Kaldenhoff and Franziska M. Joseph designed experiments and wrote manuscript.
ACKNOWLEDGMENTS
We thank C. Büchel and N. Herrmann, Goethe University Frankfurt, Germany for help on 77 K fluorescence spectra. For the supply of the Synechococcus strain and plasmid, we are indebted to B. Kachel and M. Mack, Mannheim University of Applied Sciences, Germany. Furthermore, we are grateful for advice and discussion to B. Otto and N. T. Tran from our research group.
Open access funding enabled and organized by Projekt DEAL.
CONFLICT OF INTEREST STATEMENT
There are no competing interests.
Open Research
DATA AVAILABILITY STATEMENT
The datasets used and/or analyzed during the current study are available in the supplementary.


