Identification of chronic urticaria subtypes using machine learning algorithms
Murat Türk and Ragıp Ertaş authors contributed equally to this work.
Funding information
None.
Chronic urticaria (CU) comes as chronic spontaneous urticaria (CSU) and chronic inducible urticaria (CIndU).1 Across its types and subtypes, CU is a heterogeneous disease that has different phenotypes with distinct clinical characteristics and different endotypes with distinct underlying pathophysiological mechanisms.2, 3 It may be possible that subtypes of CU patients exhibit distinct phenotypic disease signatures that can point to differences in what drives their condition and in their response to treatments. Cluster analysis is a popular unsupervised machine learning (ML) method for discovering previously undetected data patterns.4 ML-based cluster analysis has been used in several diseases for the identification and characterization of patient subgroups.5, 6 As of now, no study has attempted to identify CU subtypes with this method. Here, we performed a proof-of-concept study to test whether cluster analysis using ML algorithms can identify subgroups of CU patients based on clinical and routine laboratory characteristics.
We retrospectively analyzed the medical charts of a cohort of 431 CU patients. Institutional review board was obtained, and due to retrospective nature of the study, patient consent was not required. ML-based k-means clustering with principal component silhouette analyses (PCA) and use of the elbow method of dimensionally reduced data showed 4 clusters of CU patients, with a homogeneous balance between the clusters and the selected evaluation metrics (methods are provided in supplementary material) (Figure S3). Clustering analyses with PCA resulted in more meaningful clusters than without and supported the positive impact of reduced dimensions, and cluster number identified. Cluster characteristics and comparisons identified clinically distinct patient subgroups (Table 1).
| All patients n = 337 (100%) | Cluster 1 n = 25 (7.4%) | Cluster 2 n = 142 (42.1%) | Cluster 3 n = 128 (38%) | Cluster 4 n = 42 (12.5%) | p-value* | |
|---|---|---|---|---|---|---|
| CSU; n (%) | 312 (93) | 0 (0)a | 142 (100)b | 128 (100)b | 42 (100)b | <0.001 |
| CIndU; n (%) | 172 (51) | 25 (100)a | 69 (49)b | 72 (56)b | 6 (14)c | <0.001 |
| Angioedema; n (%) | 198 (59) | 12 (48)a,b | 56 (39)b | 99 (77)c | 31 (74)a,c | <0.001 |
| Median age in years (IQR) | 39 (28–49) | 42 (28–51)a | 3 (29–48)a | 41 (29–50)a | 38 (26–46)a | 0.481 |
| Female gender; n (%) | 237 (70) | 16 (64)a,b | 71 (50)b | 117 (92)c | 33 (79)a,c | <0.001 |
| CU duration; months (IQR) | 24 (9–76) | 12 (5–96)a,b | 36 (12–96)a | 18 (9–50)b | 24 (6–120)a,b | 0.039 |
| Family history; n (%) | 72 (21) | 6 (24)a,b | 20 (14)b | 37 (29)a | 9 (21)a,b | 0.03 |
| Triggering factor(s); n (%) | 262 (78) | 18 (72)a | 115 (81)a | 95 (74)a | 34 (81)a | 0.474 |
| IgE; IU/ml (IQR) | 102 (38–226) | 75 (35–189)a,b | 132 (56–272)a | 84 (23–167)b | 93 (26–203)a,b | 0.005 |
| IgG-anti-TPO positivity; n (%) | 68 (20) | 4 (16)a,b,c | 6 (4.2)c | 51 (40)b | 7 (17)a | <0.001 |
| ANA positivity; n (%) | 82 (24) | 2 (8)a,b | 2 (1.4)b | 67 (52)c | 11 (26)a | <0.001 |
| Hypertension; n (%) | 37 (11) | 5 (20)a | 0 (0)b | 1 (1)b | 31 (74)c | <0.001 |
| Diabetes mellitus; n (%) | 45 (14) | 3 (12)a | 12 (9)a | 4 (3)a | 26 (62)b | <0.001 |
| Hypothyroidism; n (%) | 64 (19) | 6 (24)a,b | 19 (13)b | 23 (18)a | 16 (38)a,b | 0.004 |
| Psychiatric disease; n (%) | 115 (34) | 10 (40)a,b | 57 (40)b | 30 (23)a | 18 (43)a,b | 0.014 |
| Rheum. disease; n (%) | 57 (17) | 5 (20)a | 28 (20)a | 17 (13)a | 7 (17)a | 0.538 |
| Atopic dermatitis; n (%) | 12 (4) | 0 (0)a,b | 11 (8)b | 1 (1)a | 0 (0)a,b | 0.006 |
| Asthma; n (%) | 57 (17) | 5 (20)a | 22 (16)a | 20 (16)a | 10 (24)a | 0.584 |
Note
- *p-value from Kruskal-Wallis H test or Pearson chi-square analysis between the 4 clusters. Each superscript letter (a, b, and c) denotes pairwise comparisons between clusters and shows that the columns with the same letters in a line do not differ significantly from each other at the 0.05 level.
- Abbreviations: ANA, antinuclear antibodies; CIndU, chronic inducible urticaria; CSU, chronic spontaneous urticaria; CU, chronic urticaria; IgE, serum total IgE level; IQR, interquartile range; TPO, thyroid peroxidase.
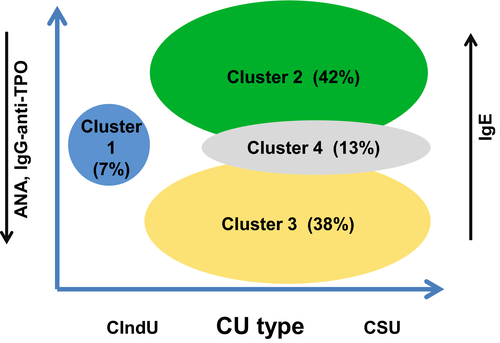
Cluster 1 (The “CIndU only” cluster) was the smallest cluster and consisted of all and only CIndU patients who did not have comorbid CSU. Of all clusters, cluster 1 patients had the highest age [median 42 (28–51) years], the shortest duration of disease [12 (5–96) months], and the lowest IgE levels [74.6 (35.1–188.5) IU/ml].
Cluster 2 (The “high IgE” cluster) was the largest cluster. All patients had CSU, and half of them had comorbid CIndU. Cluster 2 patients, on average, had the highest IgE levels [132 (56.4–271.5) IU/ml], the highest rate of comorbid atopic dermatitis (7.7%), and the lowest rate of ANA and IgG-anti-TPO positivity (1.4% and 4.2%, respectively).
Cluster 3 (The “autoimmune” cluster) had the highest percentage of women (92%) in all clusters. All patients had CSU, and more than half also had CIndU (56.3%). Three of four patients (77.3%) had angioedema, the highest percentage of any cluster. Cluster 3 patients also had the second-lowest IgE levels (84.2 IU/ml) of any CSU cluster and the highest rates of IgG-anti-TPO and ANA positivity across all clusters (39.8% and 52.3%, respectively).
Cluster 4 (The “high comorbidity” cluster) consisted only of CSU patients, and comorbid CIndU was rare (14.3%). The defining characteristics of patients in this cluster, the high comorbidity cluster, were their high rates of hypertension (74%), diabetes mellitus (62%), and hypothyroidism (38%), each at least twice as high as in any other cluster.
The results of our study provide proof of concept that the use of unsupervised ML algorithms can identify meaningful and distinct groups of patients with CU and cluster CU into four different and distinct subtypes. Three of these four clusters are remarkably similar to how patients with CU are classified in real life, that is, as having CIndU or CSU as their primary form of CU and, in the latter, as having autoimmune or autoallergic CSU (Figure 1). This suggests that ML-based algorithms can be used to establish patient signatures, which may then be used to better characterize relevant and distinct pathomechanisms of CU subgroups. This, in turn, will allow us to better manage CU, by optimizing the use of available treatments and guiding the development of new and better ones.

ACKNOWLEDGEMENTS
This project benefitted from the support (non-financial) of the GA2LEN network of urticaria centers of reference and excellence (UCARE, www.ga2len-ucare.com).
CONFLICT OF INTEREST
MT has no relevant conflict of interest in relation to this work. Outside of it, MT is or recently was a speaker and/or advisor for Novartis. RE has no relevant conflict of interest in relation to this work. Outside of it, RE is or recently was a speaker and/or advisor for Novartis. EZ, YT, MA, and AG have no conflict of interest. MM has no relevant conflicts of interest in relation to this work. Outside of it, MM is or recently was a speaker and/or advisor for and/or has received research funding from Allakos, Amgen, Aralez, ArgenX, AstraZeneca, Celldex, Centogene, CSL Behring, FAES, Genentech, GIInnovation, Innate Pharma, Kyowa Kirin, Leo Pharma, Lilly, Menarini, Moxie, Novartis, Roche, Sanofi/Regeneron, Third HarmonicBio, UCB, and Uriach.


