A comprehensive study of alternative splicing in malignant pleural mesothelioma identifies potential therapeutic targets in a new cluster with poor survival
Abstract
Background
Malignant pleural mesothelioma (MPM) is one of the most aggressive tumors with few effective treatments worldwide. It has been suggested that alternative splicing at the transcriptome level plays an indispensable role in MPM.
Methods
We analyzed the splicing profile of 84 MPM patients from the TCGA cohort by using seven typical splicing types. We classified MPM patients based on their splicing status and conducted a comprehensive analysis of the correlation between the splicing classification and clinical characteristics, genetic variation, pathway changes, immune heterogeneity, and potential therapeutic targets.
Results
The expression of the alternative splicing regulator SRPK1 is significantly higher in MPM tissues than in normal tissues, and correlates with poor survival. SRPK1 deficiency promotes MPM cell apoptosis and inhibits cell migration in vitro. We divided the MPM patients into four clusters based on their splicing profile and identified two clusters associated with the shortest (cluster 3) and longest (cluster 4) survival time. We present the different gene signatures of each cluster that are related to survival and splicing. Comprehensive analysis of data from the GDSC and TCGA databases revealed that cluster 3 MPM patients could respond well to the small-molecule inhibitor CHIR-99021, a small-molecule inhibitor of GSK-3.
Conclusion
We performed unsupervised clustering of alternative splicing data from 84 MPM patients from the TCGA database and identified a cluster associated with the worst prognosis that was sensitive to a GSK-3 inhibitor.
INTRODUCTION
Malignant mesothelioma is one of the most aggressive tumors with few effective treatments worldwide. Pleural mesothelioma accounts for about 80% of malignant mesothelioma cases, and asbestos exposure is the main risk factor resulting in malignant pleural mesothelioma.1 More than 30 000 new diagnoses and 26 278 deaths from malignant pleural mesothelioma (MPM) were reported in 2020 worldwide.2 The median survival time for MPM patients is about 1 year, and few patients can be cured.3 The three main histological subtypes of MPM are epithelioid (50%–70%), sarcomatoid (10%–20%), and biphasic (20%–35%).4 Tumor cells in epithelioid MPM are similar to primitive mesothelial cells, resulting in the best patient survival; sarcomatoid MPM cells exhibit a spindle morphology similar to sarcoma, leading to the worst patient survival. Biphasic MPM has features of both epithelioid and sarcomatoid MPM.5, 6 Only a small number of patients with early MPM can receive comprehensive surgery-based treatment at the time of diagnosis. The first-line treatment for advanced MPM is cisplatin combined with pemetrexed. However, the results are not satisfactory for either chemotherapy or radiotherapy.
In recent years, targeted therapy and immunotherapy have gradually become hot spots in cancer treatment. To date, several molecular pathways related to MPM have been identified, including growth factor signaling (especially the EGFR signaling), angiogenesis, cell cycle regulation, apoptosis, and epithelial-mesenchymal transition (EMT) pathways.7-10 Unfortunately, a large number of clinical trials of drugs specifically targeting these pathways have proved that current targeted therapies have very limited efficacy on MPM patients.11-15 Thus, it is extremely important to discover new treatments or develop a new classification method of MPM that can distinguish patients with different treatment responses.
Large-scale genome and transcriptome research can provide new insights for the classification of MPM. Both Bueno et al. and Hmeljak et al. proposed new classification schemes based on MPM transcriptomic data.16, 17 Bueno et al. reported recurrent mutations in the splicing factor SF3B1 and identified splice alterations as a recurrent mechanism for tumor suppressor gene inactivation in MPM,17 suggesting that alternative splicing plays an indispensable role in MPM. Here, we could classify MPM patients into new subtypes based on the TCGA alternative splicing data reported by Ryan et al.,18 and conducted a comprehensive analysis on the correlation between this classification scheme and clinical characteristics, genetic variation, pathway changes, immune heterogeneity, and potential therapeutic targets.
METHODS
Cell culture and SRPK1 knockdown by SRPK1-specific siRNA
The human malignant pleural mesothelioma NCI-H2452 cell line was purchased from FuHeng BioLogy (Shanghai) and cultured in RPMI-1640 medium supplemented with 10% fetal bovine serum (FBS), 100 mg/ml streptomycin, and 100 U/ml penicillin. The cells were cultured at 37°C in the presence of 5% CO2. SRPK1-specific siRNAs were synthesized by RIBOBIO, Guangzhou. We designed two distinct siRNAs specific to SRPK1 with the following target sequences: GCCGTATCATCCACACTGA (siSRPK1-1) and GCGCCAGGCAGAATTACTA (siSRPK1-2). An equimolar mixture of the two siRNAs was used for the following assay. The RNAiMAX reagent was used to transfect H2452 cells with siSRPK1 and siControl following the manufacturer's instructions. The knockdown efficiency was verified by RT-PCR, using the following SRPK1-specific primers:
SRPK1-Forward: GGGCATCATCTGCTCAAGTGGA;
SRPK1-Reverse: GTCAGTGTGGATGATACGGCAC.
Apoptosis assay
The cells were collected 48 h after transfection. Cell apoptosis was detected using the FITC annexin V apoptosis detection kit (BD) following the manufacturer's instructions. Labeled cells were then subjected to flow cytometry (BD) to calculate the apoptotic cell fraction.
Transwell cell migration assay
Cell migration was analyzed using 8-μm pore filter chambers (Costar). The cells were collected 48 h after transfection, counted, and diluted to a density of 5.0 × 10⁵ cells/ml in PMI-1640 medium without FBS. The chambers were filled with 100 μl cell suspension and 650 μl RPMI-1640 medium supplemented with 10% FBS, and transferred to the plates. After 12 h, the cells that adhered to the membrane were fixed with methanol and stained with 0.05% crystal violet. Images of cells that migrated to the underside of the filter were acquired with a microscope and analyzed using ImageJ software.
Data sources and processing
RNA sequencing data and somatic mutation data from 84 MPM tumor tissues from the Cancer Genome Atlas (TCGA) database, processed by MuTect2, were downloaded from the UCSC Xena website (https://xena.ucsc.edu/). Clinical characteristics (age, gender, tumor node metastasis classification [TNM], and pathological type and stage) and survival information for all patients were collected from the TCGA database. Gene expression data were converted into transcripts per kilobase million (TPM), and log2(TPM + 0.01) was used for subsequent analysis. Neoantigen data of these TCGA MPM patients was obtained from the Genomic Data Commons website (http://api.gdc.cancer.gov/data/).
The microarray GSE42977 data, which were acquired on the GPL6790 platform, were downloaded from the Gene Expression Omnibus website (GEO, https://www.ncbi.nlm.nih.gov/geo/), and 40 MPM tumor tissues and eight normal pleura mesothelial tissues were used to calculate the differential gene expression between tumor and normal mesothelial tissues.
Percent-spliced-in (PSI) values of alternative splicing data (percentage of samples with PSI of more than 75%) were collected from SpliceSeq (http://bioinformatics.mdanderson.org/TCGASpliceSeq).18 A total of 328 and splicing-related genes were extracted from the SpliceAid 2 website (www.introni.it/spliceaid.html).19
MPM clustering analysis
Dimensionality reduction for RNA alternative splicing data using the t-distributed stochastic neighbor embedding (t-SNE) method was performed using the Rtsne package (version 0.15) using the default parameters, and visualization was performed by ggplot2 (version 3.3.5) in R software. To obtain a robust classification of MPM patients based on alternative splicing data, the consensus cluster plus package (version 1.56.0) was used under the implemented unsupervised consensus approach to identify MPM splicing subtypes. The patients were separated into four clusters (clusters 1, 2, 3, and 4).
Differential gene analysis and gene set variation analysis (GSVA) analysis
The Limma package (version 3.48.3) was used to identify differentially expressed genes and alternative splicing events between tumor and nontumor tissues, and between the four clusters. A fold change higher than 2 or lower than 0.5 and a false discovery rate (FDR) value lower than 0.05 were set as critical values for differential gene analysis. GSVA, a gene set enrichment method that estimates the variation of pathway activity over a sample population in an unsupervised manner, was performed using the GSVA package (version 1.42.0) on TPM RNA sequencing data.20 The PSI value of each alternative splicing event with an interquartile range (IQR) greater than 0.05 and the mRNA expression levels of splicing factors were used for correlation analysis using the Hmisc package (version 4.6–0) in order to calculate the GSVA score of each cluster.
Survival analysis
Kaplan–Meier analysis was used to evaluate the overall survival of MPM patients in the four clusters. In order to further analyze whether classification in the splicing clusters could serve as an independent prognostic factor, we used the Cox proportional hazards model after adjusting for factors including gender, age, pathological type, TNM, stage, and CDKN2A mutation status to determine whether the splicing classification could predict survival rate of MPM patients.
Immunological score
The geometric mean of the expression of GZMA, GZMB, PRF1, GNLY, GZMH, GZMM, GZMA, and PRF, which are directly correlated with the cytolytic activity of T/NK cells, was defined as the cytolytic score. The geometric mean of the expression of HLA II genes (HLA-DMA, HLA-DMB, HLA-DPA1, HLA-DPB1, HLA-DRA, and HLA-DRB1) was defined as the HLA II score. The geometric mean of the expression of known HLA I genes (B2M, HLA-A, HLA-B, and HLA-C) was defined as the HLA I score.21
Tumor-infiltrating immune cell analysis
EPIC and CIBERSORT were used to calculate the infiltration fraction of seven and 22 immune cell types, respectively, in MPM tumor tissues. EPIC is based on the comparison of gene expression levels between a library of specific cell types and tumors, and can be used to predict the fraction of each cell type.22 EPIC analysis was performed online according to web instructions (http://epic.gfellerlab.org/). CIBERSORT is based on the principle of linear support vector regression and is a computational tool for the deconvolution of the expression matrix of human immune cell subtypes. CIBERSORT analysis was performed using the R software according to the authors' instructions.23
Somatic mutation analysis
Somatic mutation data of MPM patients were processed by MuTect2, and analyzed and visualized using the maftools package (version 2.10.0).
Statistical analysis
All statistical analysis were performed using the R (version 4.0.2) and Graphpad Prism 8 software. The data analysis and visualization toolkit in R software included ggplot2, pheatmap, Rtsne, Upset, ConsensusClusterPlus, survminer, survival, limma, Cibersort, maftool, ComplexHeatmap, openxlsx, circlize, and pROC packages. All statistical tests are two-sided. Unless otherwise stated, a p-value less than 0.05 was considered to denote statistical significance.
RESULTS
SRPK1 deficiency promoted MPM cell apoptosis and inhibited cell migration
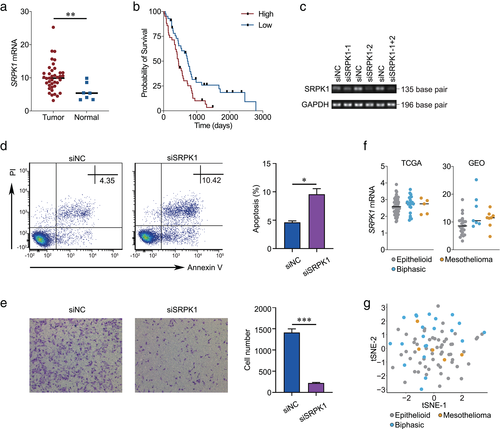
The activities of two key families of splicing factors, the family of serine/arginine splicing activators and the heterogeneous ribonuclear protein family of splicing suppressors, are both regulated by the SRPK protein kinase family.24, 25 SRPK1 expression is dysregulated in most cancers, and is higher in tissues from MPM patients than in their healthy counterparts (Figure S1A and Figure 1a). The Kaplan–Meier curves show that MPM patients with higher SRPK1 expression have a worse prognosis than those with lower SRPK1 levels (Figure 1b, p < 0.01). To verify the effects of SRPK1 in cancer in vitro, we carried out SRPK1 knockdown experiments in the human MPM NCI-H2452 cell line using SRPK1-specific small interfering RNAs. We confirmed that siSRPK1 transfection dramatically decreased SRPK1 expression in H2452 cells (Figure 1c). Compared to the control group, SRPK1 deficiency significantly promoted H2452 cell apoptosis and inhibited H2452 cell migration (Figure 1d and e). Collectively, our data support the notion that SRPK1 and RNA splicing-related events play a vital role in MPM patients. Although MPM histological types are an important factor affecting patient survival, SRPK1 expression showed no significant differences across the different histological types for both TCGA and GEO data sets (Figure 1f; TCGA data set, p = 0.54; GEO data set, p = 0.16). Evaluation of the splicing profile in MPM patients showed that most splicing events were shared among the three histological types (40 883/43433, Figure S1B). t-SNE analysis also showed that pooled samples from different histological types did not form discrete clusters (Figure 1g), suggesting that when analyzing MPM characteristics based on alternative splicing events, a new classification method might be needed.
Subtype clustering and clinical features related to MPM alternative splicing
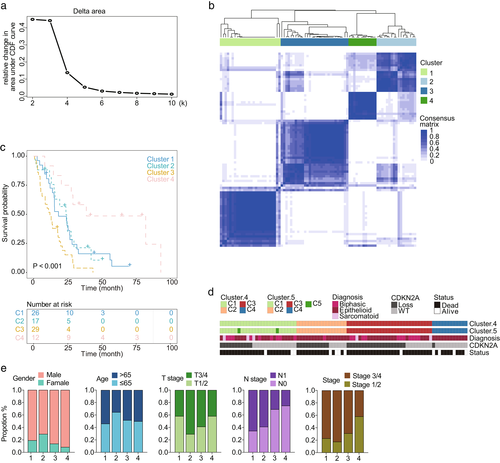
We conducted a detailed analysis of the comprehensive splicing profile in TCGA MPM patients, covering seven typical splicing types: alternative acceptor site (AA), alternative donor site (AD), alternative promoter (AP), alternative terminator (AT), exon skipping (ES), mutually exclusive exons (ME), and retained intron (RI). A total of 43 433 alternative splicing events in 10 144 genes were detected in the 84 MPM patient cohort, comprising 7.99% AA, 7.07% AD, 20.13% AP, 19.51% AT, 38.53% ES, 0.42% ME, and 6.35% RI (Supplementary Table 1, https://figshare.com/s/e7ce15a90f7e235b5da9). We used the k-means clustering algorithm to perform an unsupervised analysis on MPM patients according to their alternative splicing profile and the elbow method to determine the optimal number of clusters. Although k = 5 appeared to be the optimal choice (Figure 2a), the fifth cluster contained only two samples, prompting us to eventually divide the patients into four clusters only: Cluster 1 (C1, n = 26, 31.0%), cluster 2 (C2, n = 17, 20.2%), cluster 3 (C3, n = 29, 34.5%), and cluster 4 (C4, n = 12, 14.3%) (Figure 2b and Figure S2A). The two samples in the original cluster 5 (when k = 5), were grouped in cluster 1 in the final classification. All 12 samples in cluster 4 belonged to epithelioid histological types and were associated with the best overall survival. Two of the five sarcomatoid samples were classified into cluster 3, and the remaining three were found in cluster 1. In cluster 2, except for one biphasic sample, the remaining 16 samples were all epithelial samples. Of the remaining 20 histological biphasic samples, nine were found in cluster 1 and 11 in cluster 3. Cluster 3 was associated with a worse overall survival rate compared to the other clusters (Figure 2c and d). Survival rates showed statistically significant differences across the four clusters (p < 0.001). Even after adjusting for histology and the CDKN2A mutation status,26 two known molecular prognostic factors in MPM (Figure S2B), the survival differences were still significant (p < 0.01). Furthermore, the analysis of relevant clinical information (gender, age, T, N, and stage) showed significant differences in T, N, and stage that were not randomly distributed across the four clusters (Fisher's exact test, p < 0.05, Figure 2e). In conclusion, through unsupervised clustering based on alternative splicing profiles, we divided MPM patients into four clusters with different survival and clinical characteristics.
GSVA analysis in MPM clusters
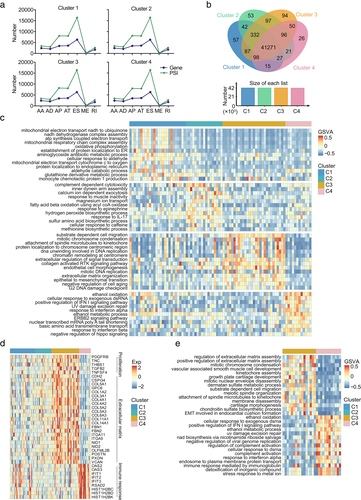
Comprehensive analysis of splicing profiles in the above four clusters of MPM patients identified 41 861 alternative splicing events in 19 819 genes in cluster 1, 41 871 alternative splicing events in 19 814 genes in cluster 2, 42 056 alternative splicing events in 19 833 genes in cluster 3, 41 536 alternative splicing events in 19 801 genes in cluster 4, and 41 271 alternative splicing events shared by all four clusters (Figure 3a and b). Although the number of genes and alternative splicing events appeared to be similar across these four clusters, GSVA analysis revealed unique characteristics for each cluster at the transcriptome level. GSVA analysis uses gene expression profile information to evaluate changes in pathway activity in order to better annotate biological functions.20 Here, we performed GSVA analysis on all MPM samples using a 7481-gene set from gene ontology (GO: biological process). Cluster 1 showed a high level of oxidative phosphorylation characteristics, with enhanced signals for ATP synthesis-coupled electron transport, mitochondrial electron transport, NADH dehydrogenase complex, and oxidative phosphorylation, and decreased signals for migration and tyrosine kinase receptor signaling pathways. Cluster 2, when compared with the other three clusters, had stronger signals related to complement-dependent cytotoxicity and fatty acid beta oxidation using Acyl-CoA oxidase, while the activation level of mononuclear macrophages and the synthesis of deoxyribonucleotide and pyrimidine were downregulated. It is worth noting that cluster 3, associated with the worst prognosis, was enriched in epithelial-to-mesenchymal transition, DNA replication, negative regulation of cell aging, and other related pathways that constitute cancer hallmarks,27 showing strong malignant characteristics. Cluster 4, the cluster with the longest patient survival time, showed type I interferon response characteristics (Figure 3c and Figure S3). We found that the genes encoding PDGFRB, CSPG4, and COL1A2, which are highly expressed in MPM and correlate with MPM patient prognosis as reported earlier, were almost exclusively expressed in cluster 3 (Figure 3d).28-30 All cluster 4 patients and 55% of cluster 3 patients belonged to the epithelioid pathology type, but showed significant differences in survival time. Therefore, we explored the differences between cluster 3 and cluster 4 only in epithelial-type patients and found that they exhibited similar overall characteristics, which indicated that the difference in pathological type was not so important after classification according to alternative splicing clusters. In summary, cluster 3, which was associated with the shortest patient survival time among all clusters, was enriched in antiapoptosis and EMT signaling pathways, which are frequent phenomena in MPM, whereas cluster 4, associated with the best patient survival, showed stronger type I interferon characteristics (Figure 3e). These data show that there was an enrichment of immune signals such as type I IFN in cluster 4 patients with longer survival, whereas cluster 3 patients with the worst survival showed increased EMT and antiapoptotic signals.
Correlation between alternative splicing events and splicing factors in MPM subtypes
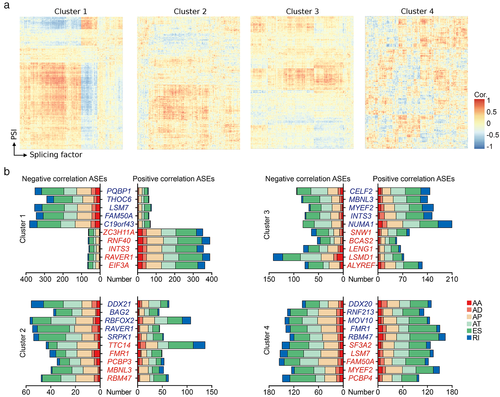
In order to study the correlation between splicing factors and alternative splicing events, we further performed a Spearman correlation analysis on samples from the four clusters and identified highly expressed splicing factors in each cluster (Figure S4A). We found that in cluster 1, patients could clearly be divided into two subgroups based either on the expression of splicing factors or their correlation with alternative splicing events (Figure 4a and Figure S4B). Such classification was not obvious in clusters 2 and 3, and almost invisible in cluster 4. In cluster 1, RNA splicing genes with increased expression (PQBP1, THOC6, LSM7, FAM50A, and C19orf43) were negatively correlated with a greater number of alternative splicing events, and genes with decreased expression (ZC3H11A, RNF40, INTS3, RAVER1, and EIF3A) showed a strong positive correlation with alternative splicing events. In cluster 4, a similar number of alternative splicing events was involved in positive and negative gene regulation (Figure 4b). These observations are consistent with the heatmap results presented in Figure 4a. These results partially illustrate the differences in splicing regulation mechanisms among MPM clusters.
MPM patients in cluster 3 were sensitive to the GSK-3 inhibitor CHIR-99021
Although the alternative splicing profile could help us to clearly divide MPM patients into four clusters, this classification method is not feasible for practical applications. Therefore, we next asked whether specific gene expression patterns could distinguish between four clusters of patients. We established a marker signature based on 3–6 genes for each cluster (Figure S5). Our marker model achieved a sensitivity level of 88.5, 82.4, 89.7, and 91.7% and a specificity level of 84.5, 94.0, 85.5, and 94.4% for cluster 1, cluster 2, cluster 3, and cluster 4, respectively. Receiver-operating characteristics (ROC) showed that the area under the curve (AUCs) of the model was 0.912, 0.942, 0.956, and 0.983 for the four clusters, respectively, and all models exhibited good prediction effects (Figure 5a). We used this marker model to cluster the 84 MPM patients to further verify the classification effect (Figure 5b).
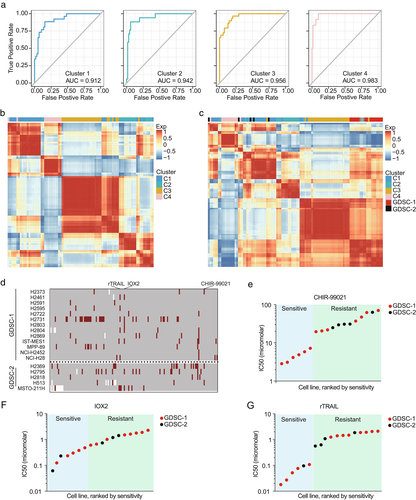
The development of new inhibitors for targeted therapy of mesothelioma is particularly important for improving patient survival, especially in cluster 3 patients, who have poor prognosis. The Genomics of Drug Sensitivity in Cancer (GDSC) database contains multiple omics data from more than 1000 tumor cell lines and responses to more than 200 drugs, and helps researchers to explore potential tumor treatment targets.31 We collected transcriptome data of 21 pleural mesothelioma cell lines in GDSC and clustered them together with the data of the 84 MPM patients from the TCGA database based on the expression of the marker signature. Pleural mesothelioma cells in GDSC were divided into two main groups: 16 cell lines highly similar to cluster 3 were labeled as GDSC-1, and the remaining five cell lines were labeled as GDSC-2 (Figure 5c). We selected 155 small molecule drugs with response records in at least 18 mesothelioma cell lines for the follow-up analysis. There are only three drugs, CHIR-99021, IOX2, and rTRAIL, whose responses were recorded as sensitive in more than five cell lines (Figure 5d-g). CHIR-99021 is an inhibitor of GSK-3α and GSK-3β, which are involved in the WNT signaling pathway. IOX2 is an inhibitor of the egl-9 family hypoxia-inducible factor 1 (EGLN). rTRAIL is a TRAIL receptor agonist and is involved in the regulation of apoptosis regulatory signaling pathways. We found that 50% of the cell lines in GDSC-1 were sensitive to CHIR-99021, whereas all cell lines in GDSC-2 were resistant to CHIR-99021, and there was a significant difference in IC50 between the sensitive and resistant groups. These results suggest that CHIR-99021, a small molecule inhibitor of GSK-3α and GSK-3β, would elicit a good therapeutic response in cluster 3 MPM patients but have no effect for MPM patients in the other three clusters. Personalized cancer treatment appears to be particularly important in the current customization of cancer treatment plans.
Immune characteristics of MPM patients
We next explored the characteristics of immune cell infiltration, antigen presentation, and cancer-germline antigens (CGAs) in MPM. CD8+ cytotoxic T lymphocytes (CTL) and NK cells are considered essential for effective immunotherapy. We used the EPIC and CIBERSORT algorithms to calculate the infiltration fraction of different immune cells in MPM (Figure S6A), and calculated the cytolytic score for each sample, which could reflect CTL/NK abundance.21 CD8+ T cell scores calculated by both EPIC and CIBERSORT and the combined scores of CD8+ T cells and NK cells calculated by CIBERSORT were correlated with higher cytolytic scores (r > 0.6), while the CD4+ T cell scores showed a weak correlation with cytolytic scores (Figure 6a and Figure S6B). The cytolytic score was highest in cluster 4 and lowest in cluster 3 (one-way ANOVA test, p = 0.014, Figure 6b). We also analyzed the scores of HLA I and HLA II in each cluster to evaluate the transcription levels of immune evasion drivers in each of them. The HLA I scores were basically the same in all four clusters (one-way ANOVA test, p = 0.993). The HLA II levels in clusters 2 and 3 were lower (one-way ANOVA test, p = 0.016), which indicated the downregulation of HLA II gene transcription and the avoidance of antigen presentation (Figure 6b). However, the cytolytic, HLA I, and HLA II scores did not differ significantly between histopathological subtypes (Figure S6C).
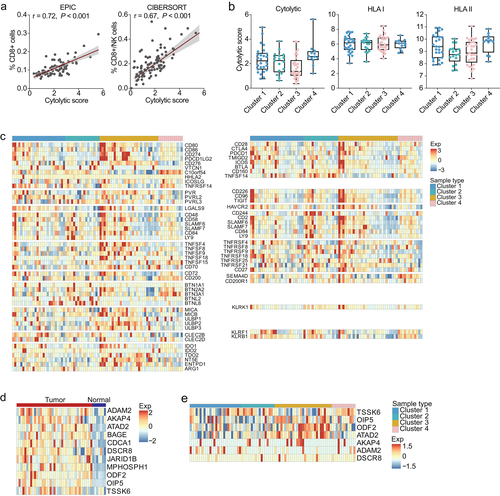
We next investigated the expression of ligands of T/NK cell costimulatory and coinhibitory receptors and other immunomodulators to identify potential targetable immune checkpoints in MPM. The inhibitory ligand CD274 (PD-L1) was preferentially expressed in 10 samples in cluster 3, showing lower expression levels in the other samples (Figure 6c). Other inhibitory checkpoint ligands, such as LGALS9 (TIM-3 ligand) and NK cell inhibitory receptor KLRK1 ligands (MICA, MICB, ULBP1, ULBP2, and ULBP3) were also highly expressed in cluster 3. All samples in cluster 4 highly expressed C10orf54, which encodes an inhibitory T cell checkpoint of the B7 family.
We further conducted a systematic study on the expression of CGA in MPM. MPM tumor tissues showed significantly higher expression of 11 CGAs than normal mesothelial tissues (Figure 6d). Each cluster showed a specific CGA expression pattern (Figure 6e). The expression levels of OIP5, ODF2, and ATAD2 were higher in cluster 3 than in the other clusters, whereas TSSK6 expression was lower. In conclusion, among all MPM patients, cluster 3 presented the lowest cytolytic score and enrichment in a series of inhibitory receptors, which may be a reason for the shortest survival time of patients in this cluster.
We ranked cytolytic, HLA I, and HLA II scores from high to low, and found no significant change in mutated genes and mutation frequencies in MPM patients in all four clusters (Figure S7A and S7B). Meanwhile, there were no significant differences between mutated genes and mutation frequencies and the number of neoantigens in all four clusters (Figure S7C, one-way ANOVA test, p = 0.68).
DISCUSSION
In this study, we systematically described alternative splicing events and clinical, transcriptomic, and immunologic characteristics of MPM patients, and focused on developing a new MPM classification model and potential therapeutic targets with practical value for clinical diagnosis and treatment. We confirmed that in MPM, interference with the expression of protein kinase SRPK1, which regulates alternative splicing, resulted in a change of the malignant phenotype of MPM cell apoptosis and migration. The 84 MPM patients from the TCGA project were clustered into four clusters based on their alternative splicing profile, and showed significant differences in survival. Each cluster had its own transcription characteristics and potential alternative splicing regulatory mechanisms. Enrichment of EMT and antiapoptotic signaling and high expression of immune inhibitory receptors induced an unfavorable overall survival outcome for patients in cluster 3. The increase in type I interferon signaling pathway in cluster 4 patients might be an important factor for their best overall survival. Moreover, using the drug sensitivity database GDSC, we found that the GSK-3 inhibitor CHIR-99021 showed sensitivity only for patients in cluster 3, whereas all other patients were resistant.
Although several studies have used MPM microarray and transcriptome sequencing data for unsupervised cluster analysis,16, 17, 32, 33 these molecular classifications based on the whole mRNA, miRNA, or lncRNA transcriptome are difficult to be applied in MPM clinical diagnosis. Therefore, we tried to build a diagnostic model with 3–6 genes in each cluster, with the perspective of possible clinical applicability. Of all genes used in diagnostic models, only LOXL2 has been reported as a potential diagnostic biomarker for MPM.34 Three of the six genes in the signature of cluster 3 (ADAM12, EDIL3, and LOXL2) were involved in cell adhesion processes, consistent with the enrichment of EMT processes. EMT has been widely recognized as an important malignant MPM phenotype, and TCGA data showed that MPM ranked second in the EMT score among all tumor types.16, 33 Cluster 4 identified by Hmeljak et al. and the sarcomatoid cluster identified by Bueno et al. were both subclusters characterized by high expression of EMT signals after unsupervised clustering analysis based on mRNA, and both had VIM as one of the most significantly upregulated genes.16, 17 However, although VIM was significantly upregulated in cluster 3 in our data as well (one-way ANOVA test, p < 0.01), its fold change was only 1.14, which suggests that it is not the most significantly upregulated gene (Figure S8A). Meanwhile, in the GDSC data, VIM expression was not significantly different between the GDSC-1 and GDSC-2 groups (Mann–Whitney U test, p = 0.40, Figure S8B). These results show that although our classification based on alternative splicing profiles appeared similar to previously reported classification schemes, our groupings are indeed different.
GSK-3 is a serine/threonine kinase encoded by GSK-3A and GSK-3B and CHIR-99021 is a specific inhibitor of GSK3.35 Studies have shown that GSK-3 is an important antitumor target, which is involved not only in the regulation of malignant phenotypes such as tumor growth, proliferation, and metastasis, but also in the regulation of the antitumor immune response of immune cells. In tumor cells, GSK-3 is involved in PI3K/AKT, NF-κB, WNT, and other important signaling pathways.36, 37 The drug susceptibility results of GDSC showed that in the GDSC-1 group, which is highly similar to the MPM cluster 3, 50% of MPM cell lines were sensitive to CHIR-99021, suggesting that CHIR-99021 might have a better therapeutic effect in cluster 3 patients. The limitation of this drug susceptibility test was that it was performed in vitro in an independent tumor cell line, which fails to mimic the complex tumor microenvironment in vivo. Current immunotherapies targeting the PD-L1/PD-1 axis have shown promising clinical responses in multiple tumor types. However, their benefit for patients' overall survival has been unsatisfactory due to intrinsic or acquired resistance.38, 39 Furthermore, PD-1 and PD-L1 are localized not only on tumor cells but also on normal cells; therefore, nonselective blockade of the PD-L1/PD-1 interaction, inevitably, will adversely affect immune homeostasis.40 In tumor cells, GSK3β mediates PD-L1 phosphorylation, which promotes ubiquitin E3 ligase recognition and subsequent PD-L1 ubiquitination and degradation.41 Interestingly, in T cells, inhibition of GSK3 inhibited the expression of both PD-1 and another inhibitory immune checkpoint, LAG3.42, 43 GSK3 inhibition promoted NK cell maturation and enhanced their antitumor activity.44 These observations suggest that GSK3 inhibitors might have an inhibitory and immunomodulatory effect on tumor cell growth in the intact tumor immune microenvironment in vivo, generating more satisfying results.
In summary, our study highlighted the important role of alternative splicing events in MPM and proposed a new classification model with significant prognostic value. We also identified the clinical features, biological processes, immune signature, and diagnostic model correlated with each cluster. Moreover, we identified a small molecule inhibitor, CHIR-99021, with good therapeutic effect only in cluster 3 patients, which can be a candidate target for personalized MPM treatment. These data offer fundamental knowledge and potential clinical implications of alternative splicing profiles in MPM.
ACKNOWLEDGMENT
The authors would like to thank TopEdit (www.topeditsci.com) for their linguistic assistance during the preparation of this manuscript.
CONFLICT OF INTEREST
The authors declare that no conflict of interest exists.


