The promoter hypermethylation of SULT2B1 accelerates esophagus tumorigenesis via downregulated PER1
Zhuo Li and Meng-Yan Li contributed equally to this work.
Abstract
Background
Esophageal cancer is currently the eighth most common tumor in the world and a leading cause of cancer death. SULT2B1 plays crucial roles in tumorigenesis. The purpose of this study is to explore the role of SULT2B1 in esophageal squamous cell carcinoma (ESCC).
Methods
The expression of SULT2B1 and its clinicopathological characteristics were evaluated in ESCC cohorts. Bisulfite genomic sequencing and methylation specific PCR were used to detect the promoter hypermethylation of the SULT2B1 gene. The effects of SULT2B1 on the biological characters of ESCC cells were identified on functional assays. Subcutaneous xenograft models revealed the role of SULT2B1 in vivo with tumor growth. RNA-Seq analysis and qRT-PCR were performed to recognize the targeted effect of SULT2B1 on PER1.
Results
SULT2B1 was not expressed or at a low level in most patients with ESCC or in ESCC cell lines, and this was accompanied by poor clinical prognosis. Furthermore, the downregulation of SULT2B1 occurred in promoter hypermethylation. According to the functional results, overexpression of SULT2B1 could inhibit tumoral proliferation in vitro and retard tumor growth in vivo, whereas SULT2B1 knockdown could accelerate ESCC progression. Mechanistically, SULT2B1 targeted PER1 at the mRNA level during post-transcriptional regulation. Finally, PER1 was verified as a suppressor and poor-prognosis factor in ESCC.
Conclusions
SULT2B1 loss is a consequence owing to its ability to promote hypermethylation. In addition, it serves as a suppressor and poor-prognosis factor because of the post-transcriptional regulation of PER1 in ESCC.
INTRODUCTION
Esophageal cancer (ESCA) is the sixth leading cause of cancer-related death in the world and the eighth most common cancer.1, 2 According to the GLOBOCAN 2018 study, there are 509 000 ESCA patients who die and 572 000 new cases of ESCA reported annually according to global cancer data.3 In the 2018 China Cancer Report, the number of new cases of ESCA in the country was 258 000, and the number of deaths was 193 000, ranking sixth and fourth, respectively.4 In China, ESCA is divided into esophageal squamous cell carcinoma (ESCC) and esophageal adenocarcinoma (AE) according to pathological classifications. ESCC is the primary type, accounting for ~90% of ESCA in the country.5 Early clinical symptoms of ESCA are insidious and difficult to perceive. Therefore, most patients are in the advanced stage when they undergo first-time consultancy. Although combined therapies, including surgery, radiotherapy, chemotherapy, targeted therapy, and immunotherapy, have been applied in recent years, the 5-year overall survival (OS) rate of patients with ESCA has not improved significantly and remains at a low level of 10%–30%.3 According to 2018 data from the China Cancer Center, the 5-year OS of Chinese patients with ESCA is merely 30%.6 The molecular mechanism of ESCC is still largely unclear, especially in terms of tumorigenesis, development, and drug sensitivity. Therefore, it is necessary to identify potential biomarkers and therapeutic targets. Previously, we used whole-genome sequencing (WGS) to detect the genomic sequence of tumor tissues and their corresponding adjacent tissue samples from four patients with ESCC. We systematically analyzed the copy number variant genes of ESCC patients and combined high-throughput functional screening of driving genes to find potential therapeutic targets. The final results showed that SULT2B1 is one of the significantly downregulated genes in tumor tissues. Therefore, the aim of this study to fully reveal the function and mechanism of SULT2B1 in ESCC on the basis of preliminary work.
Currently, the SULT2B1 gene includes two isoforms, SULT2B1a and SULT2B1b, which are generated by alternate splicing of the first exon.7 Compared to SULT2B1a, there are more reports regarding SULT2B1b in malignancies. It has been confirmed that SULT2B1b is frequently upregulated in breast cancer,8, 9 endometrial cancer,10 and liver cancer11 but downregulated in prostate cancer.12, 13 Moreover, it has been shown that SULT2B1b can promote proliferation and cell cycle progression, and inhibit apoptosis in hepatoma carcinoma cells,11 whereas it has contrary effects in prostate cancer cells.13 These findings indicate that SULT2B1 has different forms of expression patterns and mechanics in human cancer. However, there are few reports describing the role of SULT2B1 during the ESCC development process.
In recent years, the association of PER genes with cancer has increasingly been recognized, and their expression has been detected in many human cancers. In particular, PER genes take part in regulating the processes of cancer development, including the DNA damage response, the cell cycle, proliferation, and apoptosis.14 PER1 is one of the core circadian clock genes.15, 16 Previous studies have identified that the exceptional expression of PER1 is strongly linked to the initiation and progression of all sorts of carcinomas, such as gastric cancer and non-small cell lung cancer (NSCLC).17, 18 Oher studies have shown that the expression of PER1 is downregulated in oral squamous cell carcinoma (OSCC) and is significantly associated with clinical stage and survival time.19, 20 The above mentioned studies indicate that PER1 plays a key role in tumor suppression; however, the specific mechanism is still unknown. Therefore, it is necessary to acquire significant findings by performing an in-depth study of PER1.
MATERIALS AND METHODS
Patient specimens and cell lines
Fresh tissue samples from 47 patients with ESCC who had not received radiotherapy or chemotherapy were provided by Linzhou People's Hospital (Henan, China). Each specimen included the tumor tissue collected from the lesion and the normal epithelial tissue around the tumor. After hematoxylin and eosin (HE) staining, the tumor tissues were confirmed to be ESCC, and there were no tumor cells in their normal epithelial tissues.
In addition, 299 formalin-fixed and paraffin-embedded ESCC samples and their corresponding normal samples were obtained from Linzhou Cancer Hospital (Henan, China). Moreover, 76 fixed specimens were collected from the Sun Yat-sen University Cancer Center (Guangzhou, China). These patients underwent preoperative treatments and signed informed consent forms. All of the ESCC samples were confirmed by the Committees for Ethical Review of Research and the Institutional Review Boards of SYSUCC.
Six ESCC cell lines (KYSE140, KYSE410, KYSE510, KYSE520, KYSE180, and KYSE30) were acquired from Deutsche Sammlung von Mikroorganismen und Zellkulturen (DMSZ, Germany).21 Four Chinese ESCC cell lines (EC109, EC9706, EC18, and HKESC1) were obtained from Professor Srivastava and Professor Tsao from the University of Hong Kong.22 Human embryonic renal epithelial cells 293FT were purchased from Invitrogen, and the normal esophageal epithelium immortalized cell line, NE1, was preserved in our laboratory. The above-mentioned ESCC cells were cultured in Dulbecco's modified Eagle medium (DMEM) supplemented with 10% fetal bovine serum (FBS) and validated using morphologic observation.
Tissue microarray and immunohistochemistry
The tissue microarray (TMA) was constructed using the 299 cases of samples mentioned above, and immunohistochemical staining was executed according to the procedure reported in previous research.23 SULT2B1 was diluted to 1:200 (GTX32904, Neobioscience). Two studies were performed separately to score the degree of immunostaining. The staining intensity and staining range of tissues were observed under 200× and 400× microscopes, and the semi-quantitative scoring criteria were used for scoring. First, the positive staining intensity was calculated (0: negative-0; 1: weak; 2: moderate; or 3: strong). The percentage of SULT2B1-positive staining was scored (0: <5%; 1: 5%–25%; 2: 25%–50%; 3: 50%–75%; 4: >75%). The two parts were added together to obtain the final score of SULT2B1 protein expression. For the staining index limits and definitions, 0–7 was considered low expression and 8–12 was considered high expression. Samples with defects were eliminated from the analysis.
RNA isolation and quantitative real-time polymerase chain reaction PCR
The total RNA of cell lines or specimens were extracted using TRIzol reagent (Invitrogen). Reverse transcription polymerase chain reaction (PCR) of the mRNA was conducted using the TAKARA PrimeScript RT reagent kit with genomic DNA (gDNA) Eraser (Takara Bio). Quantitative real-time PCR (qRT-PCR) was performed to use the FastStart Universal SYBR Green Master (Roche) and detected with the Roche 480 Real-Time PCR system. The above experiments were fulfilled following the manufacturer's instructions.
The primers for SULT2B1 were 5′-GTTGCCAGGTGAATACTTCCG-3′ (forward) and 5′-CCCGCACATCTTGGGTGTT-3′ (reverse). The primers for PER1 were 5′-GGACATGACCTCTGTGCTGA-3′ (forward) and 5′-CATCAGGGTGACCAGGATCT-3′ (reverse). The primers for β-actin were 5′- CATGAGAAGTATGACAACAGCCT-3′(forward) and 5′-AGTCCTTCCACGATACCAAAGT-3′(reverse).
DNA methylation analysis
The genomic DNA of the cell lines were extracted using the TIANamp Genomic DNA Kit (Tiangen) and purified using the TaKaRa MiniBEST DNA Fragment Purification Kit (Takara Bio). The obtained DNA fragments underwent bisulfite treatment using the EpiTect Bisulfite Kit (Qiagen) and referring to the operational handbook. Bisulfite sequencing PCR (BSP) and methylation-specific PCR (MSP) were conducted using specific primers that targeted the sequence including CpG islands that closed to the transcription start site between 2022 and 2177 bp of the SULT2B1 promoter region. Specific primers for BSP and MSP were designed using MethPrimer (http://www.urogene.org/methprimer2/). The primers used for BSP were as follows: forward, GTTTAAATTGGAGTGTAATGGTGT; reverse, CTAAAAAAACAAAAATCAACCAAAC. The methylation-specific primers used were as follows: forward, TAAATTGGAGTGTAATGGTGTCG; reverse, TATACTCCCAATTACTCCGAAA. The unmethylation-specific primers used were as follows: forward, AAATTGGAGTGTAATGGTGTT; reverse, CCTATACTCCCAATTACTCCAAAA.
Vector construction and transduction
The control plasmids and Lv105-SULT2B1, Lv105-PER1, and shSULT2B1 were constructed by GeneCopoeia. The interesting genes were confirmed by sequencing. Lv105-SULT2B1 were packaged into 293FT cells using the Lenti-Pac HIV Expression Packaging Kit (GeneCopoeia). The collected virus supernatant was stably transfected into the target cells of EC109 and EC9706 using the selection drug. In the same way, shSULT2B1 and Lv105-PER1 were stably transfected into the KYSE510 cell lines.
Cell proliferation assay and focus formation assay
The cell proliferation assay was conducted using Cell Counting Kit-8 (Dojindo) and referring to the reagent specifications. In short, we seeded 1 × 10³ cells/well into 96-well plates, and we observed and detected the cell growth rate using Multiskan MK3 (Thermo Scientific) for seven continuous days. For the focus formation assay, we seeded 1 × 10³ cells/well into six-well plates and cultured them for 2 weeks. Next, we fixed the cell colonies with 75% ethanol and stained them with 2% crystal violet. Finally, we counted the cells using grid photos for overlay processing. Three independent experiments were conducted.
In vivo xenograft assay
We injected the 1 × 10⁶ control and the Lv105-SULT2B1 cells into the left and right subcutaneous dorsal flanks of 4-week-old female BALB/C nude mice. The mice were purchased from Charles River (Beijing, China). We observed the tumor growth for 1 to 2 months, then removed the tumor from the mice and fixed it. Finally, we stained the animal samples using immunohistochemistry (IHC). The above animal experiments were approved with the guidance of the Institutional Animal Care and Use Committee.
Statistical analysis
SPSS 23.0 and GraphPad Prism 7.0 were used for the statistical analyses. Student's t-test was conducted to analyze the difference in the two group data. Pearson's χ2 test was used to analyze the correlation between the SULT2B1 expression and the clinicopathological characteristics in ESCC. Kaplan–Meier plots were used to draw the OS curve, and log-rank tests were used to analyze the correlation between the SULT2B1 expression and OS. Univariate and multivariate Cox proportional hazards regression models were used to appraise the independent prognostic factors of ESCC. Data are shown as means ± SDs. p < 0.05 was considered statistically significant.
RESULTS
Downregulated expression of SULT2B1 was frequently detected in ESCC
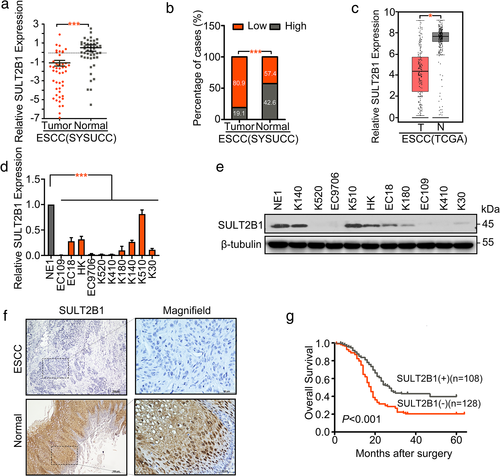
To detect the mRNA expression of SULT2B1 in ESCC, qRT-PCR was performed to compare the SULT2B1 expression level between 47 ESCC and the corresponding non-tumor tissues (p < 0.001, paired Student's t-test; Figure 1(a)). The results showed that a downregulated mRNA expression level of SULT2B1 (defined as a >2-fold increase) was initially detected in 38 of 47 (80.9%) of the ESCC tissues (Figure 1(b)). We also explored the SULT2B1 level in The Cancer Genome Atlas (TCGA) database and obtained consistent results (Figure 1(c)). Additionally, the mRNA and protein level of SULT2B1 was downregulated in the ESCC cell lines compared with the immortalized esophageal cell line NE1 (Figure 1(d),(e)).
Clinical significance of SULT2B1 expression in ESCC
Informative results from the IHC staining were obtained from 236 pairs of ESCC tissues, and 63 cases were eliminated on account of sample defects or lack of representativeness. SULT2B1 was seldom detected in the ESCC sectors, but had increased levels in the normal esophageal epithelium tissues, with 45.8% (108/236) of ESCC patients showing downregulated SULT2B1 expression (Figure 1(f)). According to the results of 236 cases of ESCC chip immunohistochemistry with valid data, the correlation between the low expression of SULT2B1 in ESCC specimens and the clinicopathological characteristics of the patients were analyzed. It was found that the low expression of SULT2B1 was related to the TNM stage and lymph node metastasis of the patients (p < 0.05). However, there was no correlation with the patient's age, gender, tumor invasion, or differentiation, and there was no statistical significance (p > 0.05) (Table 1). In exploring the relationship between the low expression of SULT2B1 and the OS time of patients with ESCC, a univariate survival analysis method was introduced. The Kaplan–Meier method was used to create an OS curve, and the difference in the survival time of patients was evaluated using a log-rank test. The Kaplan–Meier results showed that the survival curves of the low expression of the SULT2B1 group (n = 108) and the high expression group (n = 128) were significantly different. The median survival time of the former was 18 months, compared with the median survival time of the latter of 27 months (p < 0.001) (Figure 1(g)). To further analyze the relationship between the expression of SULT2B1 and the prognosis of ESCC, we first performed a univariate Cox regression analysis. The results showed that the expression of SULT2B1 (p < 0.001), the degree of tumor differentiation (p = 0.005), the depth of tumor invasion (p < 0.01), the clinical stage (p < 0.001), and lymph node metastasis (p < 0.001) were significantly related to the OS rate of the patient. However, the patient's age and gender had no significant correlation with the OS rate (Table 2). To eliminate the possibility that the factors related to the prognosis of ESCC patients derived from the univariate analysis mentioned above were covariates, we further performed a multivariate Cox regression analysis. The results showed that downregulation of SULT2B1, poor tumor differentiation, and deep tumor invasion were independent adverse prognostic factors for the OS of patients with ESCC (Table 2).
| Feature | All | SULT2B1 expression level | p | |
|---|---|---|---|---|
| Downregulated n (%) | Normal n (%) | |||
| Gender | ||||
| Female | 106 | 45 (42.5) | 61 (57.5) | 0.357 |
| Male | 130 | 63 (48.5) | 67 (51.5) | |
| Age | ||||
| ≤60 y | 129 | 57 (44.2) | 72 (55.8) | 0.593 |
| >60 y | 107 | 51 (47.7) | 56 (52.3) | |
| Differentiation | ||||
| Well | 23 | 10 (43.5) | 13 (56.5) | 0.644 |
| Moderate | 150 | 66 (44.0) | 84 (56.0) | |
| Poor | 63 | 32 (50.8) | 31 (49.2) | |
| Tumor invasion | ||||
| T1-2 | 12 | 8 (66.7) | 4 (33.3) | 0.304 |
| T3 | 68 | 29 (42.6) | 39 (57.4) | |
| T4 | 156 | 71 (45.5) | 85 (54.5) | |
| Lymph node metastasis | ||||
| N0 | 130 | 51 (39.2) | 79 (60.8) | 0.026* |
| N1 | 106 | 57 (53.8) | 49 (46.2) | |
| Clinical stage | ||||
| Stage I–II | 155 | 63 (40.6) | 92 (59.4) | 0.029* |
| Stage III–IV | 81 | 45 (55.6) | 36 (44.4) | |
- * Significant difference.
| Clinicopathological features | Univariate analysis | Multivariate analysis | ||
|---|---|---|---|---|
| HR (95% CI) | p | HR (95% CI) | p | |
| SULT2B1 | 1.903 (1.392–2.602) | <0.001* | 1.760 (1.280-2.419) | 0.001* |
| Gender | 0.803 (0.585-1.102) | 0.166 | – | – |
| Age | 1.174 (0.860–1.601) | 0.302 | – | – |
| Differentiation | 1.551 (1.186–2.027) | 0.005* | 1.479 (1.137-1.924) | 0.004* |
| Tumor invasion | 1.538 (1.148–2.060) | 0.010* | 1.397 (1.037-1.882) | 0.028* |
| Clinical stage | 1.899 (1.383–2.607) | <0.001* | 1.327 (0.777-2.266) | 0.299 |
| LN metastasis | 1.769 (1.295–2.416) | <0.001* | 1.126 (0.669-1.893) | 0.655 |
- Abbreviations: CI, confidence interval; HR, hazard ratio.
- * Statistical significance (p < 0.05).
The promoter region of SULT2B1 was hypermethylated in ESCC cells
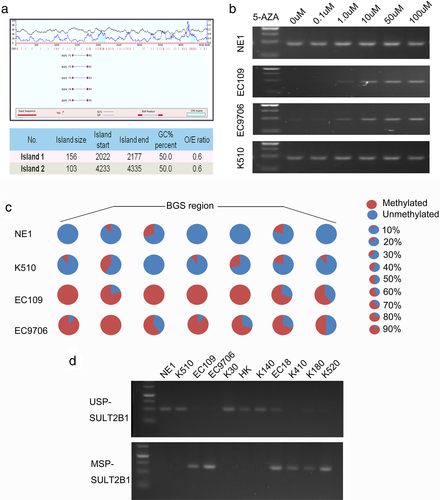
We used the online tool MethPrimer to predict that there were two CpG islands in the promoter region of SULT2B1 (Figure 2(a)). We, then, used different concentrations of DNA methyltransferase inhibitor 5-aza-2′-deoxycytidine (5-aza-dc) to treat the EC109 and EC9706 cell lines that did not express SULT2B1, the KYSE510 cell line that highly expressed SULT2B1, and the normal esophageal epithelial cell line NE1. Seventy-two hours later, the expression of SULT2B1 was detected by RT-PCR. The results showed that the expression of SULT2B1 in EC109 and EC9706 was significantly restored with increased 5-aza concentration, whereas the expression of SULT2B1 in KYSE510 and NE1 did not change significantly with an increase in 5-aza concentration (Figure 2(b)). Bisulfite genomic sequencing (BGS) was used to analyze the methylation status of CpG islands in the promoter region of SULT2B1 in ESCC. Through the BGS experiment, three ESCC cell lines and the NE1 with different expression levels of SULT2B1 were tested for the methylation status of each CpG point in the CpG islands of the SULT2B1 promoter region. BGS analysis showed that NE1 and KYSE510 cells with high-expression of SULT2B1 had much lower methylation levels within the region compared with EC109 and EC9706 cells, in which SULT2B1 is downregulated (Figure 2(c)). According to the results of the BGS, we used MSP to analyze the methylation status of the CpG islands in the promoter region of SULT2B1 in ESCC. The results showed that in the ESCC cell lines, the low expression of SULT2B1 was related to the methylation of its promoter region. Among them, EC109, EC9706, KYSE410, KYSE180, and KYSE520 did not express SULT2B1, but only detected methylated bands, whereas NE1 and KYSE510 highly expressed SULT2B1 detected unmethylated bands (Figure 2(d)).
Overexpression of SULT2B1 inhibited tumor proliferation
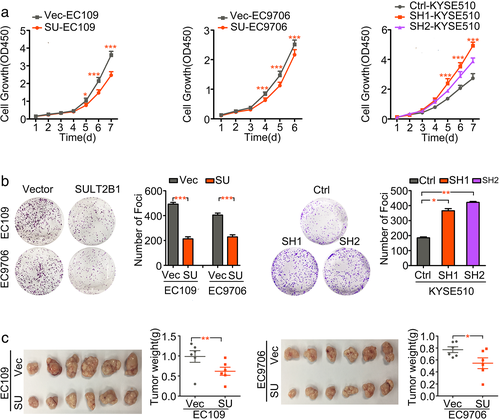
To explore its role in tumorigenicity, SULT2B1 was stably transfected into EC109 (EC109-SU) and EC9706 (EC9706-SU) cells. In addition, SULT2B1-SH was stably transfected into KYSE510 cells (KYSE510-SH1, SH2), and empty vector-transfected cells (EC109-Vec, EC9706-Vec, and KYSE510-Ctrl) were used as controls. The efficiency of the SULT2B1 transfection was assessed using qRT-PCR and a western blot analysis (Figure S1(a)). The tumorigenic ability of SULT2B1 was assessed using a XTT cell growth assay, a foci formation assay, and xenograft tumor mouse models. Both in vitro and in vivo, the SULT2B1-transfected cells showed a slower cell growth rate compared with the empty vector-transfected cells (Figure 3(a)–(c), Figure S1(b)). Moreover, the tumor suppressive effects of SULT2B1 could be reversed in the SULT2B1-SH cells (Figure 3(a)–(c)).
SULT2B1 regulated the mRNA transcription of EC109 cells
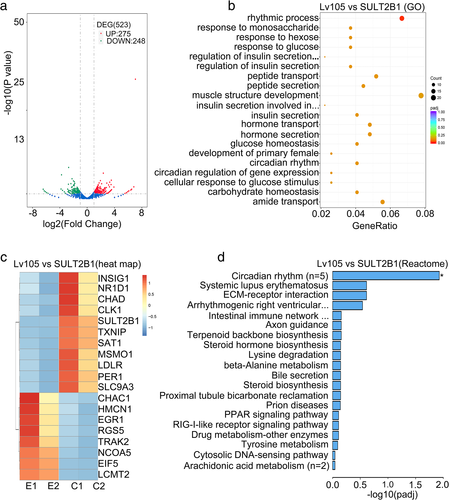
By comparing the vector (control) and the Lv105-SULT2B1 (SULT2B1 over-expression) cells of EC109, the RNA-seq analysis showed 523 differential expression genes in total, including 275 upregulated genes and 248 downregulated genes (Figure 4(a)), including some important genes represented (Table S1). The gene ontologies (GO) analysis revealed the association between the rhythmic process and SULT2B1-overexpression in specific upregulated genes in ESCC (Figure 4(b)). Furthermore, the clustering and heatmap confirmed the top 19 genes, such as PER1 and NR1D1s (Figure 4(c)). Reactome analysis uncovered a close relationship between the circadian rhythm signaling pathway and the over-expression of SULT2B1 in ESCC (Figure 4(d)). In summary, SULT2B1 displayed rhythmic activity on transcriptional regulation.
PER1 was downregulated by SULT2B1 and acted as a suppressor in ESCC
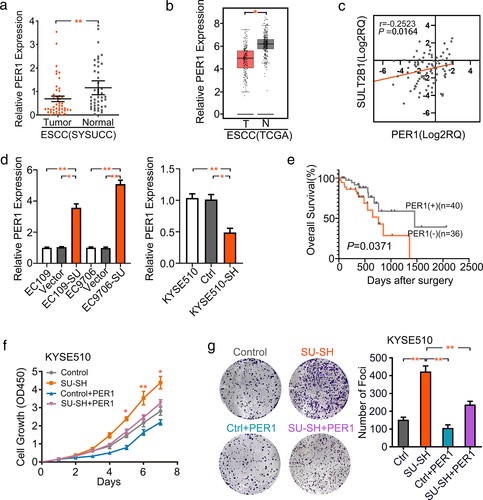
In this study, we verified the downregulation of PER1 in 45 pairs of ESCC specimens (Figure 5(a)). We also explored the PER1 level in the TCGA database. The results were consistent with our previous findings (Figure 5(b)). It is worth noting that the expression of PER1 was positively associated with the expression level of SULT2B1 in the ESCC cohorts (Figure 5(c)). Subsequently, EC109 and EC9706 cells overexpressing SULT2B1 showed statistically significant upregulation of PER1 transcripts, whereas the knockdown of SULT2B1 in KYSE510 cells resulted in a decrease in PER1 mRNA levels (Figure 5(d)). In 76 matched ESCC patients, a survival analysis further confirmed a significant correlation between low PER1 expression and short OS time (Figure 5(e)). In addition, CCK-8 and focus formation assays confirmed that the aberrant expression of PER1 inhibited ESCC progression and partially rescued the abnormal performance in KYSE510 cell proliferation after SULT2B1 knockdown (Figure 5(f),(g)).
DISCUSSION
In the present study, we revealed that the mRNA and protein levels of SULT2B1 were significantly downregulated in ESCC tissues compared to matched tumor-adjacent tissues. This finding was consistent with TCGA data, but there are also some reports to the contrary indicating that the expression of SULT2B1 is increased in some other tumors, such as cervical cancer,24 hepatocellular carcinoma,11 and colorectal carcinoma.25 This might be related to the tissue-specific expression of SULT2B1 in different tumor types. Moreover, our IHC staining results demonstrated that the expression of SULT2B1 in ESCC is significantly correlated with the TNM stage, and lymph node metastasis was found by analyzing the patients’ clinicopathological characteristics. A Kaplan–Meier survival analysis confirmed that the low expression of SULT2B1 in ESCC patients was associated with poor OS. Therefore, SULT2B1 as a potential biomarker may be a new way to predict ESCC initiation and progression. Additionally, SULT2B1, as a beneficial prognostic factor of survival and prognosis, has been discovered as a new therapeutic target for new drug research and development.
CpG islands are located in the promoter region and transcriptional start site of a gene, which represent a high enrichment of CpG sites and are prone to DNA methylation. These methylation changes are responsible for transforming the expression of oncogenes and anti-oncogenes in different cancers.26-28 The detection of specific DNA methylation changes in clinical samples is expected to be a diagnostic and prognostic biomarker and support for therapeutic decisions.29, 30 However, the promoter CpG islands with methylation levels of SULT2B1 have not previously been reported in ESCC. Our findings regarding the hypermethylation status of SULT2B1 CpG islands represent the first comprehensive research to reveal possible mechanisms for the inactivation of SULT2B1 during the tumorigenesis of ESCCs.
Furthermore, functional experiments in vitro and in vivo validated the suppressive function of SULT2B1 on ESCC cell proliferation. To further uncover the mechanism of SULT2B1 on the proliferative effects of ESCC cells, we conducted an RNA-seq analysis and discovered significant transcriptome variation in which the significantly upregulated genes included PER1 after SULT2B1 over-expression in EC109 cells. We were reminded that PER1 might be the downstream target of SULT2B1, which was further indirectly identified using qRT-PCR experiments in the control and the SULT2B1-overexpression or SULT2B1-knockdown ESCC cells. PER1 is one of the core genes primarily involved in mammalian circadian rhythms regulation, the cell cycle, and the DNA damage response.31-33 Circadian misalignment may derive from improper behaviors, genetic factors, or metabonomic changes. These have been strongly associated with tumorigenesis.34-36 Previous studies have shown that the exceptional expression and inhibitory rhythm of PER1 are closely related to tumor initiation and malignant progression, such as in breast cancer, colon cancer, pancreatic cancer, NSCLC, prostate cancer, and pancreatic cancer.37-40 In this study, we verified the downregulation of PER1 in ESCC, which was in accordance with the TCGA data. However, the pathogenic mechanism of downregulated PER1 remains unclear in ESCC tumorigenesis.
In summary, SULT2B1 loss, which has been shown to be connected to promoter hypermethylation, was connected with poor clinicopathological characteristics and prognosis of ESCC. Overexpression of SULT2B1 reduced the cell proliferation and tumor growth of ESCC, whereas the downregulation of the SULT2B1 gene promoted ESCC progression. An increase in the mRNA level of PER1 was the basis of actions of SULT2B1. As a downstream target, PER1 was downregulated by SULT2B1 and played an inhibitory role in ESCC.
ACKNOWLEDGMENTS
This work was supported by grants from the National Natural Science Foundation of China (81772554). Shenzhen Science and Technology program (KQTD20180411185028798). X.-Y. Guan is Sophie YM Chan Professor in Cancer Research.
We thank LetPub (www.letpub.com) for its linguistic assistance during the preparation of this manuscript.
CONFLICT OF INTEREST
We declare that we have no financial and personal relationships with other people or organizations that can inappropriately influence our work. There is no professional or other personal interest of any nature or kind in any product, service, and/or company that could be construed as influencing the position presented in, or the review of, the manuscript entitled, “The Promoter Hypermethylation of SULT2B1 Accelerates Esophagus Tumorigenesis Via Downregulated PER1”.


