Comparison of insulin lispro mix 25 with insulin lispro mix 50 as insulin starter in Chinese patients with type 2 diabetes mellitus (CLASSIFY study): Subgroup analysis of a Phase 4 open-label randomized trial
中国2型糖尿病患者使用赖脯胰岛素预混25与赖脯胰岛素预混50作为胰岛素起始治疗方案的对照研究(CLASSIFY研究):开放标签的随机4期试验亚组分析
Abstract
enBackground
Premixed insulins are recommended starter insulins in Chinese patients after oral antihyperglycemic medication (OAM) failure. In the present study, we compared the efficacy and safety of insulin lispro mix 25 (LM25) twice daily (b.i.d.) and insulin lispro mix 50 (LM50) b.i.d. as a starter insulin regimen in Chinese patients with type 2 diabetes mellitus (T2DM) who had inadequate glycemic control with OAMs.
Methods
The primary efficacy outcome in the present open-label parallel randomized clinical trial was change in HbA1c from baseline to 26 weeks. Patients were randomized in a ratio of 1: 1 to LM25 (n = 80) or LM50 (n = 76). A mixed-effects model with repeated measures was used to analyze continuous variables. The Cochran–Mantel–Haenszel test with stratification factor was used to analyze categorical variables.
Results
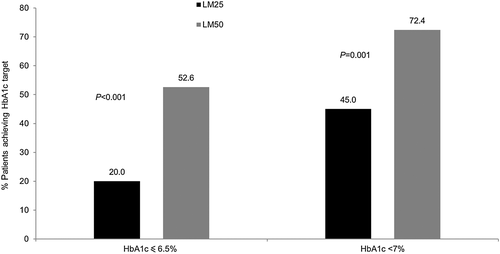
At the end of the study, LM50 was more efficacious than LM25 in reducing mean HbA1c levels (least-squares [LS] mean difference 0.48; 95 % confidence interval [CI] 0.22, 0.74; P < 0.001). More subjects in the LM50 than LM25 group achieved HbA1c targets of <7.0 % (72.4 % vs 45.0 %; P = 0.001) or ≤6.5 % (52.6 % vs 20.0 %; P < 0.001). Furthermore, LM50 was more effective than LM25 at reducing HbA1c in patients with baseline HbA1c, blood glucose excursion, and postprandial glucose greater than or equal to median levels (P ≤ 0.001). The rate and incidence of hypoglycemic episodes and increase in weight at the end of the study were similar between treatment groups.
Conclusions
In Chinese patients with T2DM, LM50 was more efficacious than LM25 as a starter insulin.
Abstract
zh背景
目前推荐在中国糖尿病患者口服降糖药物治疗失败后,以预混胰岛素作为起始胰岛素治疗。本研究中,我们在口服降糖药物治疗后血糖仍然控制不佳的中国2型糖尿病患者中,比较了每日两次赖脯胰岛素预混25(LM25)与每日两次赖脯胰岛素预混50(LM50)作为胰岛素起始治疗的有效性以及安全性。
方法
当前这项开放标签的平行随机临床试验的主要疗效终点为从基线至第26周HbA1c的变化。患者按照1:1的比例被随机分配到LM25组(n = 80)或LM50(n = 76)组。使用重复测量的混合效应模型来分析连续性变量。使用具有分层因素的Cochran–Mantel–Haenszel检验来分析分类变量。
结果
在研究结束时,LM50组与LM25组相比平均HbA1c水平下降更为显著(最小二乘法[LS]平均差异为0.48;95%置信区间[CI]为0.22,0.74;P < 0.001)。LM50组与LM25组相比有更多的受试者达到了HbA1c < 7.0%(分别为72.4%与45.0%;P = 0.001)或≤ 6.5%(分别为52.6%与20.0%;P < 0.001)的血糖目标。此外,与LM25组相比,LM50组能够更有效地降低基线时HbA1c、血糖升高幅度以及餐后血糖大于或等于中位数水平的患者的HbA1c(P ≤ 0.001)。研究结束时两个治疗组的低血糖事件发生率以及体重增加情况都相似。
结论
在中国2型糖尿病患者中,与LM25相比,LM50作为胰岛素起始治疗更加有效。
Significant findings of the study: In Chinese patients with T2DM with inadequate glycemic control on OAMs, LM50 b.i.d. was more efficacious than LM25 b.i.d. as a starter insulin. There were no significant differences in weight gain and hypoglycemia risk between these two treatment groups.
What this study adds: Mid mixture insulins may be more suitable as a starter insulin in Chinese diabetic patients compared with low mixture insulin. Chinese patients with HbA1c, blood glucose excursions, and postprandial glucose excursions greater than median values at baseline have better responses with LM50.
Introduction
The prevalence of type 2 diabetes mellitus (T2DM), an important public health problem, is increasing at an alarming rate throughout the world, particularly in Asian countries, such as China, because of multiple contributing factors, including diet, genes, and lifestyle.1 By 2035, the prevalence of diabetes is estimated to be 592 million globally, with an estimate of 143 million people with diabetes in China alone.2
Increasing evidence shows that Chinese patients and other Asian patients with T2DM have unique clinical characteristics,3 such as more fragile β-cell function,4-6 lower body mass index (BMI)7, 8 but increased central obesity,7, 9 and more pronounced postprandial hyperglycemia compared with the Western diabetic population.9 This unique etiology of T2DM suggests that the strategies to prevent and treat T2DM need a customized approach in Chinese patients.
To compensate for inadequate insulin secretion due to progressive pancreatic β-cell dysfunction, insulin therapy is recommended when oral antihyperglycemic medications (OAMs) fail to achieve glycemic control in patients with T2DM.10, 11 Basal or premixed insulins are the recommended insulin starters following OAM failure in Chinese patients according to Chinese guidelines released by the Chinese Diabetes Society.12 Premixed insulins contain rapid- and intermediate-acting insulin that control fasting (preprandial) and postprandial glucose (PPG) elevations, respectively. In many Asian countries, including China, patients initiate insulin therapy with premixed insulins, and most prefer low mixture insulins twice daily (b.i.d.) as a starter regimen.12 There are probably two main reasons for this: first, in patients with high PPG, which is more evident in Asian patients, treatment with mixtures may be more beneficial compared with basal insulin13; and, second, patients who require both basal and prandial insulin prefer to limit the number of injections per day.14 Although there is enough evidence showing that insulin lispro mix 50 (LM50; mid mixture) is superior to lispro mix 25 (LM25; low mixture) in PPG control,15, 16 there is not much evidence available about initiating mid mixtures in East Asian patients with T2DM. Some studies have even shown that switching to mid mixture insulins from low mixture insulins controlled PPG and stabilized diurnal blood glucose variations more effectively in Japanese patients.17, 18
A few studies have investigated the use of low mixtures19 and mid mixtures16 as starter insulins in Chinese patients; however, no multinational multicenter randomized controlled studies have been conducted to compare the safety and efficacy of low and mid mixtures as starter insulins in T2DM patients with inadequate glycemic control under OAM treatment.
The CLASSIFY study20 was conducted to compare the efficacy and safety of LM25 b.i.d. with LM50 b.i.d. as starter insulin in Asian patients. Herein we present data from the Chinese subgroup of patients in the CLASSIFY study.
Methods
The present Phase 4 randomized open-label 26-week parallel-arm multinational controlled study in patients with T2DM comparing the efficacy and safety of insulin LM25 and LM50 b.i.d. was conducted between 21 January 2013 and 22 August 2014 at 38 sites in China, Japan, Korea, and Turkey. Herein we present subgroup analysis of Chinese patients enrolled at 10 sites in China.
The study was conducted in accordance with consensus ethics principles derived from international ethics guidelines, including the Declaration of Helsinki and Council for International Organizations of Medical Sciences International Ethical Guidelines, International Conference on Harmonization Guideline for Good Clinical Practice E6, and applicable laws and regulations. Informed consent was obtained from each patient or their legal representative prior to the performance of any protocol procedures and prior to the administration of study medication.
Study design
The study consisted of a 2- to 4-week screening phase and a 1- to 2-week lead-in period followed by a 26-week study treatment period that included a 12-week intensive dose-adjustment period and a 14-week maintenance period (Fig. 1).
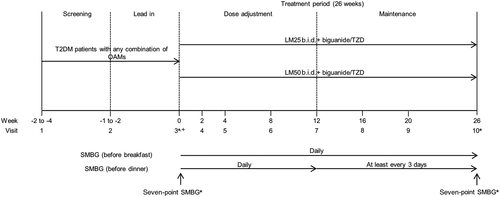
To achieve between-group comparability, patients were stratified by HbA1c ≤8.5 % or >8.5 %, by blood glucose (BG) excursions ≤5 mmol/L (90 mg/dL) or >5 mmol/L (90 mg/dL) (based on the average of two self-monitoring of blood glucose [SMBG] measurements [difference between pre- and post-breakfast blood glucose] during the week before randomization), and by country. Treatment allocation was open label.
Patients
Male or non-pregnant, non-breastfeeding female Chinese patients at least 18 years of age who had a diagnosis of T2DM for at least 6 months with an HbA1c of ≥7.0 % to ≤11.0 % and BMI of ≥18.5 to <35.0 kg/m2 at screening were eligible to enroll in the study. Patients who had been taking a stable dose of a sulfonylurea (SU), biguanide, thiazolidinedione (TZD), α-glucosidase inhibitor (α-GI), glinide, dipeptidyl peptidase (DPP)-4 inhibitor (DPP-4I), or any combination of these OAMs for 8 weeks before the screening visit (12 weeks for TZDs) were eligible to enroll in the study.
Key exclusion criteria included, but were not limited to, the following: patients who had a diagnosis of type 1 diabetes, had had more than one episode of severe hypoglycemia within the 6 months before screening, were currently on or had previously received insulin treatment (>7 days continuously within the 6 months before screening), or had a history of one or more episodes of ketoacidosis or a hyperosmolar state or coma. Patients presenting with acute myocardial infarction, New York Heart Association Class III or IV heart failure, or cerebrovascular accident (stroke) within the 3 months before the screening visit were excluded, as were patients with an estimated creatinine clearance <30 mL/min at screening, obvious clinical signs or symptoms of liver disease, acute or chronic hepatitis, or alanine aminotransferase levels ≥3-fold the upper limit of the reference range at screening. In addition, patients receiving chronic (>14 days) systemic glucocorticoid therapy (excluding topical, intraocular, inhaled, or intranasal preparations) or who had received such therapy within 4 weeks of screening were excluded.
Study treatment
Patients who met the eligibility criteria were randomized in a 1: 1 ratio to receive either LM25 or LM50. Patients taking biguanide and/or TZD were to continue with their stable regimen for the 26-week treatment period. All other prestudy OAMs were not permitted during the study treatment period.
Both LM25 b.i.d. and LM50 b.i.d. were injected daily within 15 min before breakfast and within 15 min before dinner (100 U/mL; 5 units as the starting dose). Target blood glucose levels (averaged SMBG from the previous 3 days) were >3.9 and ≤6.1 mmol/L (>70 and ≤110 mg/dL) before breakfast and before dinner, respectively. Dose adjustments were performed once weekly for up to 12 weeks, as indicated in the dosing algorithm (Table 1). Although it was expected that the patients would be on a relatively stable dose by Week 12, adjustment of insulin dose was allowed at later visits for further optimization of glycemic control based on fasting blood glucose (FBG) assessments performed twice a day at least every 3 days.
| Average of self-monitored plasma-equivalent FBG measurements from the previous 3 days | Dose change | |
|---|---|---|
| mmol/L | mg/dL | |
| ≤3.9 | ≤70 | Decreased to the dose before titrationA |
| >3.9 and ≤6.1 | >70 and ≤110 | No change |
| >6.1 and ≤7.8 | >110 and ≤140 | +1–2 units |
| >7.8 | >140 | +2–4 units |
- A The insulin dose was not increased if the self-monitoring of blood glucose was documented at ≤3.9 mmol/L (≤70 mg/dL) at any time in the preceding week. The insulin dose was decreased to previous lower dose if fasting blood glucose (FBG) was ≤3.9 mmol/L (≤70 mg/dL) or severe hypoglycemia (requiring assistance) or any fasting or nocturnal severe hypoglycemia was documented any time in the preceding week.
Outcome measures
The primary efficacy outcome measure was comparison of the effect of LM25 and LM50 on the change in HbA1c from baseline to 26 weeks. Secondary efficacy measures included a comparison of the effect of LM25 and LM50 on: (i) the change in HbA1c profile over 26 weeks from baseline; (ii) the percentage of patients achieving HbA1c <7 % or ≤6.5 %; (iii) change from baseline in FBG; (iv) seven-point SMBG profile (before and 2 h after meals, plus bedtime); (v) change from baseline in 1,5-anhydroglucitol (1,5-AG) concentrations; and (vi) insulin dose.
The effects of baseline HbA1c, PPG, FBG, and baseline mean blood glucose excursion (PPG – FBG) on the change from baseline in HbA1c were examined in subgroup analyses.
Safety outcome measures included the incidence of total, severe, and nocturnal hypoglycemic episodes, adverse events leading to discontinuation, and change from baseline in body weight.
Statistical analyses
Efficacy analyses were conducted on the full analysis set (FAS). The FAS included all data from all randomized patients receiving at least one dose of the study drug and was analyzed according to the treatment the patients were assigned, regardless of what study drug the patients actually received.
Safety analyses were conducted on an as-treated analysis set (the safety analysis set). Similar to the FAS, the safety analysis set included patients who received at least one dose of study drug. However, patients in the safety analysis set were analyzed according to the treatment they actually received, regardless of their planned treatment.
Treatment differences were assessed by least-squares (LS) mean change from baseline using a mixed-effects model with repeated measures (MMRM). Fixed effects were treatment (LM25 or LM50), blood glucose excursion ≤5 or >5 mmol/L (≤90 or >90 mg/dL), pretreatment (AGI, SU, glinide, or DPP-4) or not, country, visit, and treatment-by-visit interaction; the random effect was patient, and the covariate was baseline HbA1c. The primary outcome was classified by seven exclusive non-inferiority/superiority categories21 using the 95 % confidence interval (CI) of the treatment difference between LM50 and LM25. Predefined subgroup analyses were conducted to assess the effects of baseline HbA1c, blood glucose excursion, PPG, and FBG on the change from baseline in HbA1c.
Categorical variables are summarized by count and percentages by treatment group. Unless indicated otherwise, data are presented as the mean ± SD. The proportion of patients was compared between treatments using a Cochran–Mantel–Haenszel test with blood glucose excursion, pretreatment (AGI, SU, glinide, or DPP-4) or not, and country as stratification factors. Because only patients from China were included in the analyses, the effect of country as a stratification factor was automatically ignored by analyses. Insulin dose at each visit was descriptively summarized by treatment groups by total daily dose (IU and IU/kg). A comparison was made using the same MMRM approach as in the primary analyses.
All tests of treatment effects were conducted at a two-sided α of 0.05. All analyses were performed using SAS Version 9.2 (SAS Institute, Cary, NC, USA).
Results
Patient disposition and baseline characteristics
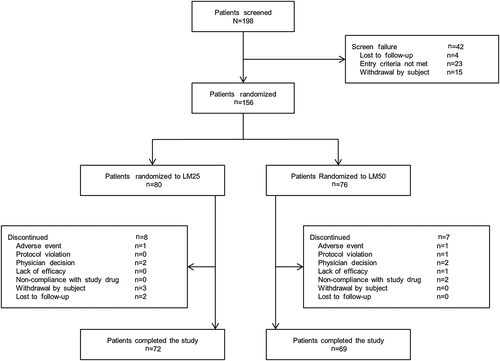
In all, 198 patients were screened and 156 patients were randomized to the LM25 (n = 80) or LM50 (n = 76) treatment groups (Fig. 2). Seventy-two patients (90.0 %) in the LM25 treatment group and 69 patients (90.8 %) in the LM50 treatment group completed the study. The major reasons for discontinuation from the study were withdrawal by subject (n = 3; 3.8 %) in the LM25 treatment group and physician decision and non-compliance with study drug (n = 2; 2.6 %) in the LM50 treatment group (Fig. 2).
Baseline characteristics were similar between the treatment groups. The mean age of the patients was 57.74 ± 9.16 years, and 52.6 % of patients were male. The mean BMI of patients was 24.54 ± 3.04 kg/m2 and the mean HbA1c was 8.54 ± 5.17 % (Table 2).
| Variable | LM25 (n = 80) | LM50 (n = 76) | Total (n = 156) |
|---|---|---|---|
| Gender | |||
| Female | 39 (48.8 %) | 35 (46.1 %) | 74 (47.4 %) |
| Male | 41 (51.3 %) | 41 (53.9 %) | 82 (52.6 %) |
| Age (years) | 56.93 (9.24 %) | 58.61 (9.05 %) | 57.74 (9.16 %) |
| < 65 | 62 (77.5 %) | 54 (71.1 %) | 116 (74.4 %) |
| ≥ 65 | 18 (22.5 %) | 22 (28.9 %) | 40 (25.6 %) |
| Height (cm) | 163.23 ± 8.77 | 162.76 ± 8.13 | 163.00 ± 8.44 |
| Weight (kg) | 65.30 ± 10.46 | 65.59 ± 11.46 | 65.44 ± 10.92 |
| BMI (kg/m2) | 24.41 ± 2.67 | 24.68 ± 3.40 | 24.54 ± 3.04 |
| HbA1c (%) | 8.60 ± 1.11 | 8.48 ± 1.10 | 8.54 ± 1.10 |
| Duration of T2DM (years) | 8.68 ± 5.57 | 7.33 ± 4.65 | 8.02 ± 5.17 |
- Data are given as the mean ± SD or as n (%).
- BMI, body mass index; LM25, insulin lispro mix 25; LM50, insulin lispro mix 50; T2DM, type 2 diabetes mellitus.
Efficacy measures
Overall glycemic control
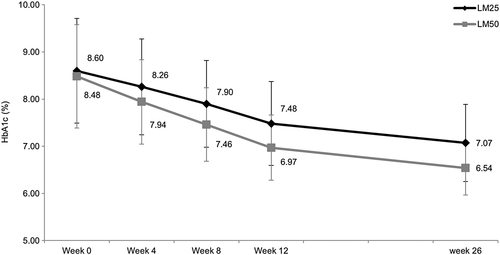
The decrease from baseline in HbA1c was consistently greater in the LM50 treatment group than in the LM25 treatment group throughout the study (Fig. 3). The decrease from baseline in mean HbA1c levels was significantly higher in the LM50 treatment group (LS mean change –1.99 %; 95 % CI −2.21, −1.84; P < 0.001] than in the LM25 treatment group (LS mean change −1.58 %; 95 % CI −1.73, −1.36) at Week 26 (Table 3). A significantly higher percentage of patients in the LM50 compared with the LM25 treatment group achieved HbA1c levels <7 % (72.4 % vs 45.0 %; P = 0.001) and ≤6.5 % (52.6 % vs 20.0 %; P < 0.001; Fig. 4).
| Treatment (n) | Baseline | Endpoint | LS mean change from baseline (95 % CI) | Difference (95 % CI) in LS mean change from baseline | P-value | |
|---|---|---|---|---|---|---|
| HbA1c (%) | LM25 (72) | 8.6 ± 1.1 | 7.1 ± 0.8 | −1.58 (−1.73, −1.36) | 0.48 (0.22, 0.74) | <0.001 |
| LM50 (69) | 8.5 ± 1.1 | 6.5 ± 0.6 | −1.99 (−2.21, −1.84) | |||
| FBG (mmol/L) | LM25 (80) | 9.6 ± 2.3 | 7.2 ± 1.6 | −2.50 (−2.89, −2.11) | −0.38 (−0.94, −0.18) | 0.180 |
| LM50 (76) | 9.7 ± 2.3 | 7.6 ± 1.8 | −2.12 (−2.53, −1.72) | |||
| 1,5-AG (μg/mL) | LM25 (80) | 5.16 ± 4.43 | 10.24 ± 8.30 | 5.03 (3.49, 6.57) | −2.72 (−4.92, −0.52) | 0.016 |
| LM50 (76) | 5.75 ± 5.60 | 12.99 ± 6.56 | 7.75 (6.16, 9.34) |
- Unless indicated otherwise, data are given as the mean ± SD.
- 1,5-AG, 1,5-anhydroglucitol; CI, confidence interval; FBG, fasting blood glucose; LM25, insulin lispro mix 25; LM50, insulin lispro mix 50; LS, least squares; T2DM, type 2 diabetes mellitus.
Mean FBG levels decreased and 1,5-AG levels increased from baseline in both treatment groups at Week 26, indicating better overall glycemic control in both treatment groups. The decrease in FBG levels was not significantly different between the treatment groups (LS mean difference − 0.38 mmol/L; 95 % CI −0.94, −0.18; P = 0.180), whereas the increase in 1,5-AG levels was significantly higher in the LM50 treatment group at Week 26 (LS mean difference − 2.72 mmol/L; 95 % CI −4.92, −0.52; P = 0.016; Table 3).
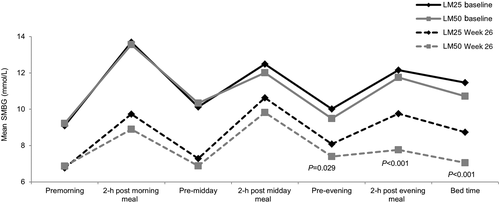
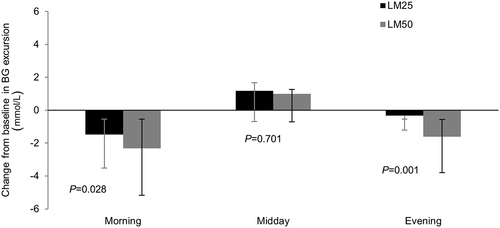
Analysis of the seven-point SMBG profiles showed that pre-dinner (LS mean difference 0.62 mmol/L; 95 % CI 0.07, 1.18; P = 0.029), post-dinner (LS mean difference 1.91 mmol/L; 95 % CI 1.12, 2.70; P < 0.001), and bedtime (LS mean difference 1.63 mmol/L; 95 % CI 0.92, 2.34; P < 0.001) glucose levels were significantly reduced at Week 26 in the LM50 compared with LM25 treatment group (Fig. 5). The LS mean change from baseline in SMBG for each meal excursion was significantly greater in the LM50 than LM25 group for morning (LS mean difference 0.83 mmol/L; 95 % CI 0.10, 1.55; P = 0.028) and evening (LS mean difference 1.28 mmol/L; 95 % CI 0.51, 2.04; P = 0.001) meals (Fig. 6). The LS mean change in the average SMBG excursion was −0.22 mmol/L (95 % CI −0.62, 0.17) for the LM25 group and −1.01 mmol/L (95 % CI −1.41, −0.61) for the LM50 group (LS mean difference 0.78 mmol/L; 95 % CI 0.23, 1.33; P = 0.006).
Insulin dosage
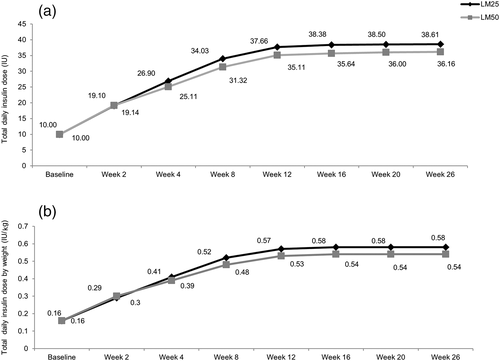
The mean daily insulin dose by visit and by weight was similar in both treatment groups during the 26-week treatment period. The total daily insulin dose was relatively constant from Week 12 onward in both treatment groups (Fig. 7).
Subgroup analyses
A significantly greater improvement in HbA1c at Week 26 was observed in the LM50 compared with LM25 group in male and female patients, as well as in patients aged <65 and ≥65 years (Table 4).
| Subgroup | Treatment (n) | Baseline (%) | Endpoint (%) | % LS mean change from baseline (95 % CI) | % Difference (95 % CI) in LS mean change from baseline | P-value |
|---|---|---|---|---|---|---|
| Baseline HbA1c (%) | ||||||
| < 8.4 | LM25 (37) | 7.6 ± 0.5 | 6.7 ± 0.6 | −0.86 (−1.06, −0.67) | 0.25 (−0.01, 0.52) | 0.061 |
| LM50 (40) | 7.6 ± 0.5 | 6.5 ± 0.5 | −1.12 (−1.31, −0.93) | |||
| ≥ 8.4 | LM25 (43) | 9.5 ± 0.7 | 7.4 ± 0.8 | −2.11 (−2.34, −1.87) | 0.81 (0.46, 1.16) | <0.001 |
| LM50 (36) | 9.5 ± 0.6 | 6.6 ± 0.6 | −2.92 (−3.17, −2.66) | |||
| Baseline mean BG excursion (PPG – FBG; mmol/L) | ||||||
| < 4.4 | LM25 (37) | 8.2 ± 1.0 | 6.8 ± 0.8 | −1.43 (−1.70, −1.16) | 0.35 (−0.02, 0.72) | 0.061 |
| LM50 (41) | 8.4 ± 1.1 | 6.6 ± 0.5 | −1.78 (−2.03, −1.53) | |||
| ≥ 4.4 | LM25 (43) | 9.0 ± 1.1 | 7.3 ± 0.8 | −1.66 (−1.93, −1.40) | 0.64 (0.26, 1.03) | 0.001 |
| LM50 (35) | 8.6 ± 1.1 | 6.5 ± 0.6 | −2.31 (−2.61, −2.01) | |||
| Baseline PPG based on SMBG (mmol/L) | ||||||
| < 13.5 | LM25 (43) | 8.1 ± 0.9 | 6.8 ± 0.7 | −1.20 (−1.41, −0.99) | 0.09 (−0.21, 0.38) | 0.547 |
| LM50 (35) | 7.8 ± 0.9 | 6.6 ± 0.5 | −1.29 (−1.53, −1.04) | |||
| ≥ 13.5 | LM25 (37) | 9.2 ± 1.1 | 7.4 ± 0.9 | −1.84 (−2.13, −1.55) | 0.76 (0.36, 1.15) | <0.001 |
| LM50 (41) | 9.0 ± 0.9 | 6.5 ± 0.7 | −2.60 (−2.87, −2.33) | |||
| Baseline FBG based on SMBG (mmol/L) | ||||||
| < 9.0 | LM25 (41) | 8.1 ± 0.9 | 6.9 ± 0.6 | −1.16 (−1.36, −0.97) | 0.19 (−0.09, 0.47) | 0.189 |
| LM50 (37) | 7.9 ± 0.9 | 6.7 ± 0.5 | −1.35 (−1.55, −1.14) | |||
| ≥ 9.0 | LM25 (39) | 9.2 ± 1.1 | 7.3 ± 1.0 | −1.94 (−2.22, −1.66) | 0.71 (0.32, 1.11) | 0.001 |
| LM50 (39) | 9.1 ± 1.0 | 6.4 ± 0.6 | −2.65 (−2.93, −2.37) | |||
| Gender | ||||||
| Male | LM25 (41) | 8.8 ± 1.1 | 7.1 ± 0.8 | −1.65 (−1.91, −1.38) | 0.47 (0.09, 0.85) | 0.017 |
| LM50 (41) | 8.5 ± 1.2 | 6.5 ± 0.6 | −2.11 (−2.38, −1.85) | |||
| Female | LM25 (39) | 8.4 ± 1.1 | 7.0 ± 0.8 | −1.44 (−1.70, −1.18) | 0.48 (0.10, 0.85) | 0.014 |
| LM50 (35) | 8.5 ± 1.0 | 6.6 ± 0.6 | −1.91 (−2.19, −1.64) | |||
| Age (years) | ||||||
| < 65 | LM25 (62) | 8.7 ± 1.1 | 7.1 ± 0.9 | −1.62 (−1.84, −1.40) | 0.46 (0.14, 0.78) | 0.006 |
| LM50 (54) | 8.5 ± 1.1 | 6.5 ± 0.6 | −2.08 (−2.31, −1.84) | |||
| ≥ 65 | LM25 (18) | 8.3 ± 1.0 | 7.0 ± 0.6 | −1.31 (−1.67, −0.95) | 0.60 (0.11, 1.09) | 0.018 |
| LM50 (22) | 8.4 ± 1.2 | 6.6 ± 0.6 | −1.92 (−2.25, −1.58) | |||
- Unless indicated otherwise, data are given as the mean ± SD.
- BG, blood glucose; CI, confidence interval; FBG, fasting blood glucose; LM25, insulin lispro mix 25; LM50, insulin lispro mix 50; LS, least squares; PPG, postprandial glucose; SMBG, self-monitoring of blood glucose; T2DM, type 2 diabetes mellitus.
With LM50 treatment, a significant improvement in HbA1c was observed compared with the LM25 treatment in subgroups with baseline HbA1c ≥8.4 %, blood glucose excursion ≥4.4 mmol/L, and PPG based on SMBG ≥13.5 mmol/L (Table 4).
Safety measures
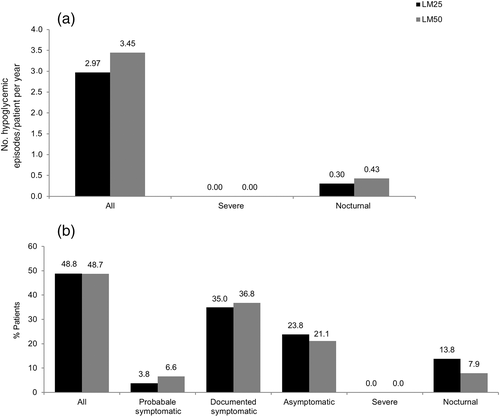
Both LM25 and LM50 were well tolerated during the study. Only two subjects discontinued from the study (one each in the LM25 and LM50 treatment groups) because of an adverse event (Fig. 2). The incidence of hypoglycemia was almost similar between the treatment groups, as assessed by the incidence of predefined hypoglycemic episodes except for nocturnal episodes (Fig. 8). Fewer patients reported nocturnal hypoglycemic episodes in the LM50 than LM25 treatment group (6 [7.9 %] vs 11 [13.8 %]); however, more nocturnal hypoglycemic episodes were reported in the LM50 than LM25 treatment group (16 vs 12).
At baseline, mean body weight was 65.34 ± 10.45 kg in the LM25 treatment group, compared with 65.51 ± 11.47 kg in the LM50 treatment group; at Week 26, mean body weight in the LM25 and LM50 treatment groups was 67.19 ± 10.77 kg and 66.75 ± 10.96 kg, respectively. The mean increase in body weight from baseline to Week 26 was not significantly different between the LM25 and LM50 treatment groups (LS mean difference 0.07 kg; 95 % CI −0.97, 1.10; P = 0.896).
Discussion
The results of the present study showed that T2DM patients in China benefitted from LM25 and LM50 b.i.d. injections, as evidenced by improvements in HbA1c, FBG, and PPG levels after 26 weeks treatment. Furthermore, the LM50 b.i.d. group demonstrated greater improvement than the LM25 b.i.d. group, as measured by HbA1c change from baseline. Similarly, a higher proportion of patients achieved target HbA1c with LM50 than LM25.
Similar results of significantly improved HbA1c and PPG were reported for LM50 after 24 weeks treatment in a non-randomized study in Japanese T2DM patients who were switched from premixed human insulin to LM25 or LM50.18 In that study, patients with higher PPG 2 h after breakfast (>11.1 mmol/L) were selectively switched to LM50, whereas patients with lower PPG (<11.1 mmol/L) were switched to LM25. These findings are consistent with the subgroup analyses in the present study, which indicated that LM50 is more effective at reducing HbA1c levels than LM25 in patients with baseline PPG ≥13.5 mmol/L (LS mean difference 0.76; 95 % CI 0.36, 1.15; P < 0.001), but not in patients with lower PPG (<13.5 mmol/L). In addition, in the present study, patients with higher baseline blood glucose excursions (>4.4 mmol/L) exhibited a greater decrease in HbA1c when treated with LM50 than LM25 (LS mean difference 0.64; 95 % CI 0.26, 1.03; P = 0.001), whereas the response to LM50 and LM25 is similar in patients whose blood glucose excursions are smaller (<4.4 mmol/L). Several Asian studies have demonstrated that LM50 is better in reducing blood glucose excursions than low mixtures,17, 18 as observed in the present study. It is known that East Asian diets usually contain more carbohydrates, which have a higher glycemic index22-24; therefore, LM50 may be more beneficial to patients with bigger blood glucose excursions than LM25 in Chinese subjects.
In the present study, LM50 was more effective than LM25 at reducing HbA1c levels in the subgroup of patients who had baseline HbA1c levels ≥8.4 % (LS mean difference 0.81; 95 % CI 0.46, 1.16; P = 0.001); however, no such effect was seen in the group of patients with baseline HbA1c levels <8.4 %. These results are similar to the first year results of the Treating to Target in Type 2 Diabetes (4-T) study.25
High HbA1c levels are associated with an increased risk of cardiovascular disorders in Asian and Western populations.26, 27 Although measurement of HbA1c remains the standard for assessing glycemic control in patients with T2DM, PPG measurements are also equally important in assessing glycemic control.28 Controlling PPG excursions is equally important because these have been associated with an increased risk of macrovascular diseases.29 Results from the Diabetes Epidemiology Collaborative Analysis of Diagnostic Criteria in Europe (DECODE) study showed an increase in mortality with increase in PPG regardless of FBG.29 The results of the present study showed a significantly greater decrease in average glucose excursions, as well as pre-dinner, post-dinner, and bedtime glucose levels, in the LM50 compared with LM25 group.
Plasma 1,5-AG is a glycemic marker monitored along with HbA1c to assess glycemic control in T2DM patients and could be used as an index reflecting PPG levels over the previous 48 h to 2 weeks.30-32 Treatment with premixed insulins showed more significant increases in 1,5-AG levels compared with basal insulin.33, 34 Similarly, the results of the present study showed an increase from baseline in 1,5-AG levels at Week 26 in both groups, with a greater increase observed in the LM50 compared with LM25 group, which is aligned with the PPG change reflected by SMBG profiles from baseline to the end of the study.
Premixed insulins improve HbA1c levels with higher rates of hypoglycemia and weight gain compared with basal insulin,25, 35, 36 and it is believed that the hypoglycemia risk and weight gain is more related to the ratio of mealtime insulin than basal insulin.37, 38 Interestingly, in the present study, although there was a small numerical increase in weight gain in both premixed groups, there was no significant difference between the LM50 and LM25 groups. In addition, no difference was noted in the incidence of hypoglycemia episodes between the treatment groups. No severe hypoglycemic episodes were reported in either treatment group. Although there were no significant differences in the rate and incidence of nocturnal hypoglycemic episodes between the treatment groups, the rate and incidence of nocturnal episodes were numerically higher in the LM50 compared with LM25 treatment group. Although the literature reports that the rate of nocturnal hypoglycemia is low with mid mixture insulins,39 the numerically higher rate and incidence of nocturnal hypoglycemia with mid mixture insulins in the present study may be due to more fragile patients who repeatedly had nocturnal hypoglycemia.
The main limitation of the CLASSIFY study is its open-label design. However, the patients were randomized by a computer-generated random sequence using an interactive voice-response system. To achieve between-group comparisons, patients were stratified based on HbA1c ≤8.5 % or >8.5, blood glucose excursions determined based on the average of two SMBG measurements (≤5 or >5 mmol/L [≤90 or >90 mg/dL]) during the week preceding the randomization visit, and country. Another limitation pertaining to this subgroup analysis was the small Chinese population size; the results need to be validated in a large randomized study.
In conclusion, the present study demonstrated that for Chinese patients with T2DM who are inadequately controlled with OAMs, premixed insulins LM25 b.i.d. and LM50 b.i.d. provide a viable treatment option. Furthermore, LM50 showed favorable results in subgroups with baseline HbA1c ≥8.4 %, blood glucose excursions ≥4.4 mmol/L, and PPG ≥13.5 mmol/L.
Acknowledgements
This research was supported by Eli Lilly and Company (Indianapolis, IN, USA). All authors participated in reviewing and interpreting the data and providing comments and revisions to the manuscript. All authors approved the final version of the manuscript and take full responsibility for the content. The authors thank Pavan Yenduri and Jeanne Claypoole (inVentiv Health Clinical, Hyderabad, India) for assistance in drafting and editing the paper (funded by Eli Lilly and Company).
Disclosure
QS, CL, HZ, JZ, WYY report no conflicts of interest for the submitted work. QS and HZ also report no conflicts of interest outside the submitted work. CL has received personal fees for lectures from AstraZeneca, Eli Lilly, Sanofi, Merck China, and MSD, and for being part of an advisory board for Eli Lilly, Sanofi, Jiangsu De Yuan, and Merck China. JZ has received grants from Novo Nordisk and Sanofi, personal fees for lectures from Gan & Lee Pharmaceutical, Novo Nordisk and Sanofi, and has been part of advisory boards for Novo Nordisk and Sanofi. WYY has received grants from AstraZeneca, as well as personal fees for lectures from Eli Lilly, Sanofi, and Novo Nordisk. PFL and LQ are employees of Eli Lilly and Company.


