The Calculating Boluses on Multiple Daily Injections (CBMDI) study: A randomized controlled trial on the effect on metabolic control of adding a bolus calculator to multiple daily injections in people with type 1 diabetes
经计算的追加剂量对每日多次注射(CBMDI)疗效影响的研究:1型糖尿病患者每日多次注射时使用追加剂量计算器对代谢控制影响的随机对照试验
Abstract
enBackground
Although the insulin bolus calculator is increasingly being used by people with type 1 diabetes (T1D) on multiple daily injection (MDI) therapy, few studies have investigated its effects on glycemic control. The aim of this study was to determine whether adding this device to therapeutic intensification could further improve metabolic control.
Methods
A 4-month randomized controlled clinical trial was performed comparing subjects undergoing therapeutic intensification and either using the bolus calculator (Cb group) or not (active control [Co] group). Metabolic control, fear of hypoglycemia, and treatment acceptance were evaluated.
Results
In all, 70 people completed the study (42 in the Cb group, 28 in the Co group). There was a significant decrease in HbA1c in both the Cb and Co groups (−7 mmol/mol [−0.7 %] vs −4 mmol/mol [−0.4 %], respectively). There were no significant differences in HbA1c at baseline or the end of the study, or in the decrease in HbA1c, glycemia, or changes in blood glucose levels at the end of the study between the two groups. There was a significant increase in the number of participants with good metabolic control (HbA1c <58 mmol/mol [7.5 %]) in the Cb group (from 16.7 % to 40.5 %), but not in the Co group. The incidence of hypoglycemic events was reduced slightly but significantly only in the Cb group. There was no change in the fear of hypoglycemia at the end of the study. The bolus calculator was well accepted.
Conclusions
In T1D, adding a bolus calculator to intensive MDI resulted in a significant improvement in metabolic control and slightly decreased the number of hypoglycemic episodes. Metabolic control also improved in the Co group.
Abstract
zh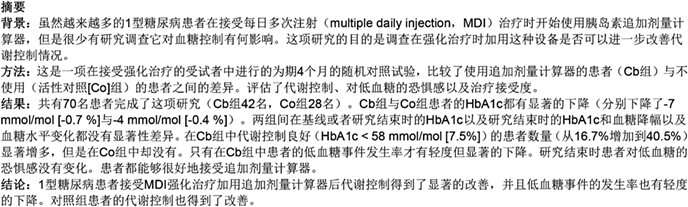
Significant findings of the study: Adding a bolus calculator to an intensified multiple daily injection protocol resulted in a significant improvement in glycemic control. Metabolic control also improved in the control group.
What this study adds: Unlike other intensive treatments and what has been reported previously, the use of a bolus calculator was associated with a slight but significant decrease in hypoglycemic events.
Introduction
Multiple daily injections (MDI) in people with type 1 diabetes (T1D) are associated with the performance of several calculations before eating or correcting hyperglycemias, such as counting carbohydrates (CH) and calculating insulin boluses according to the insulin: CH ratio (CarbF) and insulin sensitivity factor (ISF), among others. Mental calculations may be complex, making it difficult to adhere to this practice. In addition, some people underestimate bolus doses because of a fear of hypoglycemia or, conversely, administer corrective bolus doses regardless of active insulin, causing iatrogenic hypoglycemia. Bolus calculators (BCs) take into account current glucose levels, target blood glucose levels, CH, ISF, CarbF, and active insulin; thus, a BC may substantially facilitate treatment with MDI.1, 2
Initial experience with BCs came from insulin pumps (continuous subcutaneous insulin infusion [CSII]) in both adult3-8 and pediatric–adolescent9-12 populations. We have also published short reports of our experience with BCs in CSII.13, 14 A systematic review reported non-homogeneous results regarding metabolic control,15 whereas other studies have reported an association between more frequent BC and better glycemic control6 and no changes in insulin requirements.4, 6, 11 The most common positive finding was a reduction in postprandial glycemia.3, 5, 9 A non-significant tendency towards fewer hypoglycemic episodes was found in two randomized trials.3, 9, 15 One study has reported more major hypoglycemic events with the use of BCs,4 but most other studies have not.15 A recently published randomized study in a pediatric–adolescent population found a clear reduction in hypoglycemia with the use of BCs.12
Recently, new versions of BCs have become available for people on MDI treatment, either isolated devices (Calsulin; Thorpe Products, Cambridge, UK), combined with a glucose meter (Accu-Chek Aviva Expert [Roche Diagnostics, Indianapolis, IN, USA], Freestyle InsuLinx [Abbott Diabetes Care, Alameda, CA 94502, USA]) or as smartphone applications. However, the contribution of these BCs to metabolic control, treatment adherence, psychological effects have only been documented in a small number of studies.
A large retrospective survey of subjects using a BC found that the subjects felt that using a BC was easier than performing manual bolus calculations, improved their confidence, and reduced their fear of hypoglycemia.16 A study of the Freestyle InsuLinx (Abbott Diabetes Care) assessed mistakes in bolus calculations made either manually or with a BC in both in type 2 diabetes and T1D and found that most patients who performed the calculations manually made mistakes.17 The first randomized trial of Calsulin (Thorpe Products) performed in T1D patients found an improvement in HbA1c in the experimental group.18 Two recent randomized studies,19-23 both on Accu-Chek Aviva Expert (Roche Diagnostics), provided further information on this topic. The BolusCal study was a 16-week trial on poorly controlled T1D patients who were divided into three groups, namely a control and two intervention groups, both on active CH counting, applying the ISF etc., but only one using a BC. In both intervention arms, HbA1c improved, but satisfaction with treatment was greater in the arm using the BC.19, 20 The other study, the Automated Bolus Advisor Control and Usability Study (ABACUS), was a multinational 26-week randomized trial with a high number of participants, mostly subjects with T1D, divided into two groups, both using the same concepts (CH counting, ISF etc.), but only one using a BC.21-23 More subjects in the group using the BC than in the control group achieved a reduction in HbA1c of >6 mmol/mol (>0.5 %), but there was an increase in the number of hypoglycemic episodes compared with the control group and subjects using the BC reported greater treatment satisfaction.22
Thus, the primary aim of the present study was to evaluate improvements in glycemic control obtained with therapeutic intensification in combination with the use of a BC compared with the same intensification without the device in T1D patients on MDIs. In addition, we evaluated patients' acceptance of the use of the BC, its effect on the fear of hypoglycemia, and to test changes in CarbF and ISF for different meals during the trial according to the use of the BC.
Methods
The Calculating Boluses on Multiple Daily Injections Therapy (CBMDI) study was performed in the Endocrinology and Nutrition Department of the Hospital Universitario Regional de Málaga. The study was approved by the Investigation Ethics Committee of the Málaga Regional University Hospital and conforms to the provisions of the Declaration of Helsinki.
The study was a 4-month randomized controlled prospective parallel-arm clinical trial. Because the trial was not investigating a drug, but rather a medical device for an authorized indication, the Agencia Española de Medicamentos y Productos Sanitarios (AEMPS) advised that a European Clinical Trials Database (EudraCT) number was not needed for the study.
The study participants were T1D patients aged 18–65 years with a duration of diabetes of >5 years, HbA1c >53 mmol/mol (7 %), on MDI treatment (basal insulin: detemir or glargine; any quick insulin analogue), and without severe hypoglycemic episodes (loss of consciousness, glucagon use, and/or medical aid) in the previous year who were willing to deal with concepts such as CH counting and calculation of prandial and corrective insulin.
All subjects were visited twice prior to starting the study. At the first visit, it was confirmed that the subject fulfilled the inclusion criteria, informed consent was obtained, and educational support was provided. An Accu-Chek Aviva Nano (Roche Diagnostics, Barcelona, Spain) glucose meter was given to all participants and they were asked to perform frequent self-monitoring of blood glucose (SMBG; ideally three preprandial and three postprandial tests per day at least 2 weeks prior to the second visit). Subjects were trained as to how SMBG, CH servings, insulin injections, hypoglycemic episodes, and other events (marked, pronounced, >250 mg/dL). Then, subjects were randomized to either a group using the bolus calculator (Cb group) or not (active control [Co] group). At the second visit, 2 weeks after the first, based on records of glucose self-monitoring and lifestyle (job days), the BC (Accu-Chek Aviva Expert; Roche Diagnostics) was programmed, whereas appropriate adjustments were made, if necessary, in CarbF and ISF for subjects in the Co group. Participants using the BC were visited again 2 weeks later to ensure they were using the device properly. Both groups had two follow-up visits, after 2 and 4 months, in which they were reminded how to calculate the amount of insulin given as prandial or correction boluses, depending on carbohydrates and current glycemia, and CarbF and ISF were modified if needed. The intensive therapeutic approach was exactly the same for both groups, with the only difference between the two groups being the use of the device. Data were downloaded from the BC using Smart Pix (Roche Diagnostics) and were compared with data from paper records made by all subjects in both groups throughout the day. Venous blood samples were analyzed at baseline and after 4 months, whereas capillary HbA1c was measured after 2 months. Clear non-adherence to the study protocols (i.e. not performing enough SMBG tests to enable treatment adjustments, not counting CH servings, not appropriately registering items, registering false results, and/or missing or delaying visits without properly justification) was considered sufficient reason for withdrawal.
Treatment acceptance was evaluated using the “Devices Utilization by the Patient” questionnaire reproduced from the ProAct Study8 with the authorization of Roche Diabetes Care. It is a self-administered test consisting of nine questions about the handling and acceptance of the BC. Subjects answered using a five-point scale 1-5, with a score of 5 being the most positive assessment. In addition, subjects completed the Fear of Hypoglycemia Scale (FH-15)24 and the Diabetes Treatment Satisfaction Questionnaire (DTSQ)25 at baseline and after 4 months.
The primary outcome was metabolic control. The response variables were HbA1c, glycemia (from downloaded SMBG data; pre- and postprandial), frequency of SMBG, frequency of hypoglycemic events (<3.9 mmol/L, 70 mg/dL) in the 2 weeks before the visit, severe hypoglycemia (loss of consciousness or seizures, and/or glucagon administration and/or medical or third-party assistance), insulin requirements, changes in CarbF and ISF, glycemic variability, standard deviations (SD) of glycemias, mean amplitude of glycemic excursions (MAGE), coefficients of variation (CV) of glycemias, and low blood glucose index (LBGI).
To detect a differences in HbA1c of >6 mmol/mol (>0.5 %) between groups (15 % losses, power 80 %), it was calculated that a sample size of 41 patients per group was required. Data processing was performed using the R statistical software package (R Foundation for Statistical Computing, Vienna, Austria). A per-protocol analysis was performed. Descriptive results are shown as mean values with 95 % confidence intervals (CIs), or as proportions. The significance of differences between proportions was evaluated using the χ2 test with Yates correction for cells including fewer than five elements. The significance of differences between continuous variables were evaluated using analysis of variance (ANOVA) or Student's t-test for variables that followed a normal distribution, whereas variables that did have a normal distribution were evaluated using a non-parametric test (Mann–Whitney or Wilcoxon tests). Correlations were evaluated using Pearson's test. Variables tested repeatedly over time were analyzed with an ANOVA for repeated variables. The null hypothesis was rejected for two-tailed α ≤ 0.05.
Results
Figure 1 shows a flow chart of randomization from screening to allocation. In all, 85 people were randomized, but only 70 completed the first phase of the study (42 in the Cb group and 28 in the Co group). Both groups were comparable at baseline for age, sex, duration of DM, body mass index (BMI), the presence of cardiovascular risk factors and microvascular complications, and for basal HbA1c (Table 1).

| Cb | Co | P-value | |
|---|---|---|---|
| No. subjects | 42 | 28 | |
| No. (%) women | 25 (59.5) | 13 (46.4) | 0.28 |
| Mean age (years) | 30.7 (26.9–34.5) | 34.2 (29.5–38.9) | 0.24 |
| Marital status: single | 30 (71.4 %) | 18 (64.3 %) | 0.53 |
| Level of education | |||
| Primary/High school | 30 (71.4 %) | 23 (82.1 %) | 0.31 |
| University graduate | 12 (28.6 %) | 5 (17.9 %) | |
| Occupation | |||
| Employed | 17 (40.5 %) | 12 (42.9 %) | |
| Unemployed | 14 (33.3 %) | 8 (28.6 %) | 0.91 |
| Student | 11 (26.2 %) | 8 (28.6 %) | |
| Mean duration of DM (years) | 14.8 (11.7–17.8) | 16.2 (12.9–19.5) | 0.53 |
| HbA1c | |||
| % | 8.4 (8.1–8.6) | 8.3 (8–8.7) | 0.88 |
| mmol/mol | 68 (65–70) | 67 (64–72) | |
| No. hypoglycemic episodes/2 weeks | 8.4 (6.9–9.8) | 6.7 (4.9–8.5) | 0.15 |
| BMI (kg/m2) | 24.67 (23.4–25.9) | 24.92 (23.6–26.2) | 0.79 |
| Total insulin (IU/kg per day) | 0.91 (0.81–1.01) | 0.91 (0.79–1) | 0.36 |
| Hypertension | 6 (14.3 %) | 3 (10.7 %) | 0.66 |
| Dyslipidemia | 9 (21.4 %) | 12 (42.9 %) | 0.06 |
| Diabetic retinopathy | 4 (9.5 %) | 6 (22.2 %) | 0.16 |
| Diabetic nephropathy | 2 (4.8 %) | 0 (0 %) | 0.24 |
- Unless indicated otherwise, data are given as mean values with 95 % confidence intervals in parentheses, or as n (%). There were no significant differences between subjects using the bolus calculator (Cb group) and those not using the calculator (active control [Co] group) at baseline.
- DM, diabetes mellitus; BMI, body mass index.
At 4 months, there was a significant decrease in HbA1c in both the Co and Cb groups (Table 2). There was no significant difference in HbA1c at 4 months between the Cb and Co groups, or in the decrease in HbA1c, expressed either in absolute terms or as a percentage reduction from baseline (Table 2).
| Cb (n = 42) | Co (n = 28) | |||
|---|---|---|---|---|
| Baseline | 4 months | Baseline | 4 months | |
| HbA1c | ||||
| Concentration | ||||
| % | 8.4 (8.1–8.6) | 7.7* (7.5–7.9) | 8.3 (8–8.7) | 7.9* (7.6–8.3) |
| mmol/mol | 68 (65–70) | 61 (58–63) | 67 (64–72) | 63 (60–67) |
| Decrease (%) | −0.7 (−0.9, −0.4) | −0.4 (−0.6, −0.1) | ||
| No. SMBG tests | ||||
| Daily | 5.3 (4.9–5.6) | 4.6* (4.3–5.0) | 5.3 (4.9–5.7) | 5.0 (4.5–5.5) |
| Postprandial | 2.1 (1.8–2.3) | 1.5* (1.3–1.8) | 1.8 (1.5–2.1) | 1.8 (1.5–2.1) |
| Insulin (IU/kg per day) | ||||
| Basal | 0.58 (0.5–0.66) | 0.58 (0.49–0.67) | 0.6 (0.49–0.7) | 0.62 (0.51–0.74) |
| Prandial | 0.33 (0.29–0.38) | 0.33 (0.29–0.37) | 0.31 (0.27–0.36) | 0.33 (0.29–0.37) |
| Total | 0.91 (0.81–1.01) | 0.92 (0.81–1.03) | 0.91 (0.79–1) | 0.96 (0.83–1.1) |
| Glycemia (mg/dL) | ||||
| All reported glycemias | 165 (157–175) | 166 (156–177) | 169 (157–181) | 176 (162–190) |
| Preprandial | 162 (153–170) | 164 (154–174) | 163 (149–176) | 180* (160–188) |
| Postprandial | 176 (165–188) | 173 (160–185) | 176 (165–187) | 177 (161–192) |
| No. hypoglycemic episodes/2 weeks | 8.4 (6.9–9.8 ) | 6.5* (5.2–7.8) | 6.7 (4.9–8.5) | 5.9 (4.3–7.4) |
| Fear of hypoglycemia | 28.0 (25.4–30.5) | 27.0 (24.2–29.9) | 27.0 (24.2–29.9) | 27.4 (23.3–31.4) |
| LBGI† | ||||
| Minimum/low | 18 (43 %) | 26 (62 %) | 19 (68 %) | 22 (78.6 %) |
| Moderate/high | 24 (57 %) | 16 (38 %) | 9 (32 %) | 6 (21.4 %) |
| SD total (mg/dL) | 77.7 (72.4–82.9) | 74.9 (69.6–80.2) | 77.9 (69.4–86.4) | 82.6 (73.1–92.1) |
| MAGE (mg/dL) | 164 (145–180) | 146 (125–166) | 156 (136–176) | 154 (133–175) |
| CV (%) | 47.1 (44.5–49.7) | 45.5 (42.9–48.1) | 45.9 (42.7–49.1) | 46.7 (43.7–49.7) |
- Unless indicated otherwise, data are given as mean values with 95 % confidence intervals in parentheses, or as n (%).
- * P < 0.05 compared with baseline.
- Cb, subjects using the bolus calculator; Co, control group (treatment intensification, but not using the bolus calculator); SMBG, self-monitoring of blood glucose; MAGE, mean amplitude of glycemic excursions; SD, standard deviation; CV, coefficient of variation.
- † The low blood glucose index (LBGI) was divided into two groups, minimum/low and moderate/high, corresponding to <2.5 or ≥2.5 respectively.
The proportion of subjects achieving a decrease in HbA1c >6 mmol/mol (>0.5 %) or >11 mmol/mol (>1 %) is shown in Fig. 2; there was no significant difference between the Cb and Co groups. Similarly, there was no significant difference in the percentage of subjects who had good metabolic control (HbA1c <58 mmol/mol [7.5 %]) at baseline or after 4 months; nevertheless, the proportion of subjects with good HbA1c (<58 mmol/mol, 7.5 %) increased significantly in the Cb group from baseline to 4 months (16.7 % vs 40.5 %; P < 0.05), whereas the increase in the Co group was not significant (Fig. 3).


Mean pre- and postprandial glycemia did not change over the study (Table 2). There was a correlation between HbA1c at 4 months and glycemia (r = 0.57, P < 0.001) and an inverse correlation between HbA1c at 4 months and the frequency of SMBG (r = −0.27, P < 0.02).
The mean (95 % CI) number of hypoglycemic events over a period of 2 weeks was reduced significantly in the Cb group from baseline to 4 months (8.4 [6.6–9.8] vs 6.5 [5.2–7.8]; P = 0.022), but not in the Co group. Nevertheless, three people in the Cb group and one in the Co group had an episode of severe hypoglycemia (all requiring third-party assistance for oral intake, without loss of consciousness or the need for glucagon or medical aid). No differences were found between groups for the overall number of hypoglycemic events or severe hypoglycemia. Similarly, there was no significant difference in the fear of hypoglycemic events between the two groups at any time during the trial (Table 2).
In the Cb group, there was a decrease in the frequency of SMBG throughout the study (Table 2). Insulin requirements showed no differences between the groups or during the trial period. No significant differences were found in measurements of glycemic variability at either 4 months versus baseline or between groups (Table 2).
Figure 4 shows CarbF distribution. At baseline, for breakfast, 78.6 % of participants in the Cb group and 50 % in the Co group where using CarbF =1 (P < 0.05). Similarly, there were no differences between the two groups in CarbF at lunch and dinner, with most using CarbF =1. At 4 months most subjects in both groups were using CarbF >1 for breakfast, with the change being significant only for the Cb group (21.4 % at baseline vs 59.5 % at 4 months; P < 0.001).

Figure 5 shows ISF. At the beginning of the study, an ISF of 50 mg/dL was predominant. At 4 months, participants in the Cb group were mostly using an ISF of <50 mg/dL for breakfast and dinner, whereas those in Co group were using an ISF of ≥50 mg/dL (P < 0.05).

Changes in CarbF or ISF were not related to significant changes in insulin requirements or the frequency of SMBG.
As shown in Fig. 6, most subjects considered that it was easy to learn to use the BC, that it was useful in improving control of their disease, and they were using it for most decisions regarding bolus calculations.

With regard to treatment satisfaction, total DTSQ scores did not differ significantly between the Cb and Co groups at either baseline (25.2 [95 % CI 23.4–26.9] vs 27.8 [95 % CI 25.8–29.8], respectively) or after 4 months (11.9 [95 % CI 10.6–13.2] vs 11.2 [95 % CI 9.3–13.2], respectively), In addition, there were no significant differences between the Cb and Co groups in the score for the specific hypoglycemia item on the DTSQ at baseline (2.1 [95 % CI 1.7–2.5] vs 1.9 [95 % CI 1.3–2.5], respectively) or after 4 months (−0.5 [95 % CI –1, −0.01] vs −0.5 [95 % CI –1, −0.2], respectively).
Discussion
Before deciding on an insulin bolus, MDI- and CSII-treated patients have to perform complex mathematical equations taking into consideration CarbF, ISF, and remnant active insulin. Bolus calculators are devices that perform these calculations. The successful use of BCs requires the training of patients, initial programming (and reprogramming if necessary at follow-up) of the device, and acceptance of and confidence in the proposed insulin dosage. The use of BCs is gaining ground in the field of diabetes support. The question remains as to whether they are simply a tool to facilitate calculations or whether they have a role in the metabolic control of DM. The reports in the literature thus far indicate that these new BCs make people's lives easier and decision making safer.1, 17, 26, 27 Several studies have reported on the effects of this approach on psychological well being and metabolic control in both CSII3, 15 and, more recently, in the case of MDI treatment.16-23 Many studies revealed improved patient satisfaction with treatment, confidence, preference, adherence, and even a reduced fear of hypoglycemia.
The present study focused on metabolic control on people with T1D on MDI treatment. There was a significant decrease in HbA1c with the intervention (use of BCs), but this decrease was not greater than that seen in the control (active treatment) group; that is, both forms of therapeutic intensification resulted in improved glycemic control. Nevertheless, significantly more participants in the Cb group shifted to having good metabolic control (HbA1c <58 mmol/mol; <7.5 %) than in the Co group.
The two most important randomized studies on adult MDI-treated patients have found significant decreases in HbA1c, for both experimental and active control groups.19, 22 A previous study improved HbA1c in people using a BC compared with no change in the control group18; however, the intensification of treatment was not described in detail in that study.
We did not find a significant difference in the decrease in HbA1c between the Co and Cb groups (−0.7 % vs −0.4 %; difference 0.3 %). Approximately the same difference (0.2 %) was found to be significant in ABACUS,22 and we think this could be because of the larger sample size in ABACUS. A trend towards significance (P < 0.075) was found in the BolusCal study for a similar difference in the decrease in HbA1c (0.3 %) determined excluding outliers and adjusted for basal HbA1c.19 It may be that a greater sample size in the present study would have improved power of the study to detect significant differences in the decrease in HbA1c between arms; however, taking the sample size of ABACUS into consideration, it is unlikely that differences in absolute HbA1c values would have reached statistical significance.
We were unable to demonstrate differences between groups when considering a decrease in HbA1c of >0.5 % or >1 % versus baseline. In ABACUS, more participants in the experimental group achieved a reduction in HbA1c >0.5 %, but this was from a higher baseline HbA1c than in the present study (74 mmol/mol [8.9 %] vs 68 mmol/mol [8.4 %]), which is likely why the decline was significant.22
Some previous studies on CSII treatment have reported decreases in postprandial glycemia.3, 5, 9 We are not able to explain why there was no significant change in glycemia in the present study, either pre- or postprandially, given that HbA1c decreased. The BolusCal study showed a decrease in the time spent in hyperglycemia (>140 mg/dL, 7.8 mmol/L), measured by a blinded continuous glucose monitoring system (CGMS), in the experimental BC group.19
In the present study, HbA1c was inversely correlated with the frequency of SMBG; unexpectedly and unlike in another study,15 the frequency of self-monitoring of blood glucose levels decreased in the Cb group over the duration of the study. Perhaps this could be due to participants feeling progressively more confident about insulin advice from the BC. As noted above, this group exhibited a similar decrease in HbA1c as seen in the Co group; it is possible that the metabolic improvements in the Cb group could have been greater if the adherence to protocol recommendations had been better.
A significant decrease in hypoglycemic events was observed only in the Cb group. We consider this finding relevant because the risk of some therapeutic intensification strategies may contribute to an increase in hypoglycemic episodes, primarily severe episodes.28 People labeled as having suffered severe hypoglycemia could be considered “mildly” severe, without experiencing loss of consciousness or requiring medical aid. As noted above, a trend towards a decrease in the number of hypoglycemic episodes has been reported in preliminary studies of CSII treatment.15 In recent studies, only one trial found a reduction in hypoglycemic events, specifically in children also treated with CSII.12 In contrast, ABACUS reported more hypoglycemic events for participants in the Cb group22 and the BolusCal study did not report differences between study arms.19 In the case of severe hypoglycemia, no differences were found between groups in either the present or other studies. The question arises, why could the number of hypoglycemic events be reduced in the Cb group? It is possible that both better individualization of the ISF (which decreased over the course of the study in the Cb group) and the fact that BC programming takes into account active insulin from previous corrections of hyperglycemia could have avoided overdoses for new corrections.
There were no improvements in FH-15 scores regarding fear of hypoglycemia. This could be explained by the FH-15 being a questionnaire with a cut-off point to determine whether an individual has a fear of hypoglycemia, which could have made it more difficult to find changes. Another retrospective survey found that the fear of hypoglycemia had improved in more than 50 % of people using a BC.16
Most participants at baseline were using CarbF =1 and ISF = 50 mg/dL. After 4 months a 59.5 % of participants in Cb group were using CarbF >1 for breakfast and 38.1 % were using CarbF <1 for lunch. It seems clear that there were differences in CarbF depending on the meal. In terms of ISF, as reported previously,23 significantly more changes were made for the Cb than Co group during the study, especially for breakfast and dinner. As far as we know, no other study has analyzed changes in CarbF or ISF separately according to mealtime.
No changes in measures of glycemic variability between groups were found. However, ABACUS described a reduction in MAGE for participants using BCs.19
There was a high dropout and withdrawal rate in the present study (17.6 %), mostly in people assigned to the Co group, just or near after the first visit. This could be due to disappointment for not being included in the Cb group. In contrast, there were more withdrawals over the duration of the study in the Cb group because of poor adherence to the study protocol. There were no dropouts because of difficulties managing the device; in fact, the participants considered the BC easy to be learn and used.
The main strength of the present study is its controlled prospective randomized design. With regard to its limitations, the more dropouts in Co group at baseline may have biased this group to retaining participants more likely to adhere to the study protocol. Moreover, many patients did not perform many postprandial SMBG, and even people in Cb group reduced the number of postprandial SMBG over the course of the study, making reprogramming of CarbF and ISF (and so potential benefits in metabolic control) more difficult. In addition, as already noted, an increased sample size could have made it easier to detect significant differences between groups in the decrease in HbA1c. Because the sample size was not calculated to address secondary endpoints, such as the reduction in hypoglycemic events, this finding, even thought it is considered relevant by the authors, is to be interpreted with caution.
In conclusion, we can say that the addition of a BC to MDI treatment of patients with T1D allowed them to achieve a significant improvement in metabolic control; glycemic control also improved significantly in the Co group. This improvement was not associated with an increase in the number of hypoglycemic events, and a slight but significant decrease was even found in the Cb group. The BC was well accepted and we think it facilitates better management and individualization of CarbF and ISF. In our opinion, T1D patients who are adherent to their intensified basal/bolus treatment, which usually counts CH, make frequent SMBG measures (not only before meals, but also after meals to test CarbF), have different CarbF and/or ISF depending on the time of the day or meal, and manage well with technological devices could be offered a BC.
Acknowledgements
This project was supported financially by Sociedad Andaluza de Endocrinología y Nutrición (SAEN). No other funding was received. The authors thank Roche Diagnostics (Barcelona, Spain) for providing the Accu-Chek Aviva Expert and Accu-Chek Aviva Nano devices for the study. Diabetes trained nurses and endocrinologists were responsible for programming the devices and training subjects in their use. The authors thank nurses M. Fontalba and M. Guerrero (Investigation Unit, Endocrinology and Nutrition Department, Málaga Regional Hospital) for their participation in the trial, and C. Corazza (School of Translators and Interpreters, Málaga University) for support with the translation of this article.
Disclosures
MRV-M, MD-L, MSR-d-A-N and MSG-R have received funding from Roche Laboratories to attend courses and conferences. The Endocrinology and Nutrition Department of Málaga Regional University Hospital, and specifically MSG-R as the main investigator, participated in the ProAct study (Accu-Chek Aviva Combo on insulin pumps treatment), which was unrelated to the financial support received for the present study. In 2012, Roche Diabetes Care (Barcelona, Spain) made a contribution for generic investigations into diabetes to the Endocrinology and Nutrition Department, Málaga Regional University Hospital, through the Maimonides Investigation Foundation that was used to hire a nurse for 1 year who worked on several diabetes-related projects.