Molecular mechanisms of action of styrene toxicity in blood plasma and liver
Funding information: This research work was partially supported by a grant from International Campus of Tehran University of Medical Sciences with the code number 94-04-103-30916. Authors wish to thank the general assistance of the Iran National Sciences Foundation (INSF).
Abstract
Styrene is an aromatic colorless hydrocarbon available in liquid form and highly volatile. In its pure form, it gives a sweet smell. The primary source of exposure in the environment is from plastic materials, rubber industries, packaging materials, insulations, and fiber glass and carpet industry. Natural sources of styrene include: few metabolites in plants which are transferred through food chain. The current study was designed to evaluate styrene toxicity, including: superoxide dismutase (SOD) and protein carbonyl, oxidative stress, glucose-6-phosphatase (G6Pase), glycogen phosphorylase (GP), and phosphoenolpyruvate carboxykinase (PEPCK) activities, adenosine triphosphate (ATP) to adenosine diphosphate (ADP) ratio, and changes in gene expressions such as glutamate dehydrogenase 1 (GLUD1), glucose transporter 2 (GLUT2), and glucokinase (GCK) in the rat liver tissue. For this purpose, styrene was dissolved in corn oil and was administered via gavage, at doses 250, 500, 1000, 1500, 2000, mg/kg/day per mL and control (corn oil) to each rat with one day off in a week, for 42 days. Plasma SOD and protein carbonyl of plasma were significantly up-regulated in 1000, 1500, and 2000 mg/kg/day styrene administrated groups (P < .001). In addition, styrene caused an increase in lipid peroxidation (LPO) and reactive oxygen species (ROS) in the dose-dependent manners in liver tissue (P < .001). Furthermore, the ferrous reducing antioxidant power (FRAP) and total thiol molecules (TTM) in styrene-treated groups were significantly decreased in liver tissue (P < .001) with increasing doses. In treated rats, styrene significantly increased G6Pase activity (P < .001) and down-regulated GP activity (P < .001) as compared to the control group. The PEPCK activity was significantly raised in a dose-dependent manner (P < .001). The ATP/ADP ratio of live cells was significantly raised by increasing the dose (P < .001). There was significantly an up-regulation of GLUD1 and GCK at 2000 mg/kg group (P < .01) and a down-regulation for GLUT2 at the same dose. While in the rest of group, GLUT2 showed up-regulation of relative fold change. By targeting genes such as GLUD1, GLUT2, and GCK, disruption of hepatic gluconeogenesis, glycogenolysis, and insulin secretory functions are obvious. The present study illustrates that induction of oxidative stress followed by changes in G6Pase, GP, and PEPCK activities and the genes responsible for glucose metabolism are the mechanisms of styrene's action in the liver.
1 INTRODUCTION
Styrene (C6H5CHCH2) also known as ethenylbenzene, vinylbenzene, and phenylethene is an organic aromatic hydrocarbon used in manufacturing, utilized in daily food packaging and its production in the United State is high, reported in literature.1 Small amount is naturally produced by bacteria high, fungi, and plants.2 The general exposure to styrene is low in the environment, however, people working in the reinforced plastic, rubber, and industrial factories are exposed at levels. Epidemiological studies revealed that styrene is potential carcinogenic, while multiple chemicals and inadequate exposure make it inconclusive dangerous. Though, styrene is hepatotoxic and cause lung cancer in mice–animal models3, 4 but, no evidence of lung tumors was seen in the rat model. The International Agency for Research on Cancer (IARC) categorized styrene in class II-B, which is possible human carcinogen and its metabolites such as styrene-7,8-oxide (SO) placed in II-A (probable human carcinogen).4
Long-term exposure to styrene induces lung cancer in mice; however the exact mechanism is unknown. One possible mechanism is the oxidative stress, as lung tissues have high content of glutathione (GSH), which maintain the balance between oxidants and antioxidants. In the rodents, epoxide hydrolase detoxifies styrene up to 50%-70%,3 while remaining is counterpart via conjugation of styrene with GSH. On the other hand, epoxide hydrolase minimized 95% of styrene in human.3 The use of physiologically based pharmacokinetic model lowered the level of GSH up to 40%.5 This shows that low levels of GSH are a sign of oxidative stress, as it works as scavenger of free radicals to prevent from oxidative stress. The alterations in the level of reactive oxygen species (ROS), lipid peroxidation (LPO), and total thiol molecules (TTM) as well as changes in superoxide dismutase (SOD) result in oxidative stress, which is the main defensive mechanism against ROS. The content of protein carbonyl in the diseases, such as diabetes, Alzheimer's disease, inflammatory bowel disease, and arthritis is an indication of protein oxidation.6-8 The conversion of G to T and A to C occurred due to oxidative stress in 8-hydroxydeoxyguanosine formation, which leads to tumor initiation.9, 10 The physiochemical activities of mitochondria and endoplasmic reticulum of the hepatocytes alter due to ROS in the protein, lipid, and DNA via cytochrome P450 enzymes. Various diseases such as diabetes, cancer, cardiovascular, and neurodegenerative disorders are triggered due to oxidative stress.11
The vital organs involved in the glucose homeostasis are liver, pancreas, and muscles. In contrast to other physiological activities, liver play significant role in the maintenance of blood glucose level in equilibrium between uptake and storage in the form of glycogen and release of glucose through glycogenolysis and gluconeogenesis12 while pancreas releases insulin. The enzymes involved in the maintenance of glycogenolysis and gluconeogenesis are glucose-6-phosphatase (G6Pase), glycogen phosphorylase (GP), and phosphoenolpyruvate carboxykinase (PEPCK). The elevated activities of G6Pase and PEPCK along with down-regulation of GP activity indicated insulin resistance and type-2 diabetes.12, 13 The type-2 diabetes is categorized by inappropriate and/or failure to produce insulin to overturn glucose production in the liver and kidney. Insulin has direct or secondary mechanisms to prevent glucose production. The gluconeogenetic and glycogenolytic enzymes such as G6Pase, GP, and PEPCK result in transcriptional suppression. Insulin act as antagonist for gluconeogenesis and glycogen and glucocorticoids as activators, however, some extrinsic and intrinsic intracellular signaling pathways can change these enzymes. Therefore, the formation of ROS and free radicals strongly affect physiological signal transduction, lead to many devastating diseases.14, 15 There is correlation between GSH concentration and adenosine triphosphate (ATP) and adenosine diphosphate (ADP). The lower level of GSH increase susceptibility toward apoptosis following exposure to diethylmaleate, which explore ATP and ADP ratio,16-18 also depletes ROS and GSH. The major styrene metabolite such as SO trigger apoptosis in time and dose-dependent manure.19 Cellular damage in the form of ATP and ADP ratio result in hyperplasia of Clara cells.20
In vitro study explored that the genotoxic effects of styrene and/or its metabolites such as SO showed dose-dependent decrease in the cell viability and caused up-regulation of hypoxanthine phosphoribosyltransferase gene mutation, DNA strand break, and O-6-guanine DNA adducts in human peripheral lymphocytes.21 Styrene metabolites induce DNA damage and oxidation of pyrimidine base detectable via endonuclease-III.22 Styrene and 1,3-butadiene in the rubber, plastic, and petroleum industries exposures mutate GSTM1 and GSTT1 genotypes.23, 24 However, the sum of experimental and epidemiological studies have revealed toxicities of styrene ranging from blood cancer to genotoxicity. However, the pure styrene has never been explored for the oxidative stress in liver tissue, vital enzymatic activities responsible for insulin and genes responsible for glucose metabolism. This study aimed to examine styrene altered plasma SOD and protein carbonyl, oxidative impairment in liver tissue, G6Pase, GP, and PEPCK activities, ATP and ADP ratio, and expression of specific enzymes genes responsible for glucose metabolism.
2 MATERIAL AND METHODS
2.1 Chemicals
Styrene (S7020079 816), sodium chloride (NaCl), 5,5-dithiobis (2-nitrobenzoic acid), ethylenediaminetetraacetic acid (EDTA), 2,4,6-tripyridyl-S-triazine (TPTZ) from the Merck Company (Frankfurter Str. 250, 64293, Darmstadt, Germany), along with K2HPO4, ADP sodium salt, ATP, bovine serum albumin (BSA), collagenase, d-glucose, 2,7-dichlorodihydrofluorescein-diacetate (DCFH-DA), glucose-6-phosphate dehydrogenase (G6PD), glucose oxidase, glucose peroxidase, phosphate buffer, phosphoenolpyruvate (PEP), thiobarbituric acid (TBA), Tris-HCL, and trichlororacetic acid were purchased from Sigma-Aldrich company (Dorset, England). Rat-specific SOD, protein carbonyl, G6Pase, GP, and PEPCK ELISA kits were purchased from Sigma-Aldrich were used in this study. Tripure isolation reagent and expand reverse transcriptase were purchased from Roche Applied Sciences (Penzberg, Upper Bavaria, Germany). The primers were synthesized and delivered by Gen Fanavaran Ltd. Taq DNA polymerase (from Amplicon, Denmark) and SYBR green master mix was also used (on Light Cycler 96 from Roche Applied Sciences).
2.2 Animals and groups design
All tests were performed on the male Wistar rats (200–250 g), age 2–3 weeks, which were collected from animal house, of the Faculty of Pharmacy, Tehran University of Medical Sciences (TUMS). All animals were kept and fed under standard laboratory conditions, along with ad libitum watering and balanced diet in pellet form. Animals were kept for one week of adaptation period prior to the trial. According to the ethical guidelines for the care and use of animals, during study normal temperature of 25°C ± 1°C, 50% humidity, and 12 hours light/day were provided to all animals. All the procedures and protocols were followed under the ethical committee of the institute approved, with the code IR.TUMS.REC.1395.2493. Animals were distributed into six (06) groups, containing eight (08) animals in each group and were kept in polypropylene boxes. Groups were randomly allocated as below:
Group 1: Control: Received only 1 mL/day corn oil through gavage.
Group 2: Received styrene at 250 mg/kg/day in corn oil through gavage.
Group 3: Received styrene at 500 mg/kg/day in corn oil through gavage.
Group 4: Received styrene at 1000 mg/kg/day in corn oil through gavage.
Group 5: Received styrene at 1500 mg/kg/day in corn oil through gavage.
Group 6: Received styrene at 2000 mg/kg/day in corn oil through gavage.
Both corn oil as a carrier and experimental chemical agent styrene were administered via oral route at 1 mL with respective quantity of agent in each group for 42 days. Moreover, the fresh styrene solution was prepared twice during trial after 20 days interval for each group.
2.3 Selection of doses and route of administration
The selection of the doses, in the present trial was done on the basis of existing literature about kinetic of styrene and our own pilot studies. The highest dose used in this study was about 1/3 of the LD50, which is 2000 mg/kg, according to the safety data sheet of styrene version 1.6. The remaining doses were on the basis of maximum does and in logarithmic ratio of dose used. The oral route was chosen, since it is the most common way of exposure to styrene in human.
2.4 Blood sampling
After induction of a general anesthesia, all animals were sedated by intraperitoneal administration of sodium pentobarbital (50 mg/kg). During the procedure, all rats were put in supine position and checked for breathing.15 Then, blood was collected in heparinized microtubes, using cardiac puncture and plasma was separated through centrifugation and kept at −20°C.
2.5 Measurement of enzymes in plasma
2.5.1 Measuring SOD assay
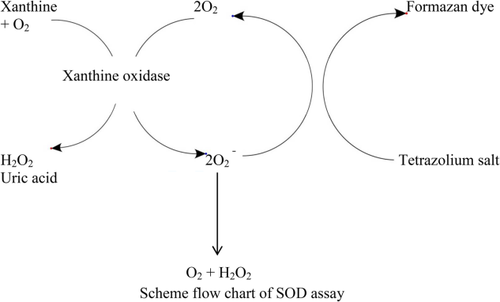
The plasma aspirated from whole blood was used for measurement. The erythrocytes were washed four times with NaCl (9%). Then, erythrocytes were diluted and ruptured via cold distilled water. The dilution was mixed with substrate and after that XOS was added. The first absorbance was read at 37°C after 30 second at 505 nm and the final absorbance was done after 3 minutes. The percentage inhibition was measured and from this percentage SOD was estimated using standard curve in U/mL.
2.5.2 Determination of protein carbonyl
The protein carbonyl was estimated using standard technique. 2,4-Dinitrophenylhydrazones (DNP) was formed from 2–4-dinitrophenylhydrazine (DNPH) with carbonyl protein.25 The endpoint product, DNP, gives a yellow color at 370 nm and was quantified spectrophotometrically via ELISA.26 In order to express the value of protein carbonyl content in nmol/mg, the UV determination of total protein at 280 nm is required.
2.6 Liver homogenate preparation
Animals are anesthetized; the abdomen was incised using hygienic scissor. The liver were cut from other attached organs gently and transferred to liquid nitrogen tank (–80°C) for further use. The liver homogenate was primed with proper method with slight modification as defined earlier.27 The liver tissue was cut with sterilized scissor and homogenized in 10 volume of 0.2 M cold phosphate buffer at 4°C for 2 minutes at pH 7.4 mixed with 2 mM mercaptoethanol and 2 Nm EDTA. The homogenate was centrifuged at 30 000g for 10 minutes at 0°C to remove extra cellular debris, tissue, and nuclei. The supernatant was used for enzymatic assays.
2.6.1 Measurement of liver oxidative stress parameters
2.6.1.1 LPO assay
Thiobarbituric acid reactive substances (TBARS) method is a well-established method to evaluate LPO. In brief, liver tissue was collected using centrifugation. The complex formation was evaluated spectrophotometrically, when the compounds react with lipid peroxides and form the complex of TBARS. Liver sample was mixed with buffer saline at 1:5, and took 400 µL of homogenized mixture, added with 800 µL of trichloroacetic acid, which was centrifuged for 30 minutes at 3000g. Later, 600 µL of supernatant after centrifugation was mixed together with 150 µL of TBA (1% wt/vol). Finally, the cocktail was allowed to incubate for 15 minutes in steaming water bath followed by the addition of 400 µL of n-butanol. After cooling down, the absorbance was recorded at 532 nm by an ELISA reader as set up in the lab.28
2.6.1.2 ROS assay
ROS in liver tissue was measured as before described by Rahimifard et al.28 In brief, liver tissue was taken, sonicated in 75 µL extraction buffer. Then 80 µL of assay buffer was mixed and kept for 30 minutes at 37°C. The DCFH-DA (fluorogenic reagent) cleaved by intracellular esterase to DCFH. This transforms the high fluorescent DCFH by cellular peroxides, which can measure ROS production. The absorbance was identified by ELISA fluorometer (Biotec, Tecan U.S.) at 488 and 525 nm with excitation and emission spectra individually for 1 hour.
2.6.1.3 Ferrous reducing antioxidant power assay
Ferrous reducing antioxidant power (FRAP) assay is an indication of the antioxidant power of the biological samples. The protocol was used previously described by Maqbool et al.29 Total antioxidant power (TAP) was determined by measuring the ability to reduce Fe3+ to Fe2+. The following procedure leads to the preparation of the FRAP reagent: mixing of acetate buffer 300 mM pH 3.6; TPTZ: 10 mM in 40 mM HCl; and FeCl3.6H2O: 20 mM, in the ratio of 10:1:1 just before testing. Standard was FeSO4.7H2O: 0.1–1.5 mM in methanol. After preparing FRAP solution, 50 µL from homogenized liver was added to 1.5 mL reagent and samples were kept at 37°C for 30 minutes. The reduction of ferric to ferrous ion leads to the formation of a colored ferrous-tripyridyltriazine [TPTZ (2,4,6-tris-(2-pyridyl)-s-triazin)] complex at low pH value. FRAP values were reported at 593 nm.
2.6.1.4 TTM Assay
For determining TTM in the control and test groups, 0.6 mL Tris-EDTA buffer (Tris base 0.25 M, EDTA 20 mM, and pH 8.2) was added to 50 µL of supernatant and after quick vortex mixing, 40 μL DNTB (10 mM in pure methanol) was added. The final volume of this mixture was made up to 4.0 mL by an extra addition of pure methanol. After 15 minutes incubation at room temperature, 10-minute centrifugation was done at 3000g and ultimately the absorbance of the supernatant was measured at 412 nm. Data were shown as mM.30
2.7 Determination of liver enzymes activities
2.7.1 Measuring of G6Pase activity
The G6Pase activity was measured in liver tissue supernatant of homogenate, in which inorganic phosphorous released from glucose-6-phophate. In brief, diluted samples were added to spectrophotometer wells having 78.4 mM cacodylate buffer, 39.2 mM glucose-6-phosphate tailed by the addition of ferrous sulfate molybdate reagent. One unit of enzyme releases 1 mmol of inorganic phosphate from glucose-6-phosphate per minute at 37°C and pH 6.5 and the absorbance was measured at 660 nm as set up previously.31
2.7.2 Measuring GP activity
The GP assay was measured in liver tissue supernatant of earlier adjusted to pH 7.4, centrifuged at 100 000g. The pH (7.4) was standardized via 50 mmol/L Tris-KOH, 0.1 mol/L KCL, and 20% glycerol.32 The final supernatant was used to calculate GP activity as previously described by Abdollahi et al.33 The total protein was measured in the supernatant samples using serum albumin as the standard.
2.8 Determination of PEPCK activity
This activity was determined using the supernatant as designated by Chang and Lane.34 The tissue supernatant samples contained 1.7 µM inosine diphosphate (IDP), 0.19 mM NADH, 100 mM Tris-HCL buffer, 3 mM MnCl2, 1.6 µM PEP and pH of 7.4. The PEPCK activity was read at 340 nm spectrophotometrically. The PEPCK activity was measured in reverse direction as carboxylation of PEP to yield oxaloacetic acid in the presence of NADH at 25°C. PEPCK activity is expressed in U/g liver protein and protein content in the supernatant was determined using serum albumin as standard as formerly defined.35 One unit is defined as the concentration of enzyme converting 1 mmol of substrate to product per minute under the analyze settings.
2.9 Determination of the ADP/ATP ratio
In order to evaluate the ADP/ATP ratio, the frozen liver tissue of 300 g was moved on ice and the sample tissue was quickly homogenized (4°C) in 1 mL of an ice cold trichloroacetic acid (TCA) (6%) and then centrifuged at 12 000g for 10 minutes at 4°C. The supernatant was removed and neutralized with KOH (0.5 M). Detection was performed by HPLC consisting of a column (SUPELCOSIL LC-18-T) with guard holder and a UV detector. The protocol used consisted of isocratic elution with tetrabutylammonium hydrogen sulfate (TBAHS) (4 mM) in potassium phosphate buffer (0.1 M; pH 5.5) and methanol (85:15 vol/vol). The flow rate was 1 mL/min for 20 minutes at 254 nm.36 The levels of ATP and ADP were quantified, after creating of standard curve, and the ratio was calculated.
2.10 Real time-reverse transcription polymerase chain reaction
For the determination of genes expression via quantitative reverse transcription polymerase chain reaction (RT-PCR), vital genes of specific enzymes of liver tissue were evaluated such as glutamate dehydrogenase (GDH), glucose transporter-2 (GLUT2), and glucokinase (GCK) along with glyeraldehyde-3-dehydrogenase (GAPDH) as housekeeping gene (Table 1) consisting respective symbols and forward/reverse primer pairs. In this regard, following 24 hours incubation, liver tissue were dissociated through trypsin and centrifuged for 5 minutes at 1200g. The micro-tubes were emptied gently via sampler and pellets were washed three times with sterile phosphate–buffered saline (PBS) to isolate RNA. With the help of trizol reagent, all liver tissue samples RNA were detached from cultured cells and the quantification of RNA was done spectrophotometrically. Through DNase-I and RNase-free kit, all genomic DNA was extracted. Beside, by the use of the iScript cDNA synthesis kit, cDNA was reverse copied. Computable RT-PCR was done in a LightCycler 96 System (Roche) using the SYBR green master mix. The relative gene expression or folded changes can be measured by an amplification curve with the help of relative cycle threshold way known as cycle number (Ct) of each reaction.37 2–ΔCt was the standard for comparative gene expression change. All Ct values measured from targeted genes were adjusted as compared to untreated control cells.
| Gene name | Gene symbol | Accession no. | Primer sequence (5′-3′) |
|---|---|---|---|
| Glutamate dehydrogenase 1 | GLUD1 | NM_008133.4 | F: TCAGTTGGAATCAGCCCCTT |
| R: GTGACTGACTGCTCCTGACT | |||
| Solute carrier family 2 (facilitated glucose transporter), member 2 | SLC2A2/GLUT2 | NM_031197.2 | F: GCCCAGCAGTTCTCAGGAAT |
| R: ACATGCCAATCATCCCGGTT | |||
| Glucokinase | GCK | NM_001287386.1 | F: CTGTGAAAGCGTGTCCACTC |
| R: GTGATTTCGCAGTTGGGTGT | |||
| Glyceraldehyde-3-phosphate dehydrogenase | GAPDH | NM_008084.3 | F: ACTGAGCAAGAGAGGCCCTA |
| R: TATGGGGGTCTGGGATGGAA |
- GLUD1: Glutamate dehydrogenase, SLC2A2/GLUT2: Solute carrier family-2/Glucose transporter-2, GCK: Glucokinase, GAPDH: Glyceraldehyde-3-phosphate dehydrogenase (House-keeping agent).
2.11 Statistical analysis
In this study, data were presented as mean ± SEM. Stats Direct version 3.0.194 was used with one way analysis of variance (ANOVA) followed by Tukey's multi-comparison test to calculate the statistical difference (P < .001) between groups.
3 RESULTS
3.1 General toxicity observed
Generally, all groups were gauged on a daily basis for any sign along with regular checkup of food and water per cage before replacing them. However, there were no observable signs of toxicity; just low weight gain was measured in higher dose groups. In the group 06, there was hepatomegaly observed in only one rat.
3.2 Measurement of SOD
Data presented in Figure 1 shows that blood plasma exposed to styrene at 250 mg/kg dose shows no change in SOD level in comparison to control. However, the toxicity of styrene at 1000, 1500, and 2000 mg/kg significantly rose to the level of SOD (P < .001).
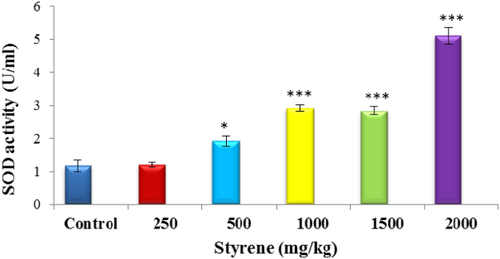
The effect of styrene on plasma SOD. Values are expressed as mean ± SEM for eight animals in each group. *Significant difference from control group at P < .05, ***Significant difference from control group at P < .001. [Color figure can be viewed at wileyonlinelibrary.com]
3.3 Evaluation of protein carbonyl
The effect of styrene on plasma protein carbonyl at 250, 500, 1000, 1500, and 2000 mg/kg is shown in Figure 2. Styrene exposure has significantly elevated the quantity of blood plasma protein carbonyl in 1000, 1500, and 2000 mg/kg groups (P < .001). However, styrene has negligible effect on protein carbonyl in 250 kg/kg group and concomitant exposure of blood plasma to styrene in 500 mg/kg groups demonstrated little effect on the amount of protein carbonyl (P < .01).
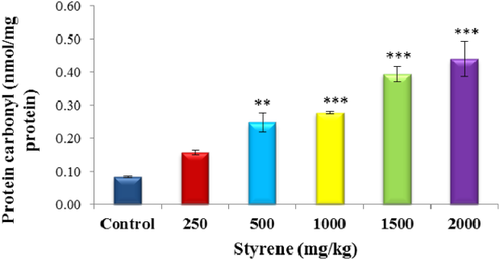
The effect of styrene on plasma protein carbonyl. Values are expressed as mean ± SEM for eight animals in each group. **Significant difference from control group at P < .01, ***Significant difference from control group at P < .001. [Color figure can be viewed at wileyonlinelibrary.com]
3.4 Measurement of liver oxidative stress
3.4.1 LPO assay
Data of styrene effect on different groups is shown in Figure 3A. It is indicated that exposure of liver cells to styrene at 1000, 1500, and 2000 mg/kg resulted in a significant increase in the level of LPO, as compared to control (P < .001). Moreover, there was a significant rise in the rate of LPO in 500 mg/kg hepatocytes exposed to styrene (P < .01), while no change in 250 mg/kg group was found compared with control.
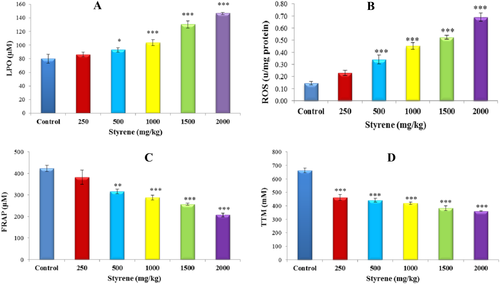
Oxidative stress biomarkers of liver tissue. A, Effects of styrene on LPO in liver of rats. One control and in rest, styrene was orally administered at different doses of 250, 500, 1000, 1500, and 2000 mg/kg for 42 days. Values are expressed as mean ± SEM for eight animals in each group. *Significantly different from control at P < .05, ***Significantly different from control at P < .001. B, Effects of styrene on ROS in liver of rats. One control and in rest, styrene was orally administered at doses 250, 500, 1000, 1500, and 2000 mg/kg for 42 days. Values are expressed as mean ± SEM for eight animals in each group. ***Significantly different from control at P < .001. C, Effects of styrene on FRAP in liver of rats. One control and in rest, styrene was orally administered at doses 250, 500, 1000, 1500, and 2000 mg/kg for 42 days. Values are expressed as mean ± SEM for eight animals in each group. **Significant difference from control group at P < .01, ***Significantly different from control at P < .001. D, Effects of styrene on TTM in liver of rats. One control and in rest, styrene was orally administered at doses 250, 500, 1000, 1500, and 2000 mg/kg for 42 days. Values are expressed as mean ± SEM for eight animals in each group. ***Significantly different from control at P < .001. [Color figure can be viewed at wileyonlinelibrary.com]
3.4.2 ROS level
In comparison to control, liver cells exposed to styrene showed high amounts of ROS; however, the level of ROS due to styrene is significantly increased in 500, 1000, 1500, and 2000 mg/kg groups (P < .001) as shown in Figure 3B.
3.4.3 Antioxidant power as FRAP
The effect of styrene on FRAP level is presented in Figure 3C. Styrene exposure has negligible or no response at 250 mg/kg group on the antioxidant potential in liver tissue. However, concurrent exposure of liver cells to styrene for 42 days demonstrated a decrease in antioxidant potential (P < .001) in a dose-dependent manner in 1000, 1500, and 2000 mg/kg groups as compared to control.
3.4.4 TTM level
The effect of styrene on total thiols in nM is presented in Figure 3D. Styrene exposure has significantly decreased the amount of TTM in liver tissue samples (P < .001) in all groups as compared to control.
3.5 Measuring G6Pase activity
Data presented in Figure 4 shows that liver exposed to styrene showed high amounts of G6Pase activity in a dose-dependent manner as compared to control (P < .001). However, a significant increase occurred in groups of 500, 1000, 1500, and 2000 mg/kg (P < .001). Liver exposed to styrene at 250 mg/kg for 42 days did not change G6Pase activity.
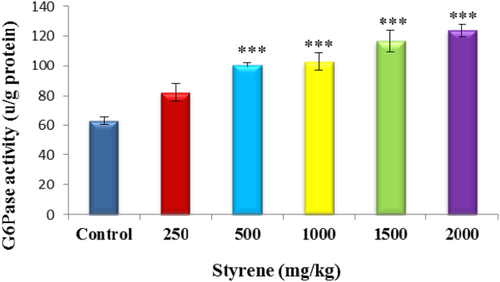
The effect of styrene on liver G6Pase activity. Values are expressed as mean ± SEM for eight animals in each group. ***Significant difference from control group at P < .001. [Color figure can be viewed at wileyonlinelibrary.com]
3.6 Evaluating GP activity
The effect of styrene on GP activity is presented in Figure 5. Styrene exposure has significantly decreased the quantity of GP activity in liver cells (P < .001) in all groups as compared to control.
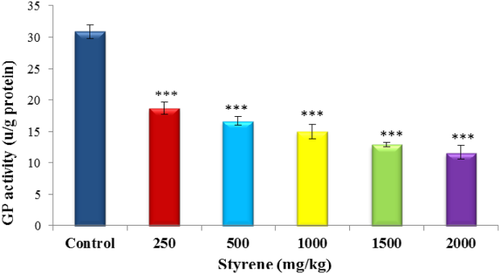
The effect of styrene on liver GP activity. Values are expressed as mean ± SEM for eight animals in each group. ***Significant difference from control group at P < .001. [Color figure can be viewed at wileyonlinelibrary.com]
3.7 Determination of PEPCK activity
As presented in Figure 6, exposure to styrene caused a significant rise in the activities of PEPCK in liver cells (P < .001) in 1000, 1500, and 2000 mg/kg groups as compared to control. On the other hand, there was noted, a significant difference in the level of PEPCK in liver tissue treated at doses of 250 and 500 mg/kg with styrene, when compared to control (P < .05).
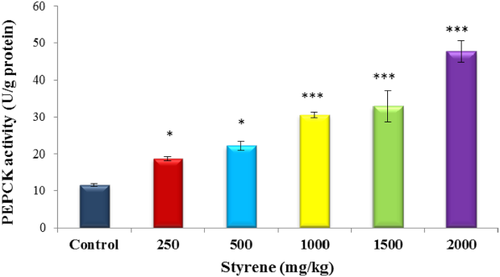
The effect of styrene on liver PEPCK activity. Values are expressed as mean ± SEM for eight animals in each group. *Significantly different from control at P < .05, ***Significant difference from control group at P < .001. [Color figure can be viewed at wileyonlinelibrary.com]
3.8 Determination of the ADP/ATP ratio
The effect of styrene on ATP and ADP ratio is presented in Figure 7. Liver tissue of 1000, 1500, and 2000 mg/kg treated with styrene showed a significant rise in the concentration of ATP and ADP ratio, as compared with control (P < .001). On the other hand, there was noted a significant difference in the level of ATP and ADP ratio in liver tissue treated at doses of 250 and 500 mg/kg with styrene, when compared to control (P < .01).
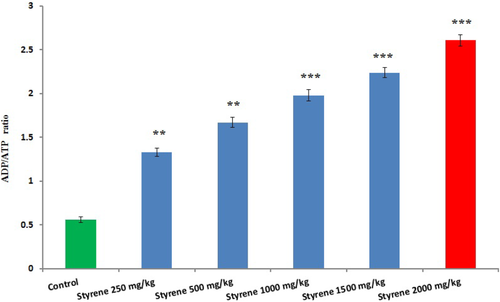
The effect of styrene on liver ATP and ADP ratio. Values are expressed as mean ± SEM for eight animals in each group. **Significantly different from control at P < .01, ***Significant difference from control group at P < .001. [Color figure can be viewed at wileyonlinelibrary.com]
3.9 The effect of styrene on the gene expression of GLUD1, GLUT2, and GCK in rat liver tissue
The examination of data presented that the changes in the gene expressions induced by styrene groups were significantly higher as compared to control. Table 2 expressed significant distinct change in the expression levels of glutamate dehydrogenase 1 (GLUD1), GLUT2, and GCK by styrene-treated groups as compared to control. Almost, all styrene co-treated groups displayed significant up-regulation of GLUD1 and GCK in gene expressions as compared to control (P < .01) (Figure 8A,C) expect 500 and 1500 mg/kg group for GLUD1 and 1000 mg/kg for GCK. There was no fold change seen at 1000 mg/kg for GLUD1 shown in Table 2. GLUT2 was down-regulated in 2000 mg/kg group with significant relative fold change (Figure 8B), while significantly up-regulated in the rest of doses for GLUD2.
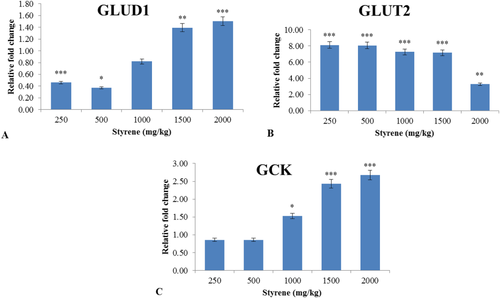
The effect of styrene on relative changes in gene expressions of GLUD1, GLUT2, and GCK in liver exposed tissue. A, Effects of styrene on GLUD1 in liver tissue of rats. One control and in rest, styrene was orally administered at different doses of 250, 500, 1000, 1500, and 2000 mg/kg for 42 days. Values are expressed as mean ± SEM for eight animals in each group. **Significantly different from control at P < .01. ***Significantly different from control at P < .001. B, Effects of styrene on GLUT2 in liver tissue of rats. One control and in rest, styrene was orally administered at doses 250, 500, 1000, 1500, and 2000 mg/kg for 42 days. Values are expressed as mean ± SEM for eight animals in each group. **Significantly different from control at P < .01. ***Significantly different from control at P < .001. C, Effects of styrene on GCK in liver tissue of rats. One control and in rest, styrene was orally administered at doses 250, 500, 1000, 1500, and 2000 mg/kg for 42 days. Values are expressed as mean ± SEM for eight animals in each group. *Significantly different from control at P < .05. ***Significantly different from control at P < .001. [Color figure can be viewed at wileyonlinelibrary.com]
| Experimental groups (Relative fold change ± SEM) | |||||
|---|---|---|---|---|---|
| Concentration of styrene (mg/kg) | |||||
| Gene symbol | 250 | 500 | 1000 | 1500 | 2000 |
| GLUD1 | 0.46 ± 0.023a | 0.37 ± 0.018b | 0.82 ± 0.041 | 1.39 ± 0.070c | 1.51 ± 0.075a |
| SLC2A2/GLUT2 | 8.11 ± 0.406a | 8.06 ± 0.403a | 7.26 ± 0.363a | 7.16 ± 0.358a | 3.27 ± 0.164c |
| GCK | 0.86 ± 0.043a | 0.86 ± 0.043a | 1.53 ± 0.076b | 2.43 ± 0.121a | 2.68 ± 0.134a |
- Values are expressed as mean ± SEM in each group.
- a Significantly different from control at P < .01 (Up-regulated).
- b Significantly different from control at P < .0 (Down regulated).
- c Significantly different from control at P < .001 (Down regulated).
4 DISCUSSION
In the present study, we investigated the toxicity in rat liver upon intermediate exposure to styrene including plasma SOD and protein carbonyl along with the hepatic oxidative stress and some key enzymes responsible for gluconeogenesis, such as G6Pase, GP, and PEPCK, were also analyzed. The gene expression of hepatic enzymes, such as GLUD1, GLUT2 and GCK, were also evaluated which have vital role in glucose homeostasis.
Styrene is associated with depletion of GSH level, an indicative factor of oxidative stress.38 GSH is a radical scavenger and prevents cells from oxidative stress. It conjugates with toxic or carcinogenic radicals inactivate them, thereby maintaining a balance between oxidative species and antioxidants to manage diabetes.39, 40 Also, organophosphorus (OP) compounds exposure leads to hyperglycemia, as its induces oxidative stress, physiological stress, alter liver tryptophan metabolism, initiation of adrenal gland, inhibition of cholinesterase, pancreatitis, nitrosative stress, and inhibition of paraoxonase which ultimately disturbs glucose hemostasis.41 OP compounds induced mitochondrial dysfunction via oxidative phosphorylation, which mutate the activities of complex I, II, III, IV, and V and disrupt mitochondria membrane.42 Therefore, its loss due to oxidative stress or conjugation with styrene suggests adverse ramifications on cells like induction of apoptosis. One more study supported this claim where styrene (600 mg/kg) and its metabolites (300 mg/kg) significantly reduced GSH levels in broncho-alveolar lavage (BAL) fluid and plasma.43 El-Ziney et al.44 used TBARS assay and showed very low doses of styrene (monostyrene) could increase LPO in female rats more than males. This may be due to the high conversion of this compound to its oxide forms in females rather than males.45
Our findings indicated that a dose-dependent escalation of ROS levels was observed in styrene-treated groups as compared to the control one. High levels of ROS which results from an imbalance in its production and removal have been implicated in the pathogenesis of many diseases.46 Lower doses of styrene (≤500 mg/kg) have been reported to enhance ROS production dose-dependently, which affected sperm counts and motility.47 Another study demonstrated increased ROS production following the exposure of styrene and SO in vivo (whole lung) and in vitro (Clara cells).10
Besides the increase of styrene concentration, a steady reduction in FRAP levels was gained in our experiment. The FRAP assay was first described by Benzie and Strain48 and is used to measure the antioxidant capacity of plasma constituents. This technique provides more relevant information compared to individual antioxidant measurement, which may describe dynamic equilibrium between pro-oxidants and antioxidants in plasma. Reduction in FRAP as seen in this study has also been reported by Sati et al.,49 where it was significantly low in workers exposed to styrene compared to the control.
Thiols constitute major part of total body antioxidants, which play major role in defense against free radicals, detoxification, signal transduction, and apoptosis. Decrease in the tissue and serum levels of thiols may imply chronic disorders related to kidney, cardiovascular, and neurological disorders.50 Styrene in the present study decreased liver tissue TTM with significant increase in intensity based on dosage. Depletion of GSH levels may cause oxidative damage to key mitochondrial proteins, as it maintains protein thiols in a reduced state and scavenges H2O2 in an enzyme catalyzed reaction.51 An increase in intermolecular thiol oxidation inhibits adenine nucleotide translocator leading to the loss of ADP/ATP exchange and subsequently intermolecular crosslinking in strong oxidative conditions. Altogether, our results suggest that styrene might contribute to the vulnerability of the cells to the oxidative stress and dysfunction due to alteration of enzyme levels. This was observed by the down-regulation of GSH levels which provokes oxidative stress.
Plasma SOD and protein carbonyl along with hepatic G6Pase, GP, and PEPCK are vital enzymes involved in the gluconeogenesis and sometime higher level of these enzymes alter physiological activities leading to elaborate certain toxins, which imbalance glucose hemostasis.33, 52, 53 The genes responsible for these enzymes are under control by multiple other hormones which induce insulin to enhance or diminish their level for physiological activities.54 In the present study, the higher level of the plasma SOD and protein carbonyl along with the hepatic G6Pase, GP, and PEPCK explored that these vital enzymes of gluconeogenesis are susceptible to styrene toxicity and become less accessible to insulin actions. Studies revealed that inflammatory cytokines are involved in lessening the insulin action on PEPCK along with up-regulation of PEPCK gene which is responsible for hepatic gluconeogenesis.52, 55 Beside this, higher doses of sildenafil reduced glycogenesis which ultimately lessened blood glucose level. It has high effect on GP and lower effect on PEPCK showing antioxidant properties and no mimicking potentially.56
To inhibit glycolysis, it is important that mitochondrial function in non-proliferating cells trigger a higher cytosolic ATP/ADP ratio. However, sometime environment toxicants lead to increase ATP/ADP ratio in a dose-dependent manner. In contrast, the bioenergetics of the Warburg observable characteristics of proliferating cells is described via boosted aerobic glycolysis and suppressed mitochondrial metabolism. This means that glycolysis was enhanced due to low cytosolic ATP/ADP ratio and inhibited mitochondrial function.57, 58 It is a key point that lower cytosolic ATP/ADP ratio determines predominantly oxidative stress and/or glycolytic changes. In the present study, styrene enhanced ATP/ADP ratio in a dose-dependent manner.
Furthermore, at genomic level styrene unlike its metabolite SO has not exhibited significant genotoxic effects. There are associated in vivo and in vitro studies, which demonstrated the involvement of styrene metabolites, especially SO in genotoxicity and carcinogenicity.10, 24 Recent studies have supported the role of oxidative stress in impaired insulin signaling. Insulin resistance of glucose transport and metabolism in glucose sensitive tissues like skeletal, liver, and adipose tissues is the primary defect leading to the development of type-2 diabetes.59 While the etiology of insulin resistance is multifaceted, mutations in more than one genes as well as environmental factors are believed to exacerbate glucose transportation and metabolism. One factor allied with insulin resistance of glucose transport and glycogenesis is hyperphosphorylation of insulin receptor substrate-1 (IRS-1) and hyperactivity of glycogen synthase kinase 3 (GSK-3) subsequently leading to reduced GLUT-4 translocation and glucose transport.60, 61 GSK-3 is an important factor involved in glycogenesis, gene transcription, protein synthesis, and cell-differentiation.62 Several studies involving obese animal models have confirmed the involvement of overactive GSK-3 in insulin resistance.63 In this study GLUT1 and GCK were up-regulated in styrene-treated groups, as compared to control. GLUT2 has been down-regulated with significant relative fold change in 2000 mg/kg group, while it was significantly up-regulated in the rest of doses. Furthermore, evaluation of the genes expression of IRS-1 and GSK-3 can be done to explore glycogenesis and glucose transport.
However, there is a need for future investigations in order to profoundly identify the effects of styrene and its metabolites on signaling pathways involved in insulin dysfunction/resistance and genotoxicity.
5 CONCLUSIONS
Our research outcomes give new directions, regarding the toxicity of styrene in plasma and liver tissues, along with gene expression of specific enzymes. Our results concluded that styrene is among one of the causative agents to alter glucose homeostasis, functional abnormalities, insulin resistance, induce oxidative stress in liver tissue, G6Pase, GP and PEPCK activities, and genes responsible for glucose metabolism are susceptible to styrene in rat modeling studies, which proved that styrene is genotoxic and causes mutation on a molecular level in biological systems. However, additional studies on in vivo and in vitro models are required with respect to diabetology, which change the physiology of adjunct organs as well.
Conflict of interest
The authors declare no conflict of interest with respect to the contents of this article.
Author Contributions
All authors have directly participated in the planning, conducting, analyzing, and drafting of the manuscript. MA conceived the study. All authors have read and approved the final version.


