Low-Intensity Focused Ultrasound-Responsive, Phase-Change Nanodroplets to Remodel Macrophage Polarization and Enhance PD-L1 Blockade Therapy
Abstract
Immune checkpoint blockade (ICB) therapy is a promising treatment that has shown significant effects in certain refractory and advanced cancers. However, not all patients respond to ICB therapy. The tumor microenvironment (TME) helps tumors evade immune surveillance and attack, contributing to the low response rate to ICB therapy. M1 macrophages primarily exert antitumor effects within the TME, whereas M2 macrophages support tumor growth and immune evasion through various mechanisms, making them a crucial component of the TME. To reduce M2 macrophages, mitigate TME, and ultimately enhance ICB therapy, perfluoropentane (PFP) is used as the phase-change material and hematoporphyrin monomethyl ether is incorporated into the nanodroplets (NDs). With mannose modification on their surface, these NDs can effectively target M2 macrophages, denoted as MPH@NDs. When exposed to low-intensity focused ultrasound, MPH@NDs cause mechanical injury and produce reactive oxygen species. This will lead to remodeling of the distribution of macrophages in the TME, transforming it into a proinflammatory microenvironment. This enhances cytotoxic T lymphocytes accumulation in tumors, remodels TME, and improves PD-L1 immunotherapy efficacy. MPH@NDs demonstrate promising potential in remodeling the TME, enhancing ICB therapy, and suppressing tumor growth and distant metastasis.
1 Introduction
Breast cancer has surpassed lung cancer as the most common type of cancer and is the second leading cause of cancer-related mortality among women.[1] Despite various treatment options, 20% of patients experience tumor recurrence or metastasis within the first 5 years.[2] Immune checkpoint blockade (ICB) is a promising and effective cancer treatment.[3] Unfortunately, less than half of the patients exhibit a favorable response to ICB therapy.[4, 5] One key barrier to ICB efficacy is the insufficient infiltration of cytotoxic T lymphocytes (CTLs) into tumor tissue.[6-9] The tumor microenvironment (TME) plays a critical role in this challenge, as it impedes CTLs accumulation and weakens the body's antitumor immune response.[10-13]
The TME is a complex and dynamic ecosystem composed of tumor cells and their surrounding environment, which suppresses the immune response and promotes tumor growth and metastasis.[14] Immune inflammatory cells, particularly tumor-associated macrophages (TAMs), are integral constituents of TME.[15] TAMs promote tumor progression through various mechanisms such as enhancing tumor growth, modulating immune responses, promoting angiogenesis, and facilitating metastasis.[16, 17] TAMs can be divided into two functional subtypes: the M1 type, which is activated via classical pathways and promotes tumor inflammation, and the M2 type, which is activated via alternative pathways and suppresses tumor inflammation.[18, 19] M1 TAMs can secrete proinflammatory cytokines, produce free radicals, and release cytotoxic molecules to induce tumor cell death. They also enhance the host's antitumor immune response by activating effector cells, including T cells and Natural Killer cells,[20] whereas M2 TAMs can secrete anti-inflammatory cytokines and inhibit the recruitment of CTLs, thereby suppressing adaptive immune responses and promoting tumor growth.[21] Although both subtypes coexist, M2 TAMs are predominant.[22] Moreover, TAMs exhibit high plasticity, capable of polarizing from an M2 to an M1 in response to varying microenvironmental conditions.[23-25] Increasing the ratio of M1/M2 TAMs within the TME may alleviate immunosuppression, enhance host immune responses, and promote infiltration of CTLs into tumor tissue.[19] Therefore, remodeling the polarization of TAMs may become a promising strategy for cancer immunotherapy.[26, 27]
Sonodynamic therapy (SDT) is a new cancer treatment method. It uses ultrasound to activate specific drugs (sonosensitizers) to produce reactive oxygen species (ROS), which can kill tumor cells.[28-30] These ROS can induce tumor cell death via apoptotic and necrotic pathways and trigger immunogenic cell death by releasing tumor cell debris.[31] This process has shown potential to enhance ICB therapy, even in previously resistant cancers.[32] Despite this, current SDT strategies predominantly target tumor cells rather than TAMs within the TME.[29] ROS generated by SDT can induce apoptosis/necrosis of M2 macrophages, increase M1 macrophages, and promote infiltration of CTLs into tumor tissue, providing a possible avenue for improving ICB therapy.[33-35] Hematoporphyrin monomethyl ether (HMME) is one of the most commonly used sonosensitizers, characterized by its low biological toxicity and strong ROS generation capability.[36, 37] Under low-intensity focused ultrasound (LIFU), HMME is activated and generates a large amount of ROS through energy transfer, inducing oxidative stress damage to tumor cells, leading to apoptosis or necrosis. However, there is still a lack of research on the use of HMME as a sonosensitizer targeting macrophages.
Acoustic droplet vaporization (ADV) occurs when ultrasound waves are used to transform nanometer- or micrometer-sized liquid droplets into gas bubbles. The resulting bubbles then generate ultrasound contrast imaging, synergize HIFU ablation, and enhance drug delivery, which makes ADV a promising approach for targeted therapies, such as tumor treatment.[38-40] Additionally, ADV's cavitation effect has been shown to reduce macrophages in atherosclerotic plaques, decreasing inflammation and slowing disease progression.[41] However, the potential for targeting TAMs in the TME using cavitation remains unexplored. The generation of ADV relies on the use of perfluorocarbons with different boiling temperatures, such as perfluoropentane (PFP) and perfluorohexane (PFH). Compared to PFP, PFH has a higher phase-transition temperature. The triggering temperature of the phase-change droplets of PFH encapsulated with poly(lactic-co-glycolic) acid has reached 55 °C.[42] PFP with a boiling point of 29 °C was employed as the core of droplets, which remains stable at a physiological temperature of 37 °C as the vaporization threshold was markedly elevated for small droplets.[43] Therefore, compared to PFH, the mild phase transition temperature of PFP makes it more suitable as a core material in vivo. However, therapeutic ultrasound at low intensity can efficiently activate ADV and convert droplets into gas bubbles and was widely used to vaporize PFP nanodroplets (NDs) in many studies by our team and other colleagues.[44, 45]
M2 TAMs are distinguished by their overexpression of mannose receptors,[46] making mannose a suitable ligand for targeting these cells. Although mannose receptors are also expressed on other cells, such as dendritic cells and certain endothelial cells, they remain the most used and reliable targets for M2 TAMs.[47-49] Additionally, localized therapy with LIFU can enhance treatment precision and reduces the potential risk of nonspecific injury. Thus, we hypothesize that using ADV to induce cavitation effects, combined with SDT targeting M2 TAMs in the TME, might offer a novel approach for remodeling the tumor microenvironment.
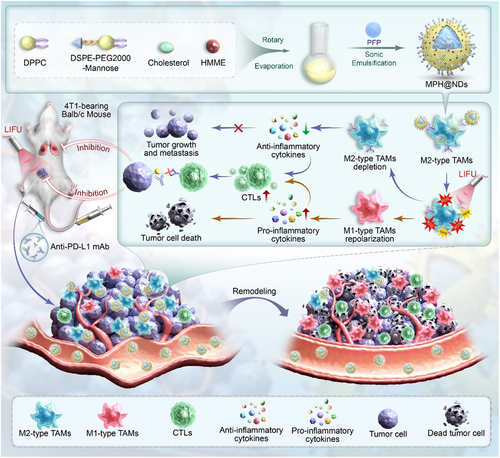
To reduce M2 macrophages, mitigate the TME, and ultimately enhance ICB therapy, we used PFP as the phase-change material and incorporated HMME into the NDs. Mannose on the surface allows these NDs to efficiently target intratumoral M2 TAMs, denoted as MPH@NDs. HMME, a commonly used sonosensitizer, imparts these NDs with the ability to perform SDT by generating ROS under LIFU irradiation and conducting photoacoustic (PA) imaging.[50] PFP, a phase-transition material, can deplete M2 TAMs through cavitation effects by ADV and facilitate ultrasound imaging. Improved PA and ultrasound (US) imaging of PFP-loaded NDs allows for monitoring of ND distribution, leading to more precise therapeutic timing and enhanced therapeutic outcomes. Under LIFU irradiation, the ROS produced by MPH@NDs, combined with the cavitation effects from ADV, can deplete M2 TAMs and induce their polarization to M1 TAMs, thereby remodeling TME. This process can normalize tumor vasculature, increase proinflammatory cytokines, decrease anti-inflammatory cytokines, promote CTLs infiltration into tumor tissue, enhance ICB therapy, and ultimately inhibit tumor progression, recurrence, and metastasis. We believe that targeting M2 macrophages through SDT and ADV to remodel the TME can effectively enhance ICB therapy and hold promising development potential (Scheme 1).
2 Results and Discussion
2.1 Characterization of MPH@NDs
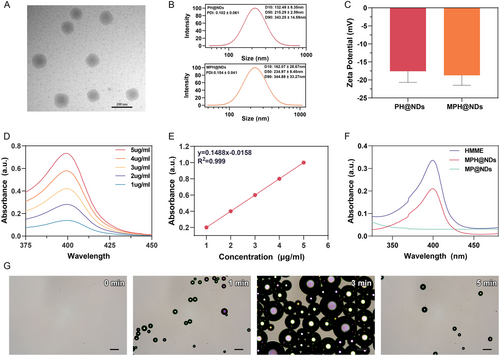
The synthesis pathway of DSPE-PEG2000-Mannose is shown in Figure S1, Supporting Information. Transmission electron microscopy (TEM) imaging revealed that MPH@NDs predominantly exhibit a spherical shape (Figure 1A). The average diameter of PH@NDs is ≈215.29 nm, while the average diameter of MPH@NDs is 234.97 nm (Figure 1B). The average polydispersity index (PDI) of PH@NDs and MPH@NDs is 0.102 ± 0.06 and 0.154 ± 0.04, respectively. The average zeta potentials of PH@NDs and MPH@NDs were −17.57 ± 3.11 and −18.73 ± 2.76 (Figure 1C). After the addition of mannose, the zeta potential of MPH@NDs remained unchanged, which may be due to mannose being a neutral monosaccharide. Additionally, the zeta potential of MPH@NDs is negative, which is consistent with the surface charge of phospholipid-based NDs reported in the literature[51-53]. The negative potential of MPH@NDs can promote mutual repulsion between them in vivo, preventing aggregation. MPH@NDs was observed as a maroon solution (Figure S2, Supporting Information). In addition, the size changes of the MPH@NDs stored at 4 °C for 7 days indicate that they are stable (Figure S3, Supporting Information). The MPH@NDs that were not treated with LIFU at 29 and 37 °C remained stable for 1, 5, and 10 min, while some MPH@NDs at 45 °C began to vaporize after 1 min (Figure S4, Supporting Information). To further assess the stability of the NDs at simulated body temperature, MPH@NDs were incubated in a serum-containing cell culture medium at 37 °C for 48 h. The particle size of MPH@NDs was measured, and phase transitions were observed under an optical microscope at 12, 24, and 48 h (Figure S5 and S6, Supporting Information). The results showed that the particle size of MPH@NDs remained stable for 24 h at 37 °C; no obvious phase-transition was found in NDs. While 48 h later, a few phase-transformed NDs were observed under optical microscopy. This further confirmed the stability of MPH@NDs under in vivo-like temperature conditions and suggested the potential for the in vivo therapeutic application of MPH@NDs. We plotted the standard calibration curve of HMME concentration against absorbance at λ = 399 nm (Figure 1D, E). The encapsulation efficiency (EE) of HMME was 86.33 ± 2.84%, and the loading capacity (LC) was 14.38 ± 0.46%. The UV–vis spectrum of MPH@NDs displayed absorption peaks identical to those of HMME, indicating a successful incorporation of HMME into MPH@NDs (Figure 1F). Using optical imaging, it was observed that MPH@NDs exhibited a noticeable increase in volume after LIFU irradiation, and most of the MPH@NDs underwent cavitation rupture after 3 min (Figure 1G). The LIFU-responsive property of MPH@NDs confirmed the successful loading of PFP. Given the current difficulty in counting nanoparticle droplets, we have referred to methods used in numerous studies and expressed the droplet concentration based on the shell mass of the nanoparticles relative to the volume of the dispersant.
2.2 Cytotoxicity and Biocompatibility of MPH@NDs
First, we assessed the in vitro biosafety of MPH@NDs. Coculturing MPH@NDs with 4T1 cells and RAW264.7 macrophages resulted in a cell death rate of less than 15% for both cell types (Figure S7, Supporting Information), indicating minimal cytotoxicity of MPH@NDs without LIFU activation. Subsequently, MPH@NDs were intravenously injected into healthy mice, and no statistically significant differences were observed in serum biomarkers at various time points (Figure S8, Supporting Information). Additionally, we did not observe any pathological damage to the major organs caused by MPH@NDs (Figure S9, Supporting Information). The experimental results indicate that MPH@NDs had low cytotoxicity and good biocompatibility.
2.3 Targeting Performance of MPH@NDs
To remodel TME by regulating M2 macrophages using MPH@NDs, efficient internalization is crucial. First, we successfully prepared M1 and M2 macrophages using the strategies outlined in Section 2.4 (Figure S10 and S11, Supporting Information). Subsequently, we assessed the internalization of MPH@NDs using flow cytometry and confocal laser scanning microscope (CLSM). Based on Figure 2A,B and Figure S12A, Supporting Information, M2 macrophages exhibited significantly higher internalization of MPH@NDs compared to 4T1 cells, RAW 264.7 macrophages, and M1 macrophages. To confirm that the targeting of MPH@NDs is due to the mannose receptor, we prepared PH@NDs and presaturated M2 macrophages with mannose (Figure 2C,D and Figure S12B, Supporting Information). The internalization rate of MPH@NDs was significantly higher compared to PH@NDs. Additionally, after mannose presaturation, the uptake efficiency of MPH@NDs was significantly reduced. So, MPH@NDs targets M2 macrophages through mannose-ligands.
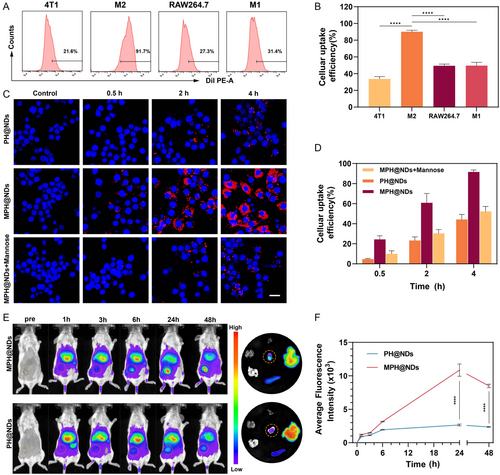
We also explored the tumor targeting ability of DiR-labeled MPH@NDs and PH@NDs. Live fluorescence imaging of the tumor-bearing mice was performed at 1, 3, 6, 24, and 48 h postinjection, with the results shown in Figure 2E,F. These results clearly indicated the great cancer targeting ability of MPH@NDs.
2.4 US/PA Bimodal Imaging of MPH@NDs
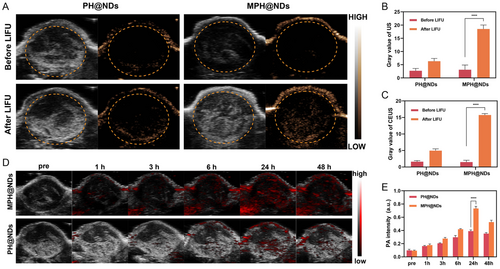
Next, we evaluated the ultrasound imaging capability of MPH@NDs. The results of the in vitro tests are presented in Figure S13, Supporting Information, showing a significant increase in ultrasound signal after LIFU irradiation compared to before. Further in vivo experiments demonstrated that MPH@NDs significantly enhanced the ultrasound signal at the tumor site compared to PH@NDs, as detailed in Figure 3A–C. Then, we assessed the PA imaging capability of MPH@NDs. Figure S14, Supporting Information, demonstrates that the PA signal intensity of MPH@NDs is linearly correlated with dose. Furthermore, dynamic PA imaging of breast cancer tumors in mice shows that MPH@NDs have stronger signal intensity compared to PH@NDs (Figure 3D,E). These results showed the promising potential of MPH@NDs for US/PA imaging.
2.5 The ROS Generation Capability of MPH@NDs In Vitro
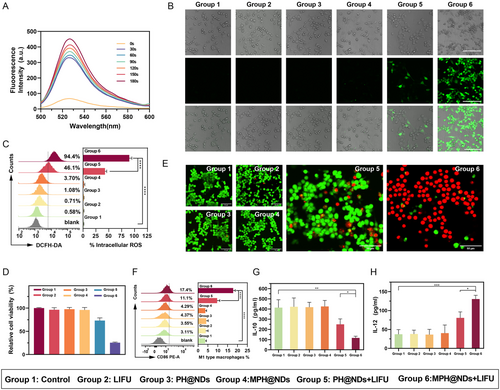
We used the SOSG probe and the ROS assay kit DCFH-DA to measure the ROS generation capability of MPH@NDs. SOSG probe and DCFH-DA are both vital tools for detecting ROS but differ in several aspects. SOSG specifically detects superoxide anions (O2•−), exhibiting high sensitivity and selectivity for this ROS. In contrast, DCFH-DA measures total ROS levels, including various species like H2O2, through conversion to a fluorescent compound after entering cells. While SOSG is ideal for studying superoxide's biological functions, DCFH-DA is widely used in cell biology and toxicology to assess oxidative stress. The fluorescence signal intensity, released from the reaction between SOSG and ROS, increased with longer LIFU irradiation time (Figure 4A and Figure S15, Supporting Information). The intracellular ROS production results are shown in Figure 4B. Quantitative analysis by flow cytometry was also consistent with the trend of the CLSM observation (Figure 4C). The addition of HMME significantly enhanced intracellular ROS production. Moreover, the MPH@NDs + LIFU group produced more intracellular ROS than the PH@NDs + LIFU group, possibly due to mannose-enhanced cellular internalization. The findings indicate that MPH@NDs + LIFU has the potential to generate significant levels of ROS. MPH@NDs as an effective sensitizer for the targeted depletion and repolarization of M2 macrophages through SDT are potential.
2.6 M2 Macrophage Depletion and Repolarization In vitro
After successfully demonstrating that MPH@NDs can produce ROS under LIFU, we investigated the depleting and repolarizing effects of MPH@NDs on M2 macrophages in vitro. M2 macrophages were cocultured with MPH@NDs or PH@NDs for 4 h. The cell viability of M2 macrophages of the control, LIFU, PH@NDs, and MPH@NDs groups was higher than 95% (Figure 4D). However, the survival rate of M2 macrophages in the MPH@NDs + LIFU group was only 25%. Although the PH@NDs + LIFU group also produced certain SDT and ADV effects, the lack of mannose-targeting resulted in reduced internalization of nanoparticles by M2 macrophages, thus the toxic effects on M2 macrophages cells were relatively minor. This indicated that the effective internalization of NDs by M2 macrophages is also crucial for inducing their depletion. As illustrated in Figure 4E, the PH@NDs + LIFU group exhibited a mild increase in dead cells (red fluorescence) compared to the control group. Most M2 macrophages in the MPH@NDs + LIFU group were eradicated (red fluorescence) by the combination of SDT and ADV effects. These results indicated that MPH@NDs can effectively deplete M2 macrophages.
Next, we verified the repolarization effect of MPH@NDs on macrophages. M2 macrophages were administrated with different treatments, and the M1 macrophages marker (CD86) was examined by flow cytometry analysis. The proportion of M1 macrophages was significantly increased in group 5 and group 6, with the highest increase observed in group 6 (Figure 4F). CD86 was expressed in 17.8 ± 1.08% of the MPH@NDs + LIFU group, higher than other groups. These results indicated that LIFU or NDs only could not promote repolarization. Compared to the PH@NDs + LIFU group, the MPH@NDs + LIFU group showed higher expression levels of CD86, indicating the stronger ability of MPH@NDs + LIFU of repolarization. The reason could be the inadequate uptake of nonmannosylated NDs by the M2 macrophages. To further investigate macrophage polarization, we analyzed the secretion of interleukin 10 (IL-10) and IL-12. Compared to the other groups, IL-10 in group 6 was significantly reduced, while the secretion of IL-12 slightly increased (Figure 4G,H). Additionally, our observations indicate that the PH@NDs + LIFU group induced a modest decrease in IL-10 expression while not significantly increasing IL-12 secretion, potentially due to the partial elimination of M2 macrophages. Consistent with the trend observed in flow cytometry analysis, there were no significant changes in IL-10 and IL-12 in the LIFU, PH@NDs, and MPH@NDs groups. Our results showed that under LIFU irradiation, MPH@NDs can more effectively promote M2 macrophage depletion and M2 to M1 macrophage repolarization.
2.7 M2 Macrophage Depletion, Repolarization, and TME Remodeling In vivo
Building on the good targeting and therapeutic effect of MPH@NDs in vitro, we directly used these NDs to explore the changes in the immune microenvironment in vivo. On the 7th day after different treatments of the breast cancer mouse model, tumors were harvested for M2 macrophages depletion, repolarization, and TME remodeling in vivo (Figure 5A). The number of M2 macrophages (F4/80+CD206+) in the MPH@NDs + LIFU group decreased by ≈17% compared to group 1 (Figure 5B and S16A, Supporting Information). Meanwhile, the number of M1 macrophages (F4/80+CD86+) increased by 10% (Figure 5C and Figure S16B, Supporting Information). The flow cytometry gating strategy was presented at Figure S17, Supporting Information. The flow cytometry results showed a significant decrease in M2 TAMs and a notable increase in M1 TAMs in group 3 and group 4 compared to group 1 and group 2. The group of mice treated solely with αPD-L1 exhibited a modest elevation in M1 TAMs and a slight reduction in M2 TAMs within the TME. Notably, compared to group 1, MPH@NDs + LIFU + αPD-L1 elicited the highest degree of M1 TAMs repolarization (22.7%) and reduction in M2 TAMs (32%) in the tumor tissue, respectively. Consistent with the in vitro results, LIFU irradiation alone did not significantly alter M1/M2 TAMs. The immunofluorescence staining results also displayed the same trend (Figure 5D,E).
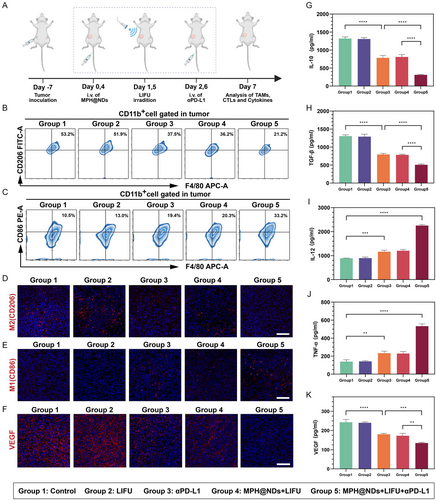
Tumor progression and metastasis are facilitated by M2 TAMs through various mechanisms, including the promotion of pathological angiogenesis. This vascularization enables tumors to increase their supply for oxygenation, nutrient delivery, and waste removal. Then, the expression of vascular endothelial growth factor (VEGF) was evaluated. After MPH@NDs + LIFU treatment, the expression of VEGF (red fluorescence) was significantly decreased (Figure 5F). The LIFU only group did not cause a decrease in VEGF. Significantly, the number of VEGF was found to be the lowest in MPH@NDs + LIFU + αPD-L1 group. This trend was further confirmed through the utilization of ELISA for the detection of VEGF levels in serum (Figure 5K). Compared to group 3, which used aPD-L1 alone, group 4 did not use PD-L1. The results from group 5 further indicate that MPH@NDs can enhance the effect of PD-L1, increasing the content of M1 macrophages in mice and reducing abnormal vascular formation. These results indicated that MPH@NDs combined with LIFU can induce tumor vasculature normalization. This effect may be a combination of SDT and ADV effects.
Consequently, following the observation that MPH@NDs could remodel the macrophage polarization at the tumor site when stimulated by LIFU, we proceeded to analyze the levels of serum cytokines using ELISA. Compared to other groups, the MPH@NDs combined with LIFU most effectively promoted the secretion of IL-12 and TNF-α while inhibiting the secretion of IL-10 and TGF-β (Figure 5G–J). These results confirmed that MPH@NDs + LIFU could induce the formation of M1 macrophages and deplete M2 macrophages.
However, one important reason for the suboptimal efficacy of ICB therapy is the limited infiltration of CTLs in tumor tissue. M2 TAMs have the capacity to suppress an adaptive immune response leading to CTLs dysfunction, ultimately facilitating tumor progression. The remodeling of macrophages in tumor tissue may promote the infiltration of CTLs, thereby enhancing the anti-PD-L1 therapy. Consequently, we further investigated the accumulation of CTLs in the spleens and tumors after different treatments.
CTLs, also CD8+ T cells, are primarily responsible for recognizing and killing cancer cells. Therefore, we analyzed the accumulation of CD8+ T cells in the tumors and spleens after various treatment groups. As shown in Figure 6A–D, the accumulation of CD8+ T cells was the lowest in group 1; the infiltration level of CD8+ T cells in group 2 did not show significant changes. Moreover, administration of αPD-L1 alone (group 3) only moderately increased the accumulation of CD8+ T cells, suggesting that the therapeutic effect of αPD-L1 was limited. Compared to groups 1, 2, and 3, MPH@NDs further increased the accumulation of CD8+ T cells under LIFU irradiation, suggesting its potent tumor-immunomodulatory effect. Notably, the accumulation of CD8+ T cells in group 5 was highest, demonstrating that MPH@NDs + LIFU can enhance the infiltration effect of αPD-L1-induced CTLs. These results suggested that alleviating the TME by MPH@NDs and LIFU significantly enhances ICB therapy. The results of immunofluorescence further validated that the accumulation of CD8+ T cells in group 5 was highest (Figure 6E).
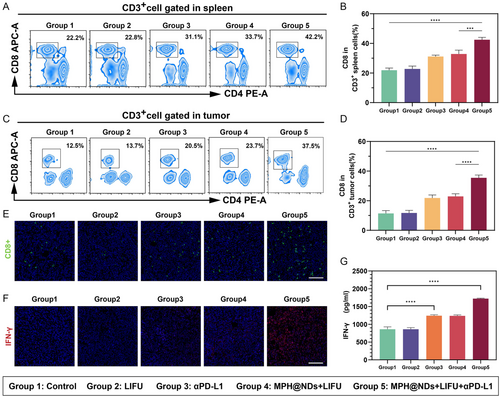
IFN-γ is produced by CD8+ T cells that regulates and enhances immune responses. Then, we evaluated the secretion of IFN-γ in different groups. Immunofluorescence staining for IFN-γ expression indicated that group 5 had a significantly higher level of IFN-γ expression compared to the other four groups. The serum IFN-γ levels further confirmed the results same as immunofluorescence staining.
The above experimental results indicated that under LIFU irradiation, MPH@NDs could effectively remodel macrophage polarization in tumor tissues, increase the M1/M2 tumor-associated macrophage ratio, enhance tumor immune responses, and increase the local accumulation of CTLs.
2.8 MPH@NDs and LIFU-Enhanced ICB Therapy In vivo
Tumor metastasis is a significant contributor to cancer-related mortality. After demonstrating the ability of MPH@NDs under LIFU irradiation to alleviate the TME and induce an immune response, we further assessed the efficacy of MPH@NDs + LIFU in enhancing αPD-L1 therapy. We observed the treatment effects for 15 days, although a longer observation period would help further assess the therapeutic efficacy. However, due to the rapid growth of the tumor, the tumor volume may exceed ethical limits after 15 days. Details are presented in Figure 7A.
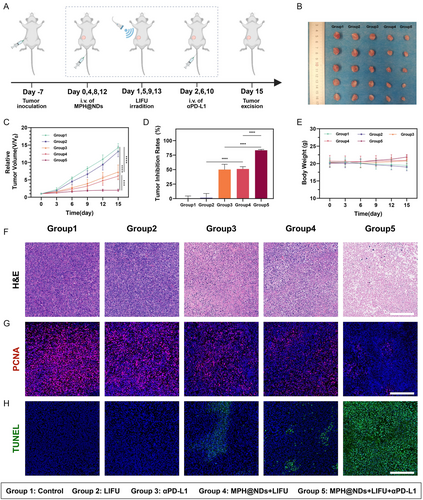
The therapeutic outcomes are summarized in Figure 7B,C, and Figure S18, Supporting Information. Compared to group 1 and group 2, tumors in groups 3, 4, and 5 exhibited varying degrees of inhibition. Group 5 (MPH@NDs + LIFU + αPD-L1) had the highest tumor inhibition rate. In detail, the mice in group 5 had a tumor inhibition rate of 83.31 ± 1.52%, which was significant compared with group 3 (αPD-L1, 50.07 ± 9.12%) and group 4 (MPH@NDs + LIFU, 51.05 ± 4.01%) (Figure 7D). The tumor growth curve of the mice showed that tumors in group 5 were effectively suppressed (Figure S18, Supporting Information). Furthermore, no significant differences were found in body weight changes among the different groups (Figure 7E). The H&E staining results indicated that tumors in group 5 displayed a larger area of tumor cell necrosis (Figure 7F). Proliferating cell nuclear antigen (PCNA) staining demonstrated that group 5 achieved superior inhibition of tumor proliferation (Figure 7G). The terminal deoxynucleotidyl transferase dUTP nick end labeling (TUNEL) assay indicated that the tumors in group 5 exhibited a higher level of apoptosis compared to the groups (Figure 7H).
To assess the metastatic status of tumors across different treatment groups, we evaluated the metastatic nodules in lung. Details are illustrated in Figure 8A. After 16 days of treatment, we collected lung tissues from mice at three endpoints, including natural death, when the tumor volume exceeded ethical limits, and survival until day 60. The results suggested that the number of lung metastatic nodules in group 5 was significantly lower (Figure 8B–E). The combination of MPH@NDs + LIFU with αPD-L1 significantly inhibits pulmonary metastasis. Compared to monotherapy, the survival rate in group 5 was significantly increased at 60 days (Figure 8F).
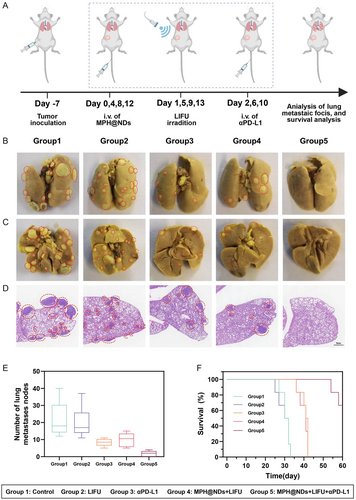
These results indicated that MPH@NDs + LIFU could effectively enhance αPD-L1 therapy, suppress primary tumors, reduce lung metastasis, and prolong the survival time of mice.
3 Conclusion
In summary, with mannose as the targeting agent, PFP as the core of the NDs, and HMME as the sonosensitizer, we successfully designed a ND capable of remodeling macrophage polarization in tumor tissue under LIFU irradiation. Under LIFU irradiation, the SDT produced by the phase change NDs and the ADV effect can lead to the direct depletion of M2 TAMs, as well as the promotion of M2 to M1 TAMs polarization through the generation of ROS. The targeted regulation of TAMs within tumor tissues is important in remodeling TME, promoting the CTLs accumulation, and enhancing the efficacy of ICB therapy. At the same time, MPH@NDs can provide excellent PA/US bimodal imaging capabilities. Our experimental results showed that under LIFU irradiation, MPH@NDs can enhance the anti-tumor effects of αPD-L1, effectively inhibiting tumor progression and metastasis in breast cancer mouse models. Therefore, in summary, MPH@NDs exhibit good biosafety and anti-tumor efficacy under LIFU irradiation and can effectively enhance ICB therapy, making them a promising cancer treatment option.
4 Experimental Section
Materials
HMME was bought from Dibai Biological Technology (Shanghai, China). Dipalmitoyl phosphatidylcholine (DPPC), cholesterol, and ethanolamine-polyethylene glycol (DSPE-PEG2000) were purchased from Avanti Polar Lipids Inc. (USA). Mannose was purchased from Ruixi Biological Technology (Xi'an, China). 2,7-Dichlorodihydrofluorescein-diacetate (DCFH-DA) was purchased from Beyotime Biotechnology (Shanghai, China). Cell counting kit-8 (CCK-8), propidium iodide (PI), and calcein-acetoxymethyl ester (CAM) were acquired from Dojindo (Japan). PFP was purchased from Elf Atochem. (France). Singlet oxygen sensor green (SOSG) was bought from Thermo Fisher Scientific (USA). Enzyme-linked immunosorbent assay (ELISA) kits were purchased from Meimian Industrial Co., Ltd. (Jiangsu, China).
Preparation and Characterization of MPH@NDs
To Prepare DSPE-PEG2000-Mannose, 500 mg of DSPE-PEG2000-NHS was dissolved in 3 mL of dimethyl sulfoxide. Mannose (1.1 equivalents) and triethylamine (2.0 equivalents) were then added, and the mixture was stirred until fully dissolved. The reaction of the mixture was carried out at 40 °C for 2 h. Subsequently, the product was dialyzed against pure water for 24 h using a molecular weight cutoff of 1000 Da. The dialysate was collected and freeze-dried to obtain DSPE-PEG2000-Mannose. To prepare MPH@NDs, DPPC (5 mg) and DSPE-PEG2000-Mannose (3 mg) were sequentially added to 10 mL of trichloromethane with continuous stirring until fully dissolved. HMME (2 mg) and cholesterol (2 mg) were then incorporated. The final mixture was subjected to rotary vacuum evaporation at a constant temperature of 50 °C for 1 h, resulting in the formation of a uniform lipid film. Subsequently, after rehydrating the monolayer film with 5 mL phosphate buffered saline (PBS), 200 μL of PFP was added to the rehydrated uniform film, and the mixture was subjected to pulsed sonication (100 W, 5 s on, 5 s off) for 6 min in an ice bath. Based on the total mass of 10 mg, consisting of DPPC (5 mg), DSPE-PEG2000-Mannose (3 mg), and cholesterol (2 mg), the concentration of NDs was calculated to be 2 mg L−1 in 5 mL of PBS. Finally, MPH@NDs were prepared following multiple centrifugation cycles (8000 rpm, 10 min) and subsequently kept at 4 °C. The preparation process for PH@NDs and MP@NDs followed the same procedure as described above. The morphology of MPH@NDs was studied by transmission electron microscopy (TEM, JEM 1200EX, Jeol, Japan). The zeta potential and average size of the NDs were analyzed by Malvern Zetasizer ZS90 (Malvern Instrument, UK), and the prepared NDs were redissolved in regular water for zeta potential measurement. We continuously monitored the size variation of the NDs over the course of one week at 4 °C. Next, 2 mg mL−1 of MPH@NDs were placed at 29, 37, and 45 °C in the cell culture medium containing serum for 1, 5, and 10 min, respectively. Their phase transitions were observed using optical microscopy to evaluate their stability at different temperatures. To further simulate the in vivo stability of MPH@NDs in vitro, MPH@NDs were incubated in serum-containing cell culture medium at 37 °C for 48 h. The phase transition of MPH@NDs was observed under an optical microscope at 12, 24, and 48 h, and their particle sizes were measured at these time points. By UV-vis (UV-3600, Shimadzu, Japan), a series of HMME solutions with known concentrations were measured at the characteristic wavelength of λ = 399 nm. A plot of concentration (x-axis) versus absorbance (y-axis) was created, and the linear regression equation was calculated to obtain the standard curve. The concentration of HMME in the sample was calculated based on the sample's absorbance at λ = 399 nm. The EE was calculated using the following formula: EE(%) = (Weight of HMME measured/Initial weight of HMME)*100%. The LC was calculated using the following formula: LC% = (Weight of HMME measured/Total Mass of MPH@NDs) × 100%.
Cytotoxicity and Biocompatibility of MPH@NDs
The CCK-8 assay was used to assess the cytotoxicity of NDs in vitro. 4T1 breast cancer cells and RAW 264.7 macrophages were sourced from the Institute of Ultrasound Imaging of Chongqing Medical University and approved by the Ethics Committee. 4T1 cells were cultured in RPMI1640, and Raw264.7 cells were cultured in dulbecco's modified eagle medium (DMEM). 4T1 cells were cultured in a specialized medium (90% RPMI 1640 + 10% FBS + PS), while RAW 264.7 cells were seeded in DMEM high-glucose medium (containing 10% fetal bovine serum and 1% penicillin–streptomycin mix). Both 4T1 and RAW 264.7 cells were incubated at 37 °C in a 5% CO2 incubator. RAW264.7 macrophages (1 × 10⁴ cells well−1) and 4T1 breast cancer cells (5 × 10³ cells well−1) were seeded into 96-well plates and cultured for 24 h. Following this, 50 μL of different concentrations of MPH@NDs (0, 0.2, 0.4, 0.6, 0.8, and 1 mg mL−1) was added to the fresh culture medium, and the cells were incubated for an additional 24 h. After incubation, the medium was discarded, and the cells were washed several times with PBS. Next, 10 μL of CCK-8 solution was added to each well, and the cells were incubated for an additional hour. Finally, the optical density (OD) values of each group were measured using a fully automated microplate reader, and cell viability was determined based on the OD values. In vivo biosafety assessments were conducted by tail vein injection of NDs (2 mg mL−1, 200 μL) into 6–8 week-old female Balb/c mice. Mice treated with the same volume of physiological saline served as the control group. Blood samples were collected on days 1, 7, 14, and 28 post-injection for serum biochemical analysis, including renal function, electrolytes, and liver function tests. The heart, liver, spleen, lung, and kidneys of mice were also collected for hematoxylin and eosin (H&E) staining.
Targeting Performance of MPH@NDs
To successfully obtain M1 and M2 macrophages, RAW 264.7 cells were induced with interferon-γ (IFN-γ, 25 ng mL−1) and lipopolysaccharide (LPS, 100 ng mL−1) to generate M1 macrophages. Similarly, M2 macrophages were obtained by treating the cells with interleukin-4 (IL-4, 25 ng mL−1).[54] To identify M1 and M2 macrophages, the levels of IL-10 and IL-12 in the culture supernatants were analyzed, and the percentages of CD86+ and CD206+ cells were measured using flow cytometry (BD FACS Vantage SE, USA).
RAW 264.7 macrophages were seeded into confocal dishes at a density of 2 × 10⁵ cells per dish and incubated for 24 h. 4T1 cells were seeded into confocal dishes at a density of 1 × 10⁵ cells per dish and incubated for 24 h. Following removing the original culture medium, all groups of cells (including M1, M2, RAW 264.7, and 4T1) were treated with a DiI-labeled ND solution of MPH@NDs (100 μL 0.2 mg mL−1) and incubated for an additional 4 h. After co-culturing for different durations, the cells in each group were washed multiple times with PBS and fixed with 4% paraformaldehyde for 15 min. Fluorescence intensity was observed using a CLSM (A1R; Nikon, Japan). To verify that the targeting of MPH@NDs is due to mannose, M2 macrophages were pretreated with saturating concentrations of mannose. Using CLSM to confirm the in vitro targeting performance of MPH@NDs. Additionally, flow cytometry was performed for quantitative analysis.
The orthotopic breast cancer mice were successfully established by injecting 4T1 cells into the fifth mammary fat pad on the right side. To evaluate the in vivo targeting efficacy of MPH@NDs, mice with established orthotopic breast cancer were separated into two groups (n = 3), with each group receiving an injection of either DiR-labeled MPH@NDs or PH@NDs (200 μL, 2 mg mL−1). Fluorescence imaging (IndiGo 2.0.5.0, Berthold Technologies, Germany) was conducted to examine the fluorescence intensity within the tumor region prior to injection, as well as at 1, 3, 6, 24, and 48 h postinjection. After 48 h, ex vivo fluorescence imaging was performed on the major organs (heart, liver, spleen, lung, and kidneys) along with tumors collected from the mice.
US/PA Bimodal Imaging of MPH@NDs In vivo
A 3% agarose gel mold was prepared to evaluate the US imaging capability of MPH@NDs in vitro. The NDs with the concentration of 2 mg mL−1 were exposed to the LIFU (3.0 W cm−2, 1.0 MHz, 50% duty cycle, MI = 1.5) for different times (1, 3, and 5 min). Based on the parameters labeled on the instrument, the MI of LIFU (RongHai, Chongqing, China) can be calculated using the following formula: .[55] The 50% duty cycle means the LIFU operates with 30 s on and 30 s off. These NDs are then placed in gel holes. B-mode and contrast-enhanced ultrasound images of 4T1 tumor-bearing mice were captured before and after intravenous injection of MPH@NDs or PH@NDs (200 μL, 2 mg mL−1) using a MyLab90 ultrasonograph (Esaote, Italy), equipped with the MX250 probe specifically designed for small animal ultrasound, providing a frequency range of 15–30 MHz. Twenty-four hours after injection, LIFU was applied to irradiate the tumor region, and images were collected again before and after irradiation for comparison. The ultrasonic intensity values were evaluated through time-intensity curves. We used Vevo LAZR PAI apparatus (Visual Sonics, Toronto, Canada) at 690 nm for PA imaging of MPH@NDs. Additionally, PA images of 4T1 tumor-bearing mice were collected before the injection of MPH@NDs or PH@NDs (200 μL, 2 mg mL−1), as well as at 1, 3, 6, 24, and 48 postinjection (n = 3).
SDT Assessment of MPH@NDs In vitro
We used the fluorescence generation of SOSG upon reaction with ROS to assess the sonodynamic effects of MPH@NDs. SOSG was added to MPH@NDs, which were then subjected to LIFU irradiation for durations of 0, 30, 60, 90, 120, 150, and 180 s (3.0 W cm−2, 1.0 MHz, 50% duty cycle, MI = 1.5). Fluorescence was subsequently measured using a multimode reader (SpectraMax M3, Molecular Devices, USA). For further quantitative analysis of ROS generation, we employed 2′,7′-dichlorodihydrofluorescein diacetate (DCFH-DA). Specifically, M2 macrophages were randomly divided into six groups in CLSM dishes: group 1 (control), group 2 (LIFU), group 3 (PH@NDs), group 4 (MPH@NDs), group 5 (PH@NDs + LIFU), and group 6 (MPH@NDs + LIFU). RAW 264.7 macrophages were seeded into confocal dishes at a density of 2 × 10⁵ cells per dish and incubated for 24 h. RAW 264.7 macrophages were then induced to M2-type macrophages. Different NDs were coincubated with the induced M2-type macrophages for 4 h. Following this, 1 mL of diluted DCFH-DA solution was added, and the cells were incubated for an additional 30 min. After 30 min of DCFH-DA treatment, LIFU irradiation (3 W cm−2, 3 min, 50% duty cycle, MI = 1.5) was applied to groups 2, 5, and 6. Then, ROS production was observed using CLSM, and quantitative measurements of ROS were performed via flow cytometry.
Depletion and Repolarization of M2 Macrophages by MPH@NDs In vitro
First, we validated the capability of MPH@NDs to deplete M2 macrophages in vitro. RAW 264.7 macrophages were seeded at a density of 1 × 10⁴ cells per well in a 96-well plate and incubated for 24 h. The macrophages were then induced to differentiate into M2-type macrophages. NDs at a concentration of 1.0 mg mL−1 (50 μL) were cocultured with M2 macrophages for 4 h. Cells in groups 2 (LIFU), 5 (PH@NDs + LIFU), and 6 (MPH@NDs + LIFU) were then subjected to LIFU irradiation (3.0 W cm−2, 1.0 MHz, 50% duty cycle, MI = 1.5, 3 min). The depletion of M2 macrophages was assessed by CCK-8. The same treatment was used for CLSM observation of cell viability. After staining with CAM (5 μL, 2 mM) and PI dyes (15 μL, 1.5 mm), cell survival and death were observed using CLSM, with green fluorescence indicating live cells and red fluorescence indicating dead cells.
To verify the polarization of M2 to M1 TAMs, RAW264.7 macrophages were induced to M2 using IL-4. The obtained M2 macrophages were divided into four groups: control, LIFU, PH@NDs + LIFU, and MPH@NDs + LIFU, and then subjected to LIFU irradiation (3.0 W cm−2, 1.0 MHz, 50% duty cycle, MI = 1.5, 3 min). After 48 h of incubation, the centrifuged cells were labeled with anti-CD86 phycoerythrin and analyzed by flow cytometry to confirm the polarization from M2 to M1 macrophages. The supernatant was collected to measure IL-10 and IL-12 levels for further validation of successful M1 macrophage polarization.
M2 Macrophage Depletion, Repolarization, and TME Remodeling In vivo
To study immune microenvironment remodeling in vivo, tumor-bearing mice were randomly divided into five groups (n = 5): group 1 (control), group 2 (LIFU), group 3 (αPD-L1), group 4 (MPH@NDs + LIFU), and group 5 (MPH@NDs + LIFU + αPD-L1). On days 0 and 4, the mice were intravenously administered with 200μL MPH@NDs (2 mg mL−1) or saline. LIFU (3 W cm−2, 1.0 MHz, 50% duty cycle, 5 min, MI = 1.5) irradiation was conducted on the tumor 24 h after intravenous injection. αPD-L1 (1.5 mg kg−1) was administered intravenously (i.v.). on days 2 and 6. On day 7, immunofluorescence staining and flow cytometry analysis were performed on tumors from 4T1 breast cancer mice. Then, tumor cells were stained with FITC-anti-CD206, PE-anti-CD86, PerCP/Cyanine 5.5-anti-CD11b, and APC-anti-F4/80 (Biolegend) to analyze the depletion of M2 macrophages. The tumor slices were stained with DAPI and anti-CD206, anti-CD86, or anti-VEGF antibodies for immunofluorescence staining. For cytokine assay, the levels of IL-10, TGF-β, VEGF, IL-12, and TNF-α in mice serum were detected by ELISA. In addition, to quantitatively analyze the infiltration of CTLs in tumors and spleen, cells were stained with FITC-anti-CD3, PE-anti-CD4, APC-anti-CD8 (Biolegend) and detected using flow cytometry. For immunofluorescence staining, tumor slices were stained with DAPI and anti-CD8 or anti-IFN-γ antibody.
Survival and Lung Metastasis in MPH@NDs and LIFU-Enhanced ICB Therapy In vivo
4T1-tumor models were established to investigate LIFU + MPH@NDs synergistic αPD-L1 immunotherapy in vivo. When the tumor volume reached 50–60 mm3, the mice were divided into five groups (n = 5): group 1 (control), group 2 (LIFU), group 3 (αPD-L1), group 4 (MPH@NDs + LIFU), and group 5 (MPH@NDs + LIFU + αPD-L1). On days 0, 4, 8, and 12, 200 μL of MPH@NDs (2 mg mL−1) or saline was administered to tumor-bearing mice via tail vein injection. LIFU (3 W cm−2, 1.0 MHz, 50% duty cycle, 5 min, MI = 1.5) irradiation was conducted on the tumor 24 h later. The αPD-L1 (1.5 mg kg−1) was injected on days 2, 6, and 10. On day 16, the mice (n = 5) were sacrificed, and the tumor tissues were stored in 4% formaldehyde. H&E, TUNEL, and PCNA staining were performed to observe proliferation and apoptosis. Animal weight and tumor volume were measured every other 2 days for 16 days. After 16 days of treatment, we collected lung tissues from mice at three endpoints, including natural death, when the tumor volume exceeded ethical limits, and survival until day 60. The time points for obtaining lung tissue were based on three criteria: first, mouse death; second, when the tumor volume exceeded ethical limits; and third, survival to day 60.
Statistical Analysis
The P-value thresholds for significance are as follows: ∗P < 0.05, ∗∗P < 0.01, ∗∗∗P < 0.001,∗∗∗∗P < 0.0001. Statistical analyses were conducted using the Statistical Package for the Social Sciences (IBM, Armonk, NY, USA). Data were presented as the means ± standard deviations. Statistical differences between the two groups were assessed using an unpaired t-test, while differences among multiple groups were analyzed using one-way ANOVA.
Acknowledgements
This study was supported by the Natural Science Foundation of Chongqing, China (grant no. CSTB2024NSCQ-MSX0674) and the National Natural Science Foundation of China (grant no. 82272025). The authors thank BioRender.com for providing graphic support for this study. Qin Zhang, Ci Yin and Junjie Liu contributed to this work equally.
Conflict of Interest
The authors declare no conflict of interest.
Author Contributions
Qin Zhang: data curation (lead); formal analysis (lead); funding acquisition (lead); investigation (lead); methodology (lead); writing—original draft (lead); Ci Yin: investigation (equal); methodology (equal); supervision (equal); writing—original draft (equal); Junjie Liu: investigation (equal); methodology: (equal); supervision (equal); writing—original draft (equal); Hua Yang: data curation (equal); formal analysis (equal); methodology (equal); Yanping Zhang: methodology (supporting); supervision (supporting); validation (supporting); Qiaoxi Qin: methodology (supporting); supervision (supporting); validation (supporting); Nianhong Wu: methodology (equal); supervision (equal); validation (equal); Rui Tang: methodology (supporting); supervision (supporting); validation (supporting); Yuting Cao: supervision (supporting); validation (supporting); Min Zheng: methodology (supporting); validation (supporting); Hongye He: methodology (supporting); supervision (supporting); validation (supporting); Hongmei Dong: data curation (supporting); investigation (supporting); Yang Zhou: methodology (supporting); supervision (supporting); validation (supporting); Jianli Ren: methodology (supporting); supervision (supporting); validation (supporting); Zhengju Ren: methodology (equal); supervision (equal); validation (equal); writing—review editing (equal); Pan Li: conceptualization (lead); funding acquisition (lead); project administration (lead); supervision (lead); writing—review editing (lead). Qin Zhang, Ci Yin, and Junjie Liu contributed equally to this work and co-first authors.
Open Research
Data Availability Statement
The data that support the findings of this study are available on request from the corresponding author. The data are not publicly available due to privacy or ethical restrictions.


