Modeling Freeze-Lining Formation: A Case Study in the Slag Fuming Process
Abstract
Slag fuming (SF) is a metallurgical process designed to recycle Zn-containing slags derived from various industrial residues. To protect the reactor from corrosive molten slag, a deliberate as-solidified slag layer, known as a freeze lining (FL), is formed on the reactor walls using intense water-cooled jackets. In this article, a computational-fluid-dynamics-based model capable of simulating FL formation in a SF furnace is presented. To capture the complex multiphase flow dynamics, heat transfer, and FL formation during SF, a volume-of-fluid model is coupled with a mixture continuum solidification model. Three phases are considered: gas, liquid bulk slag, and solid slag (FL). Moreover, two types of FL are distinguished: one that solidifies on the reactor wall in the bulk slag region and another that solidifies on the reactor wall in the freeboard region owing to slag splashing. Comparisons between calculated FL thickness and heat fluxes and corresponding industrial data demonstrate satisfactory agreement. In this outcome, the robustness of the model is underscored and confidence in its accuracy is instilled. In the simulation results, valuable insights are provided into the evolution of the fuming process, particularly regarding the slag bath temperature, slag splashing dynamics, FL formation, local heat fluxes through the reactor wall, and global net energy balance.
1 Introduction
The formation of a freeze-lining (FL) layer on the reactor walls, achieved through slag solidification, is an important consideration in the design of pyrometallurgical vessels. FL acts as a buffer to protect refractories from direct degradation caused by corrosive molten slags and minimizes energy consumption. The FL concept has been applied to various industrial processes, including flash furnaces,[1] electro arc furnaces,[2] and steel converters.[3] FL has also been employed as a substitute for the entire refractory lining in plasma-driven Zn fuming furnaces[4] and box fumers.[5]
To better understand the formation of FLs, numerous laboratory-scale experiments have been conducted over the years. Campfort et al. performed a cold finger experiment (with a submerged air-cooled probe) to investigate microstructure formation[6] and thermal history[7] in synthetic lead slag. They observed that the microstructure of the as-formed FL strongly depended on the solidification kinetics (cooling rate). Moreover, the temperature at the FL front varied between the temperature of glass formation and the liquidus of the slag. Fallah-Mehrjardi et al.[8] conducted a similar experiment using different copper-containing slags to study the impact of slag chemistry and process conditions on FL formation. They confirmed that the temperature at the FL front remained below the liquidus of the slag even after reaching a steady state. The FL thickness was not simply governed by the thermodynamic equilibrium condition but rather depended on the complex interplay of mechanisms involving crystallization, transport, and remelting, which occurred within a liquid boundary layer ahead of the FL.[9] As a result, flow has emerged as a critical factor influencing FL.[10] In a rheology experiment, Nagraj et al.[11] determined the FL thickness, critical temperature, and solid fraction at which the slag transitioned from a liquid-like state to a solid FL. Again, the temperature at the FL front remained below the liquidus temperature, and the solid fraction at the FL front was influenced by the flow.
Modeling has also been a valuable tool for studying the mechanisms governing FL formation. Wei et al.[12] introduced a 1D heat-transfer model to study FL formation (referred to as the “ledge”) in Hall–Héroult cells. A moving mesh technique was introduced to capture the moving FL front, and an effective heat-transfer coefficient (HTC) was applied at the FL–bath interface to replicate the convective heat transfer in the bath. However, this 1D model was too simple and had limited applicability. Campbell et al.[13] combined computational fluid dynamics (CFD) with thermomechanics to model the refractory wear and FL formation in water-cooled elements. To capture the solidification process, a source term was considered in the energy conservation equation to treat the latent heat, and Darcy's law was considered in the momentum conservation equation to dampen the flow in the FL. Guevara[14] employed a similar solidification model (with the enthalpy–porosity technique) to simulate a six-inline electric smelting furnace (ESF). Reasonable temperature fields and FL profiles were also obtained. To validate the numerical model, a benchmark experiment involving an aqueous solution of calcium chloride (CaCl2–H2O) was conducted.[15] The experimental data provided valuable information (including temperature, velocity, and FL profiles) for refining the numerical model.[16] Recently, the current authors proposed a novel model framework for simulating FL formation in an ESF.[17] This approach was based on the expertise of the authors in alloy solidification and multiphase modeling.[18] The model framework not only incorporated the key modeling features from Guevara et al.[14] but also considered the global energy balance between energy sources (electrode, matte production, FL formation), energy sinks (feed and FL melting), and heat transfer between the slag and furnace refractory, matte, and freeboard. The FL dynamics was fully coupled to the multiphase flow, mass transfer, and energy transport within the system.
This study expands the aforementioned modeling framework to simulate the formation of FL in a slag fuming (SF) furnace. SF is a technology used to recycle Zn-containing slags[19] by converting the Zn oxides present in the molten slag into Zn vapor. Maintaining high slag temperatures is essential for achieving optimal fuming rates and ensuring the continuous reduction of Zn oxide concentrations. However, this comes at the expense of increased energy losses and shortened furnace lifespans. The concept of FL formation in water-cooled SF furnaces has emerged as a strategy for mitigating this issue.[20] The conventional SF process relies on fossil fuel burners, both as an energy source for heating slag and as a reducing agent. However, a new SF process was developed (and first operated at Aurubis–Beerse), which utilizes electrically powered submerged plasma torches (SPTs). The main advantages of this novel technology include a reduced carbon footprint and enhanced process control.[21] However, this causes reduced fuming efficiency.[22]
As shown in Figure 1, the plasma-driven SF furnace, constructed from a steel shell, consists of a lower conical section and an upper cylindrical section. Initially, the slag bath is contained within the conical section. The three SPTs transform the compressed air into plasma. The resulting plasma is mixed with natural gas and pulverized coal in tuyeres and then injected into the slag bath. This gaseous mixture acts as a heat source, stirring force, and reducing agent during fuming. The Zn fumes exit the furnace via the outlet and are collected in a baghouse. The furnace is enclosed in water-cooled jackets to promote FL formation. No refractory lining is used in the actual process. There are two types of FLs: FL that solidifies on the reactor wall in the slag bath region (inset A in Figure 1) and FL that solidifies on the reactor wall in the freeboard region owing to slag splashing (inset B in Figure 1).
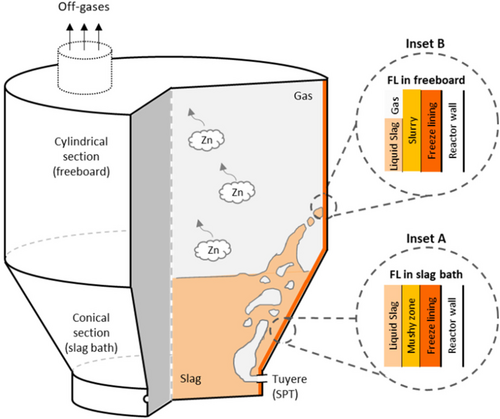
Most previous modeling studies on the SF process were based on static heat transfer[23, 24] and thermodynamic calculations,[25, 26] and the flow effect was not considered. Huda et al.[27, 28] used a CFD model to study the multiphase flow in the SF process; however, FL was ignored. A comprehensive model of the SF process with FL formation is still absent in the literature, particularly when two types of FLs (as shown in the insets of Figure 1) are considered. The type of FL formation that occurs in the slag bath can be captured using the modeling approach described in our previous work.[17] However, the type of FL that occurs in the freeboard region requires a more complex modeling approach to treat slag splashing and solidification. Existing literature on slag splashing is scarce and has limited applicability. Yang et al.[29] used a volume-of-fluid (VOF) model to simulate slag splashing in a steelmaking converter. To capture FL formation, a simple approach was considered, in which slag drops were immobilized once they entered an annular layer near the converter liner. Feng et al.[30] combined the VOF model with an enthalpy–porosity solidification model to simulate slag solidification in a blast furnace during centrifugal granulation. The authors investigated the behavior of a single slag-drop collision (including spreading, retraction, and stabilization) as well as the dynamics of heat transfer and FL formation.
This study is an extension of our previous work that introduced a modeling framework for FL formation in an ESF furnace.[17] Here, the batch-type plasma-driven SF furnace process operated at Aurubis–Beerse was simulated, and the VOF formulation was incorporated into the modeling framework. The primary objective is to model the SF furnace. This involves designing a suitable model setup, achieving a global net energy balance (GNEB) in the SF process, and predicting FL thickness in both the slag bath and freeboard. Industrial plant data were used to assess the simulation results.
2 Model Description
To describe the flow dynamics in the SF furnace, two immiscible hydrodynamic phases were considered: slag and gas. Their flow was solved with a VOF model, and their distribution was described by their respective volume fractions, denoted as αslag and αgas (where αslag + αgas = 1.0). Solidification occurs only in the slag phase, which exists in two states: solid and liquid. Note that in the classical research field of solidification, the terms “state” and “phase” are used interchangeably. The solidification evolution was solved with a mixture continuum (MC) model, and the solid or liquid distribution was described by their respective volume fractions, denoted as fs and fℓ (where fℓ + fs = 1.0). The models were developed using ANSYS Fluent (version 17.2). The special features of the MC model that accounted for FL formation were extended using user-defined functions in the program interface.
2.1 MC Model for FL Formation
Following the modeling framework for FL formation described by Rodrigues et al.[17] a computationally efficient MC model was used to account for slag solidification. It was originally proposed for metal alloy solidification by Voller and Prakash[31] and was applied here to slag solidification. Only the key features of the model are outlined here, as the details of the approach were presented in an earlier publication.[17]
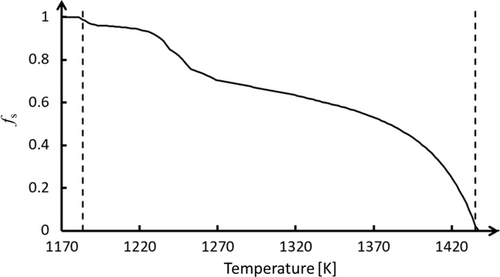
Industrial slag[11] with the composition listed in Table 1 was considered. Figure 2 shows the solidification path (fs–T curve) obtained from FactSage 8.2 using the FToxid database, assuming thermodynamic equilibrium solidification conditions. To improve accuracy, additional experimental data are necessary to establish a more reliable fs–T curve, particularly for nonequilibrium solidification conditions.
| Slag components | FeO | SiO2 | Al2O3 | CaO | ZnO | PbO | Cu2O | Cr2O3 |
|---|---|---|---|---|---|---|---|---|
| wt% | 57.70 | 30.79 | 2.63 | 0.63 | 5.38 | 1.03 | 0.85 | 0.98 |
2.2 Multiphase VOF Model
Depending on the local αslag, the material properties were either purely representative of one phase (when αslag = 0 or 1) or representative of a mixture of phases (when 0 < αslag < 1). The conservation equations are listed in Table 2.
| Conservation equations | |
|---|---|
| (7) | |
| (8) | |
| (9) |
Sensible enthalpy was defined by , where href = 0 J kg−1 and Tref = 298.15 K. The source terms and SH are described in Section 2.1. The term SS in Equation (9) is the energy sink associated with the fuming rate. During fuming, endothermic chemical reactions occur in the slag. Although the model does not explicitly solve these reactions, the sink term accounts for their effect on the system's enthalpy. Consequently, the sink term is only applied to a predefined region of the slag bath where the fuming reaction occurs. For commercial reasons, the details of this fuming reaction are not presented here. Note that a laminar model was employed due to the absence of an accurate turbulence model for multiphase solidification processes.
To fully couple the MC solidification model with the VOF model, the source terms used in the conservation equations require the pre-factor αslag. This ensured that the source term acted in the correct proportion for each corresponding phase. For instance, even if the local temperature fulfills the solidification condition, SH will still be zero if no slag phase (αslag = 0) is present.
2.3 Modeling the Two Types of FL Formations
From a modeling standpoint, two types of FL can be identified in an SF furnace, as shown in Figure 1. 1) FL formation in the slag bath region (inset A of Figure 1): the slag solidifies from a liquid state in the molten slag (fs = 0.0) to a solid state in the FL (fs = 1.0). This transition occurs along a spatial gradient of the solid slag known as the mushy zone (0.0 < fs < 1.0). As the slag bath region is primarily occupied by the slag phase (αslag = 1.0), the model described in Section 2.1 and 2.2 can be applied directly. This is referred to as the slag-in-bath approach. 2) FL formation in the freeboard region (inset B of Figure 1): splash-induced liquid slag drops collide with the reactor wall and solidify. Unlike the slag bath, in this region both gas and solidifying slag coexist locally (αslag < 1.0), and they form a slurry zone (which includes gas, liquid slag, and solid slag). As a result, the model described in Section 2.1 and 2.2 must be extended as described later. It is referred to as the slag-in-freeboard approach.
Figure 3 is introduced to understand the computational challenges associated with the modeling of FL formation in the freeboard region. Figure 3ai–iii shows a schematic sequence of events leading to the collision and solidification of a liquid slag drop on the reactor wall in the freeboard region. The liquid slag drops originate from splashing. As shown in Figure 3aiii, after colliding with the cold wall, the drop adhered to the wall and solidified, forming an FL layer. Figure 3bi–iii shows the modeling concept for the scenario described earlier. Computational cells (black lines) are shown with an arbitrary refinement. The gray scale reflects αslag: lighter cells indicate lower αslag, whereas darker cells indicate higher αslag. Drop adhesion to the wall is ensured by the combination of no-slip boundary conditions (BCs) at the wall and a substantial increase in slag viscosity during solidification. This prevents the drop from being deformed by external forces, such as incoming flow or gravity, allowing it to remain stationary and adhere firmly to the wall. Figure 3ci–iii shows rendered images of the preliminary simulation results obtained using the slag-in-freeboard approach. The shape of the drop is an interpolation of the cell center values of αslag (with CFD-Post from ANSYS Fluent). The FL layer comprises two layers of computational cells adjacent to the wall. Note that the mesh was more finely resolved (≈4 mm) near the wall to capture the FL with the necessary detail. As expected, the drop solidified and remained stationary after colliding with the wall.
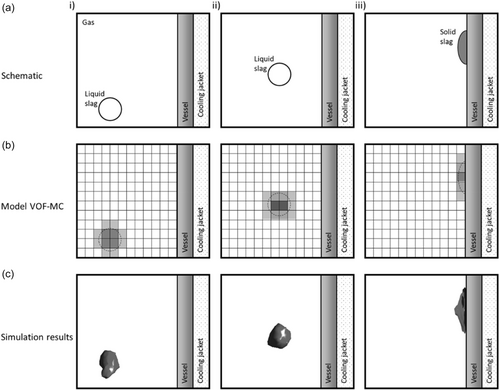
From a modeling standpoint (Figure 3b), the parameters and material properties used in the conservation equations (Equation (7)–(9)) vary with the local αslag, as determined by the mixture laws (Equation (4-5)–(6)). When T > Tliquidus, fs = 0 and no adaptation is required for the VOF model. However, when T < Tliquidus, solidification occurs, which means that fs varies as shown in Figure 2, the latent heat is released into the domain according to Equation (1), the drag force is updated according to Equation (2), and the slag viscosity varies according to Equation (13) (Section 2.4). Notably, the slag viscosity can increase by several orders of magnitude with decreasing temperature. This can cause the slag solid/liquid mixture properties to dominate the corresponding mixture equation in the VOF conservation equations, even in computational cells with low αslag. This could incorrectly cause the computational cells with minimal solidifying slag to behave as a solid structure and obstruct the flow from reentering (or flowing out of) the computational cell.
A solution to this problem is to refine the mesh near the reactor wall. This increases the likelihood of αslag = 1.0; therefore, the model operates similarly to the slag-in-bath approach (Case I in Figure 4a). However, this mesh refinement cannot eliminate the scenario of αslag < 1.0 (Case II in Figure 4a). Therefore, a new algorithm is proposed for these cases.

Note that when any liquid slag drops splash on the front of an already formed FL layer, it adds its corresponding mass to that layer and increases its thickness. Also, solidification is only activated when αslag ≠ 0; that is, no solidification of the gas phase is allowed.
2.4 Simulation Settings
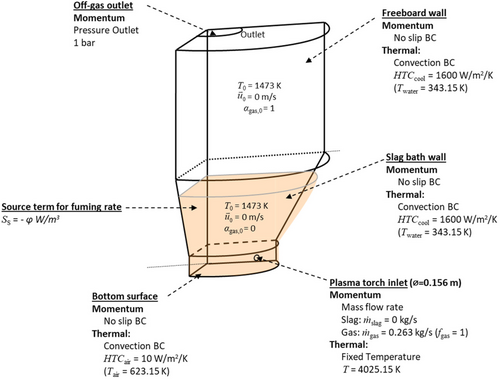
The simulation settings are shown in Figure 5. It includes the calculation domain, momentum and thermal BCs, energy-source term, and initial conditions. Because of symmetry, only one-third of the furnace was simulated. A mesh with 3.6 million cells was used, with local refinement near the wall (with 4 mm cells) to guarantee an adequate resolution of the FL. Variable time-stepping was used based on the maximum Courant number (set to 0.9). However, the fine mesh near the furnace walls and the relatively high inlet gas velocity resulted in a time-step ranging between 10−5 and 10−4 s, leading to an extremely high calculation cost. For example, simulating only 200 s of real-time processing would require ≈1 year for a high-performance cluster (using 56 CPU cores). This computational cost makes simulating the entire FL formation process on the freeboard infeasible. Therefore, the FL formation in the freeboard region was simplified. A thin (0.0235 m) FL layer was patched on the surface of the furnace in the freeboard region following the recommendations of the industry. This ensured a reasonable local heat transfer (although not fully accurate) within a reasonable timeframe, even if no slag splashing reached the upper portion of the furnace. A mesh independence study could not be performed for this 3D domain due to the prohibitive computational cost of running simulations with a mesh that is 4 or 16 times larger than the current configuration. Instead, such a study was conducted in an analogous 2D domain, demonstrating consistent results across different mesh sizes. A PISO velocity–pressure coupling method was used, along with a second-order spatial discretization scheme for most equations. For the volume fraction, the Compressive Interface Capturing with Adaptive Mesh Refinement (CICSAM) discretization method was used because it offered good interfacial sharpness while still ensuring model stability.
| Symbol | Units | Values | |
|---|---|---|---|
| Slag (MC) | |||
| Density | ρ slag | kg m−3 | 3500 (Boussinesq approximation) |
| Thermal expansion coefficient | β T,slag | 1 K−1 | 5.55 × 10⁻⁵ |
| Thermal conductivity | k c,slag | W (m K)−1 | 1.065 + 216.212/T + 46 659/T2 − 9 876 693/T3 |
| Viscosity | μ slag | kg (m s)−1 | Equation (13) |
| Specific heat capacity | c p,slag | J (kg K)−1 | 1063.21 − 122 508/T |
| Liquidus temperature | T Liquidus | K [ºC] | 1435.15 (1162.80) |
| Solidus temperature | T Solidus | K [ºC] | 1183.60 (910.45) |
| Latent heat | L slag | J kg−1 | 2.5 × 10⁵ |
| Drag coefficient | K 0 | kg (m−3 s−1) | 3.0 × 10⁸ |
| Gas | |||
| Density | ρ gas | kg m−3 | 0.43 |
| Specific heat capacity | c p,gas | J (kg K)−1 | 1061 − 4.328 × 10⁻¹ T + 1.023 × 10⁻³ T2 − 6.475 × 10⁻⁷ T3 + 1.386 × 10⁻¹⁰ T4 |
| Thermal conductivity | k c,gas | W (m K)−1 | −7.488 × 10⁻³ + 1.781 × 10⁻⁴ T − 2.376 × 10⁻⁷ T2 + 2.201 × 10⁻¹⁰ T3 + 9.46 × 10⁻¹⁴ T4 + 1.58 × 10⁻¹⁷ T5 |
| Viscosity | μ gas | kg (m s)−1 | 4.113 × 10⁻⁶ + 5.0523 × 10⁻⁸ T − 1.4346 × 10⁻¹¹ T2 + 2.5914 × 10⁻¹⁵ T3 |
| Steel (reactor) | |||
| Grade | – | – | S355J2G3 |
| Thermal conductivity | k c,rea | W (m K)−1 | 40.0 |
| Thickness | l rea | m | 0.025 |
The material properties were primarily sourced from industrial data reported by Nagraj[22] (see Table 3). The Boussinesq approximation was used to account for the natural convection of the slag. As for the gas, due to the limitations of the VOF model, a constant gas density was necessary for calculation convergence. The surface tension at the interface between the gas and liquid slag drop was neglected due to the high Weber number (We ≫ 1) during splashing events.
3 Simulation Results
3.1 Dynamics of SF Process
This section discusses the key features of the flow dynamics observed during the SF process. Figure 7 shows three sequential snapshots of molten slag splashing across the freeboard, where the blue iso-surface represents the slag/gas interface at αslag = 0.1. Splashing events originate from the interaction between the hot gas plumes (created upon injection through the SPT) and the molten slag bath. After rising into the freeboard, the collapsing slag splash diverts the trajectory of the subsequent gas plumes, resulting in the observed variations in splashing directions across sequential snapshots (Figure 7a–c). This is crucial for achieving a wider and more uniform coating on the freeboard walls. In addition, the splashing motion directly influences the flow dynamics of the gas in the freeboard, creating a constantly changing flow field. Notably, this dynamic splashing behavior persists throughout the entire SF process, even after establishing a global energy balance. In the molten slag bath (semitransparent red region shown in Figure 7), the four streamlines illustrate the complex slag flow pattern, which is driven by hot gas injection and plume motion and their interactions with splashing events. The arrows on each streamline indicate the flow direction. Note that the streamlines reach most regions of the 3D domain across the snapshots, confirming the chaotic flow behavior in the slag bath.
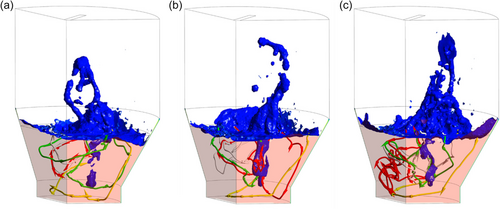
Figure 8a shows the iso-surface of the slag/gas interface at αslag = 0.5, overlaid with a contour of T. The results were obtained at t = 206 s. At this moment, a significant volume of molten slag is observed ascending into the freeboard region, indicating an imminent splashing event. Furthermore, the green and yellow regions in the predominantly blue temperature contour indicate that a recent splashing event on the freeboard surface caused a localized temperature increase. This suggests that frequent, successive splashing events can hinder local FL formation. In addition, a hot gas plume created by the SPT is visible in the slag bath, as shown in Figure 8a. This plume is expected to disrupt the slag interface, leading to further splashing.
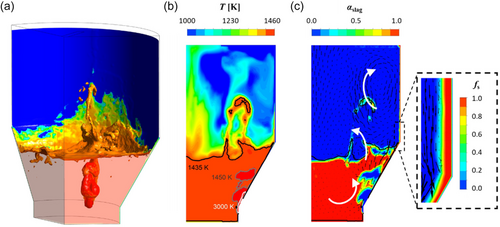
Figure 8b shows the contour of T, overlaid with temperature isotherms, in a vertical 2D plane intersecting the center of the SPT. The high-temperature zones near the inlet correspond to hot gas plumes, as confirmed in Figure 8c. The combined effect of the plume motion, splashing dynamics, and, to a lesser extent, natural slag buoyancy promotes a relatively homogeneous temperature distribution in the slag bath (uniform color in the region). The average temperature, excluding the hot plume areas, is 1435.45 K. This is only 0.3 K above Tliquidus. In contrast, the freeboard region exhibits significantly lower temperatures, although it is influenced by splashing events. The hot zones in this region indicate the recent or ongoing presence of hot molten slag, which increases the local gas temperature and influences the FL formation kinetics.
Figure 8c shows the contour of αslag, overlaid with black velocity vectors, in a vertical 2D plane intersecting the center of the SPT. The vectors indicate the direction and magnitude of the flow (the arrows range from 0 to 10 m s−1). The largest vectors arise from the gas plume motion in the slag bath and the motion of the splashing slag in the freeboard region. Additional white arrows are overlaid in Figure 8c to emphasize the most significant flow patterns. The inset in Figure 8c shows the FL layer formed on the wall. The first layer in contact with the wall has fs = 1, indicating that T < Tsolidus. The subsequent layers have 0 < fs < 1, indicating the development of a slurry zone where Tsolidus < T < Tliquidus. Moreover, the velocity vectors confirm that flow occurs mostly in the molten phase. As fs increases, the vectors gradually decrease until they completely disappear within the fully solidified FL.
3.2 Slag Splashing and FL Formation in Freeboard
Figure 9 shows the FL evolution as the molten slag approaches and collides with the reactor wall in the freeboard region. This demonstrates the effectiveness of the slag-in-freeboard approach introduced in Section 2.3. Although the actual simulation results are in 3D, a simplified 2D representation is shown here for clarity. The irregular mesh in Figure 9 stems from the fact that it represents a cross section of the original 3D mesh, which consists of regular hexahedral elements near the wall and tetrahedral elements elsewhere.
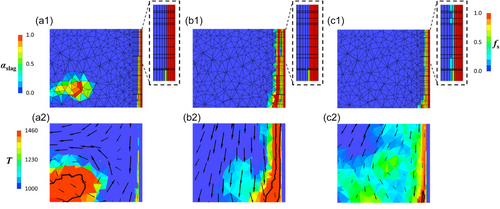
Figure 9a1 shows a molten slag drop approaching the reactor wall with a preexisting FL layer. The inset shows a magnified view of the corresponding fs distribution near the wall. Most of the FL layer consists of dark red computational cells (fs = 1), which indicates that T < Tsolidus. However, one green computational cell remains partially molten (i.e., Tsolidus < T < Tliquidus). Figure 9a2 confirms the elevated temperature of the molten slag drop, particularly within its core, where T > Tliquidus (enclosed by the black isoline). The velocity vectors indicate the movement of the molten slag drop toward the wall, which displaces the surrounding gas.
Figure 9b1 shows the moment after the molten slag drop collides with the reactor wall. Upon impact, the molten slag spreads across the preexisting FL layer, creating a localized hot zone at the FL front (black isoline shown in Figure 9b2). Despite the elevated temperature of the molten slag, the preexisting FL layer remains unaffected because of its lower temperature. This is evident from the identical appearance of the FL layers in the insets of both Figure 9a1,b1. The dark blue gap near the top of the spreading zone shown in Figure 9b1 reveals that the molten slag is temporarily unable to cover a small number of computational cells near the preexisting FL layer. However, this gap will be filled shortly afterward.
Figure 9c1 shows a later stage when the molten slag drop flows downward and leaves behind a thin coating that completely covers the preexisting FL layer. Owing to the continuous heat exchange between the preexisting FL layer and the molten slag, the temperature in this thin coating falls below Tliquidus. This is evident from the temperature drop and retraction of the black isoline shown in Figure 9c2. Consequently, the slag solidifies, forming a fresh FL layer on top of the preexisting layer. This fresh FL is identified by the new cyan cells in the inset of Figure 9c1 and only occurs in computational cells where αslag ≥ 0.65 (as defined in the slag-in-freeboard approach described in Section 2.3).
Figure 10 shows a broader 3D perspective of a slag splashing event and the corresponding FL formation in the freeboard region. This perspective is intended to enhance our understanding of the process dynamics. The iso-surface shows the slag/gas interface at αslag = 0.5, overlaid with a contour of fs. Special focus is directed toward the splashing event occurring on the upper-right side of the freeboard; the insets provide a magnified view of the impact region. The semitransparent red color on the symmetry planes represents the molten slag bath. For clarity, the existing FL layer on the reactor freeboard wall is not shown (the background is transparent).
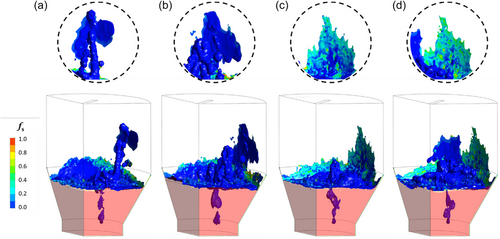
Figure 10a shows a splash event when the molten slag collides with the upper-right side of the freeboard. As the temperature of the slag exceeds Tliquidus, it remains in a completely molten state (fs = 0.0). Upon impact, the molten slag spreads and begins to slide down the wall due to gravity. Consequently, the inset in Figure 10b shows a larger downward-extending slag coating. Throughout this sequence, heat is transferred from the molten slag to the cooler FL layer, resulting in a gradual decrease in the slag temperature. As shown in Figure 10c, the molten slag layer starts to solidify, as confirmed by the change in the fs color contour from dark blue (molten) to cyan (partially solidified). In addition, as the slag solidifies, its viscosity increases, causing it to become more rigid and adhere more tightly to the existing FL layer. Figure 10d shows the later stage of the process with continued solidification of the slag coating on the wall. fs increases further, as demonstrated by the change in fs color contour from cyan to dark green.
Parallel to the aforementioned events, a molten-slag wave coats the lower left side of the freeboard (Figure 10a). This wave retracts in subsequent moments, leaving behind a thinner coating that gradually solidifies to form a localized FL layer, as indicated by the cyan or green colors shown in Figure 10b,c. However, this new FL layer is interrupted by a new splashing event in the central region shown in Figure 10d. The impact of this molten slag travels toward the left side, potentially remelting the recently formed FL layer in that area.
3.3 GNEB
At ≈t = 190 s, GNEB is established. This implies that the system reaches an equilibrium state where the overall energy input balances the energy output, even with ongoing flow dynamics. Table 4 lists the simulated heat fluxes on specific reactor surfaces after achieving GNEB. These results were compared with industrial furnace data from Aurubis–Beerse for validation. For commercial reasons, the heat sources related to the fuming reactions are not presented here. The heat flux from the inlet is not shown because it is a predefined BC (see Figure 5).
| Heat fluxes [MW] | |||
|---|---|---|---|
| Industrial data | Simulation | Error [%] | |
| Roof | −0.7 | −0.69 | −1.4 |
| Walls—slag bath | −1.45 | −1.77 | 22.1 |
| Walls—freeboard | −2.20 | −1.86 | −15.5 |
The simulation results generally agree well with the industrial data for most reactor surfaces. However, the heat fluxes at the walls exhibit discrepancies exceeding 15%. This can be explained by the dynamic behavior of slag splashing and hot gas plumes, which can cause temporary variations in the heat transfer across the slag bath and freeboard walls. For instance, a few seconds later, the simulation results show heat fluxes of −1.53 and −2.09 MW on these surfaces during a large splashing event. However, in both cases, when the aggregate heat flux through both the slag bath and freeboard walls is considered, the simulation results strongly agree with the industrial data, with error margins falling below 1%.
Table 5 lists a comparison between the simulation results and industrial data for the average surface temperatures at specific reactor surfaces. Note that the “Walls” listed in Table 5 correspond to the inner surface of the reactor. The overall agreement is good, with all surface temperatures matching industrial data within ±5%.
| Average temperature [K] | |||
|---|---|---|---|
| Industrial data | Simulation | Error [%] | |
| Roof | 1373.15 | 1340.86 | −2.3 |
| Walls—slag bath | 374.15 | 385.62 | 3.0 |
| Walls—freeboard | 374.15 | 357.34 | −4.5 |
3.4 FL Thickness
Figure 11 shows the state of the FL layer at t = 225 s (i.e., after GNEB was reached). Figure 11a shows the FL thickness distribution on the reactor wall, whereas Figure 11b shows the variation of the FL thickness along the reactor height for three azimuthal angles (φ): 0°, 22°, and 45°. In both figures, the FL front is defined by the solid slag volume fraction at fs = 0.1.
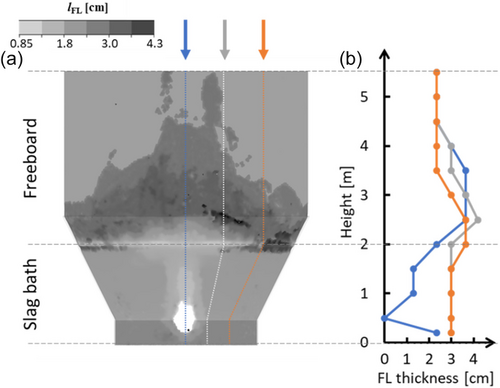
In the slag bath region (height range between 0 and 2 m in Figure 11b), the FL thickness is smallest along φ = 0° due to the influence of the hot gas plumes, which raises the local temperature and hinders solidification. Notably, the FL thickness vanishes at a height of 0.5 m because it coincides with the location of the SPT. As the azimuthal angles deviate from φ = 0°, the impact of the hot gas plumes weakens, and the FL thickness increases. For instance, at both φ = 22° and φ = 45°, the slag bath exhibits a consistent FL thickness of 3 cm, except for a slight increase to 3.65 cm near the interface at φ = 45°. This localized increase in FL thickness at φ = 45° can be attributed to the dynamic slag/gas interface, which results in periods where the area is momentarily devoid of hot slag from the bath. These intervals allow the existing thin layer of molten slag to cool and solidify, leading to an intermittently thicker FL layer at this specific location (before the hot slag returns and remelts this excess FL). As shown in Figure 11a, the FL thickness throughout the slag bath demonstrates symmetry around φ = 0°.
In the freeboard region (height range between 2 and 5.5 m, as shown in Figure 11b), the FL thickness exhibits a dependence on φ. At φ = 0°, a uniform FL thickness of 3.65 cm persists up to a height of 3.5 m before gradually decreasing to 2.35 cm (the FL thickness assumed as the initial condition in the simulation) at a height of 4.5 m. As φ deviates from 0°, the height at which the 3.65 cm FL thickness is maintained progressively decreases. For example, at φ = 22°, it reaches 3.0 m, whereas at φ = 45°, it reaches only 2.5 m. Unlike in the slag bath, the FL thickness in the freeboard region lacks symmetry around φ = 0° because of the varying frequency, direction and location of splashing and the resulting local heat transfer.
The average measured FL thickness in the industrial furnace operated by Aurubis–Beerse is 3 cm. In the slag bath region, the simulation results exhibit good agreement with the measured values, particularly at a distance from the SPT inlet that minimizes the influence of hot-gas plumes. In the freeboard region, the agreement is good in areas that experience at least one splashing event near the GNEB condition (i.e., once the slag is only slightly superheated). Clearly, at t = 225 s, no splashing events reached the top corner areas, and thus they retained their pre-defined FL thickness.
4 Discussion
4.1 Analysis of Thermal Balance during SF Operation
Achieving GNEB in the SF process means that thermal equilibrium is preserved between different heat sources and sinks. These include 1) heat input from the superheated slag bath; 2) heat input from the injected hot gas from the SPT; 3) heat removal by the cooling system, the off-gas outlet and the bottom surface; 4) energy sinks due to the fuming reaction; and 5) latent heat is caused by the melting or solidification of the FL.
Current heat-transfer models rely on Equation (14) to estimate steady-state FL thickness and temperature profiles across the layers of various systems.[25, 34, 35] HTCbath is a critical factor in these estimations. However, because it depends on complex factors, such as flow dynamics, multiphase transport, microstructure, and material properties, assigning an arbitrary value is unrealistic. Only comprehensive 3D simulations can determine the heat flux from the slag bath into the FL, from which the HTCbath can be derived. The current model estimated the steady-state HTCbath and qbath for the SF process to be ≈390 W (m−2 K−1) and 50 kW m−2, respectively.
Figure 12 shows the steady-state temperature profile across the reactor wall, the FL, the sub-liquidus layer, and the molten slag bath. The first and second dots correspond to the temperatures of the outer and inner reactor wall surfaces, respectively. The remaining dots correspond to the temperature at the corresponding computational cell center in the FL (nonpermeable zone), the sub-liquidus layer (permeable zone), and the molten slag bath. This curve was obtained at one location in the slag bath region; however, it is representative of the temperature profiles obtained at any location in the slag bath region if a sufficient distance from the SPT is considered to eliminate the influence of hot gas plumes.
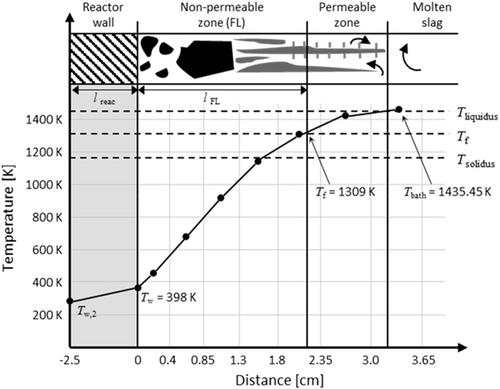
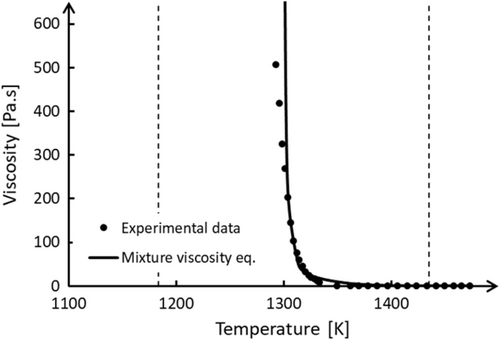
The temperature at the inner reactor wall is Tw = 398 K. The temperature profile across the FL exhibits a nearly constant gradient until it approaches Tf = 1309 K. This critical temperature corresponds to the threshold at which the slag transforms from a solid-like state to a liquid-like state, as indicated by the viscosity curve shown in Figure 6. This implies that in this model, Tf is not an arbitrarily chosen temperature, but rather depends directly on the rheological behavior of the slag.[11] When T ≤ Tf, the slag behaves as a static, non-permeable FL structure, which results in a large temperature gradient due to the small thermal conductivity of the FL. Conversely, when T > Tf, the slag transitions to a semisolid state with increased permeability. The viscosity in this permeable zone is higher than that in the molten slag but significantly lower than that in the non-permeable zone (FL). The corresponding temperature profile exhibits a gradual decrease in slope as it approaches the molten slag bath (Figure 12). The constant temperature profile across the different layers of the system overtime confirms the steady-state condition (Equation (14)) of the process.
4.2 Analysis of FL Layer and Splashing
In the slag bath, the simulation results show good agreement with industrial data in regions farther from the SPT but underestimate or even miss the FL formation closer to the inlet (Figure 9). This discrepancy arises from the strong influence of the hot-gas plumes, which is a consequence of assuming an SPT inlet at the reactor wall. In industrial furnaces, this issue has been rectified with a special nozzle design, where the SPT extends slightly inside the furnace, strategically positioning the gas plume farther away from the wall and reducing its direct impact on FL formation. However, this particular geometric feature was not considered in the current model because it would introduce excessive complexity. The small details of the extended SPT would require a very fine mesh in the region and an even smaller time-step size in the calculations than those currently used. This would significantly increase the simulation time. As a result, the findings presented in Section 3.4 must be analyzed with this limitation in mind, especially when analyzing Figure 9. It is highly probable that extending the SPT inlet location further into the slag bath would reduce the influence of the hot-gas plume on the FL thickness in this region.
In the freeboard region, the simulation results demonstrate that the splashing frequency and height vary with the azimuthal angle, leading to nonuniform FL formation across the freeboard. The lack of symmetry in the freeboard region is a consequence of the dynamic nature of splashing and its significant impact on FL formation patterns. At φ = 0°, the splashing height is largest, resulting in a thicker FL layer at higher levels. As the azimuthal angle deviates from φ = 0°, the splashing height reduces, causing the thicker FL layer to fade down. In addition, the splashing frequency influences the temperature distribution, which, in turn, affects the FL distribution. Frequent splashing hinders FL formation because it does not give enough time for the FL front to cool down enough for the subsequent splashing slag to solidify.
The simulation did not achieve full freeboard coverage through splashing within the simulated timeframe (Figure 9). In real-world operations, the FL is maintained on the reactor wall across multiple processing cycles. When the reactor undergoes complete cleaning to remove the existing FL layer, a specific procedure is employed to promote splashing and accelerate FL formation on the freeboard wall. This procedure was not included in the simulation. Therefore, the underestimated FL thickness in the top corner areas of the freeboard (where the FL thickness retained the predefined value) can be attributed to the limited simulation duration and absence of a dedicated splashing procedure. In the remaining areas of the freeboard, the simulation results for the FL thickness agree well with industrial measurements.
We recognize that the study of drop impact on solid surfaces is an extensively researched topic. The proposed slag-in-freeboard model is not intended to replace these sophisticated approaches, as it lacks their precision. Instead, the slag-in-freeboard model provides a practical numerical solution within an Eulerian framework for scenarios involving liquid splashing and solidification, capturing their impact on local heat transfer.
4.3 Other Considerations
All of the results discussed in Section 3 occur after t = 170 s (particularly if FL formation is analyzed) due to excessive slag superheat prior to this point. For the formation of an FL, molten slag must splash onto the freeboard and cool rapidly enough to solidify below Tliquidus. FL formation in the freeboard only occurs after t = 170 s when the slag's superheat is reduced sufficiently.
The large calculation domain for the SF process, the refined mesh, and high flow velocities in certain regions result in significant computational time requirements. Achieving 200 s of real-time operation required ≈6 months. This period was dedicated to establishing GNEB, which is a crucial criterion for validating the accuracy of a model. Note that including the FL patch in the freeboard region reduced the simulation time by half compared with a setup without the FL patch (discussed in Section 2.4). With the GNEB established, the model is well suited for conducting parametric studies. Any subsequent simulation using new parameters can achieve a new equilibrium much sooner. Although the model is not suitable for real-time assessment, it can be effectively employed to produce long-term strategic changes in industrial furnaces.
In Figure 9, the FL front was assumed to be at fs = 0.1, which corresponds to a higher temperature (1425 K) than the previously mentioned Tf of 1309 K. This difference reflects a practical consideration of real operation. After the molten slag is tapped from the furnace, a thin layer likely remains on the reactor's inner wall and solidifies before measurements are obtained in the reactor. This contributes to a thicker overall FL. Therefore, a higher temperature of 1425 K was used for the FL front shown in Figure 9 instead of the original Tf value of 1309 K.
In Figure 10a1, the αslag distribution in the FL layer transitioned from deep red near the wall to orange in subsequent cells. This shift arises from the modeling choices discussed in Section 2.4, where the first three cells adjacent to the wall were initialized with αslag = 1 and fs = 1. Conversely, the subsequent cells reflect the FL formation calculated using the numerical model, which ranges from 0.65 to 1.0. The numerical threshold αslag,cr = 0.65 for FL formation in the freeboard region (referred to as the slag-in-freeboard modeling approach) is introduced in this study. Laboratory experiments on slag solidification under bath conditions have reported αslag for FL samples between 0.6 and 1.[11] However, no data is available in the literature for αslag in scenarios involving slag splashing in the freeboard region.
According to Bellemans et al.[36] reducing the average operational temperature of slag (even below Tliquidus) can enhance the energy efficiency of the SF process. The reduced slag temperature lowers the heat flux, minimizes the load on the cooling system, and reduces energy consumption. However, to achieve a positive net throughput, these energy savings must offset the potential reduction in production output caused by the lower operating temperature. This delicate balance underscores the crucial role of precise control in optimizing overall system performance. The proposed model can serve as a valuable tool for examining and understanding the implications of such modifications.
Another important topic for discussion is the chemistry incorporated in the model. Currently, the model does not explicitly solve for the chemical reactions occurring in the slag. Instead, it accounts for the effects of endothermic chemical reactions on the system's enthalpy. For simplicity, a constant sink term was assumed throughout the model, implying that the fuming rate remains constant during the process. However, this approach oversimplifies the situation. In reality, as the temperature of the slag and the ZnO content decrease, the fuming rate is expected to diminish overtime. This decrease is also expected to affect the solidification path illustrated in Figure 2. This variation is not considered in the current model, and no analysis was conducted to assess its impact on the final results.
5 Conclusions
This study introduces a novel model for simulating a batch-type plasma-driven SF furnace operated at Aurubis–Beerse. The model couples the VOF model with an MC solidification model. Building on our prior work on FL formation in the slag bath of an ESF,[17] the present model expands its capabilities to include the complex phenomena of slag splashing and solidification on a freeboard wall, where both slag and gas phases coexist. This comprehensive model enables a detailed simulation of the dynamic interplay between fluid flow, heat transfer, multiphase transport, and FL formation in both the slag bath and freeboard regions.
Two primary mechanisms for FL formation have been identified. The slag-in-bath approach, validated in previous studies,[17] refers to the numerical treatment of the FL formation in the slag bath region. The slag-in-freeboard approach, introduced in this study, refers to the numerical treatment of FL formation in the freeboard region as a result of slag splashing. A detailed investigation of the slag-in-freeboard approach yielded valuable insights into the critical role of slag splashing in FL formation in the freeboard region, enhancing our overall understanding of FL evolution.
Despite the inherent complexity of the SF process, the simulation results were in good agreement with the available industrial data. The simulation results for the FL thickness showed good agreement with the industrial data, especially in the slag bath. Discrepancies were justified by the model simplifications. Similarly, simulation results for the heat flux through the reactor surfaces also aligned well with industrial data. While molten slag splashing introduced fluctuations in local heat fluxes, the system maintained a GNEB. Although these comparisons do not conclusively validate the model, the agreement in critical parameters like heat flux and FL thickness significantly strengthens our confidence in its capabilities and robustness.
Models for predicting FL thickness typically rely on the balance of heat fluxes across the system layers (e.g., cooling system, reactor wall, FL, and slag bath). Accurately determining the heat flux from the slag bath into the FL is crucial. This parameter is influenced by complex factors such as flow dynamics, multiphase transport, microstructure, and material properties. Previous studies often relied on a simplistic engineering approach, where arbitrary values were assigned to the HTC in the slag bath (HTCbath). Such an approach is inadequate for capturing the intricate dynamics of the system. The novel model introduced in this study is pivotal, as it enables a precise determination of the heat flux from the molten slag bath into the FL by considering all these intricate phenomena.
While further refinement of material properties and slag solidification kinetics is necessary, the model demonstrates significant potential for practical applications. The model can serve as a valuable tool for optimizing furnace operation and design, as it can assess how various parameters can affect FL formation and heat transfer. Moreover, the versatility of the current model extends its applicability to a wide range of industrial processes involving slag operation, making it invaluable for addressing the energy-saving challenges encountered in various industrial sectors.
Nomenclature
| Density | ρ | kg m−3 |
| Drag coefficient | K 0 | kg (m−3 s−1) |
| Enthalpy | h | J kg−1 |
| Gravity vector | m s−2 | |
| Gas/slag volume fraction | f | – |
| Heat-transfer coefficient | HTC | W m−2 K−1 |
| Latent heat | L | J kg−1 |
| Liquid/solid slag volume fraction | α | – |
| Mass | m | kg |
| Mass flow rate | kg s−1 | |
| Specific heat capacity | c p | J (kg K)−1 |
| Static pressure | p | Pa |
| Temperature | T | K |
| Thermal conductivity | k c | W (m K)−1 |
| Thermal Expansion Coef. | β T | 1 K−1 |
| Thickness | l | m |
| Time | t | s |
| Transfer term—drag | kg (m−2 s−2) | |
| Transfer term—fuming rate | J (m−3s−1) | |
| Transfer term—phase change | J (m−3 s−1) | |
| Velocity vector | m s−1 | |
| Viscosity | μ | kg (m s)−1 |
| Subscripts | ||
| Cooling system | cool | – |
| Critical | cr | – |
| Freeze lining | FL | – |
| Gas phase | gas | – |
| Liquidus | liquidus | – |
| Molten slag bath | bath | – |
| Reactor | reac | – |
| Reactor wall | wall | – |
| Slag bath/FL temperature | f | – |
| Slag phase | slag | – |
| Slag phase—liquid | ℓ | – |
| Slag phase—solid | s | – |
| Solidus | solidus | – |
| Superscript | ||
| Packing limit | p | – |
Acknowledgements
This study was supported by the Austrian Research Promotion Agency (FFG) under the framework of the Bridge 1 program (MoSSoFreez Project, grant no. F0999888120). The authors thank Prof. Muxing Guo, Dr. Annelies Malfliet, and Zilong Qiu from KU Leuven, as well as Dr. Samant Nagraj from Umicore for their discussions and valuable input.
Conflict of Interest
The authors declare no conflict of interest.
Open Research
Data Availability Statement
The data that support the findings of this study are available from the corresponding author upon reasonable request.


