Characterization of Nonmetallic Inclusions in Different Ferroalloys used in the Steelmaking Processes
Abstract
Ferroalloys are one of the most important raw materials widely used in the steelmaking processes. Depending on the cleanliness of used ferroalloys, they can be an inevitable source of impurities and nonmetallic inclusions (NMIs) in steelmaking products. Herein, the inclusions in five different industrial ferroalloys (FeTi, FeMo, FeW, MnN, and FeCrN) are investigated. This is done using 2D investigations on polished cross sections of ferroalloy samples and using 3D investigations of NMIs on film filters and metal surfaces after electrolytic extraction (EE) using scanning electron microscopy in combination with energy-dispersive spectroscopy (SEM-EDS). Moreover, the characteristics of the main types of inclusions presented on film filters and metal surfaces after EE are compared and their possible transformations in Al-killed steel are evaluated. The results show that the main inclusions are more likely the oxidization products of the reductant and some unreduced ore during the ferroalloy production process. The 3D investigations of inclusions on metal surfaces after extraction are found to be very useful in detection and evaluation of larger-sized inclusions. Overall, this study helps to better understand the impurities in different ferroalloys and their possible effect on the steel cleanliness.
1 Introduction
Ferroalloys are commonly used as deoxidizers and alloying agents in the steelmaking process, due to the influence of alloying elements on the different final properties of steels. It is known that the various impurities (such as O, S, N, and others) and nonmetallic inclusions (NMIs) are more or less unavoidable in commercially available ferroalloys. As a result, additions of ferroalloys can result in an inadvertent entry of these NMIs to the liquid steel.[ 1 ] Therefore, due to the large amount of ferroalloys added in the steelmaking process, their effect on steel cleanliness cannot be neglected. This is true in the production of high-quality and high-alloyed steel grades. Up to now, most researchers focused their attention mostly on controlling the inclusion characteristics in steel directly during the steelmaking process as well as in the final steel products. However, very few publications are focused on research regarding the effect of ferroalloy quality on steel cleanliness with exceptions for some articles focused on the study of FeSi,[ 2-4 ] HCFeCr,[ 5 ] and FeTi[ 6-8 ] alloys. Based on these findings, it is reasonable to conclude that the addition of ferroalloys has definitely some influence on the overall quality of steels. Therefore, more detailed information regarding the impurity elements and NMIs in various ferroalloys need to be well known before they are added to steel.
According to the volume of added ferroalloys, they are usually classified in two groups: major ferroalloys (produced in large quantities, such as FeSi, FeMn, FeCr, etc.) and minor ferroalloys (produced in smaller quantities, such as FeTi, FeMo, FeW, etc.). Up to now, inclusions in FeSi,[ 9-11 ] FeMn,[ 1, 11 ] FeCr,[ 12, 13 ] FeNb,[ 1 ] FeTi,[ 1, 11, 14 ] and FeMo[ 1, 12 ] alloys have been studied and described. Dorrer et al.[ 8 ] reported that the number of small Al–Ti–O inclusions in ultralow carbon steel increased significantly after an addition of FeTi75 alloy during the RH treatment. These inclusions were suspected to accelerate the build-up of clogging deposits during the casting of steel. Also, Kaushik et al.[ 15 ] showed that the impurities in FeTi alloys can cause the formation of larger titanium aluminate inclusions, which in turn lead to increased product rejections. Pande et al.[ 6, 7 ] reported that the addition of FeTi alloys can result in Al–O, Al–Ti–O, and Ca–Al–Ti–O inclusions in the steel melt. Pande et al.[ 1 ] also used the acid extraction method to analyze inclusions in FeTi and FeMo alloys. They reported that ≈1–1.5% and 9–10% insoluble impurities were observed in FeTi70 and FeTi35 alloys, respectively. However, the extracted inclusions did not completely match the inclusions observed on the polished surface, which indicated that some inclusions were selectively dissolved in the acid solution. In terms of FeMo alloys, the inclusions in the polished matrix were in good agreement with the acid extracted inclusions, but the total O content did not agree with that in the extracted inclusions.[ 1 ] The main oxides in FeMo alloys were found to be SiO2 and Al2O3, whereas there might be some molybdenum oxides which were soluble in acid. Later, Bi et al.[ 11, 16 ] applied the electrolytic extraction (EE) method for 3D investigations of NMIs in different ferroalloys. The EE is a softer extraction technique, at which the investigated inclusions did not dissolve during extraction. However, most of their discussions with respect to FeTi alloys focused on Fe–Ti intermetallic phases, which were not harmful to the liquid steel. Therefore, further work needs to be done for the investigations of NMIs in FeTi and FeMo alloys using the EE method. In addition, more information can be obtained about harmful large-sized inclusions on the metal surface after EE in some other types of ferroalloys, as was described in a previous study.[ 17 ] Moreover, inclusions in FeW and N-containing ferroalloys have not been reported yet.
To broaden the knowledge concerning the ferroalloy quality, more detailed research was conducted for various commercial FeTi and FeMo alloys from different companies. The results were compared with previous data to obtain more comprehensive information of inclusions. In addition, some new ferroalloys (such as FeW and N-containing MnN and FeCrN ferroalloys) were selected for 3D investigations of NMIs using the EE method. The inclusions on polished cross sections of ferroalloy samples as well as on film filters and metal surfaces after EE were also studied. Moreover, the possible behaviors of some main inclusions from different ferroalloys in Al-killed steel melt were considered based on thermodynamic calculations.
2 Experimental Section
The investigations of inclusions and microstructures in this study were carried out using five types of commercial alloys: FeTi type consisting of two samples (FeTi-1 and FeTi-2), FeMo type consisting of three samples (FeMo-1, FeMo-2, and FeMo-3), FeW, MnN, and FeCrN with one sample each. In addition, the samples of FeTi and FeMo alloys were selected from different steelmaking companies. The typical chemical compositions of these ferroalloys are shown in Table 1 . The residual element content is Fe.
| Ferroalloy | Ti | Mo | W | Ni | Mn | Cr | C | Si | Al | P | S | O | N | Ca |
|---|---|---|---|---|---|---|---|---|---|---|---|---|---|---|
| FeTi-1 | 71.7 | – | – | – | 0.27 | – | 0.089 | 0.38 | 0.441 | 0.008 | 0.009 | 0.65 | 0.271 | – |
| FeTi-2 | 76.2 | – | – | – | 0.05 | – | 0.05 | 0.6 | 3.3 | 0.011 | 0.002 | 0.43 | 0.055 | – |
| FeMo-1 | – | 68.6 | – | – | – | – | 0.05 | 0.66 | 0.08 | 0.058 | 0.054 | 0.67 | 0.015 | – |
| FeMo-2 | – | 63.8 | – | – | – | – | 0.008 | 0.85 | 0.015 | 0.053 | 0.026 | 0.97 | 0.008 | – |
| FeMo-3 | – | 67.2 | – | – | – | – | 0.06 | 1.43 | 0.78 | 0.041 | 0.044 | 1.56 | 0.023 | – |
| FeW | – | – | 77.96 | – | 0.11 | – | 0.07 | 0.79 | – | 0.034 | 0.07 | 0.88 | – | – |
| MnN | 0.04 | – | – | – | 85.5 | – | 0.039 | 0.23 | 0.081 | 0.02 | 0.04 | 3.33 | 7.74 | 0.052 |
| FeCrN | 0.21 | – | – | 0.35 | – | 69.2 | 0.05 | 0.39 | 0.16 | 0.014 | 0.017 | 2.03 | 5.55 | 0.21 |
First, each sample was polished and prepared for common 2D observations of different NMIs on a cross-sectional surface of the metal sample using scanning electron microscopy (SEM) in combination with energy-dispersive spectroscopy (EDS). After evaluation of NMIs, the polished sample was dissolved using the EE method in a 10% AA electrolyte (10 v/v% acetylacetone–1 w/v% tetramethylammonium chloride–methanol). The following parameters for the EE process were used: an electric current between 42 and 70 mA, a voltage between 3.6 and 5.0 V, and an electric charge of 1000 coulomb. The electrolyte solution obtained after the extraction was filtered using a polycarbonate (PC) membrane film filter with an open pore size of 0.4 μm. NMIs, which were extracted from the metal samples and collected on film filters, were investigated as 3D objects using SEM-EDS. In this study, this analytical technique denoted as the EE-FF method. The metal surface of the ferroalloy sample after EE was also used for the investigation of the inclusion characteristics (denoted below as the EE-MS method).
3 Results and Discussion
3.1 Extracted Inclusions in Different Ferroalloys
3.1.1 FeTi Alloys
Table 2 shows the inclusion classifications in FeTi alloys based on the composition determinations. Overall, three different types of inclusions were observed in each FeTi alloy. The majority of inclusions in FeTi-1 alloys is type A pure TiO x inclusions (≈63%, Nv=3915 incl. mm−3), which have the largest sizes (dv) up to 70 μm and a maximum length (L) up to 84 μm. This is followed by type B inclusions (≈28%), which contain high Ti contents with small contents of C and N (4% at average). Moreover, about 9% silicates containing some Al2O3 were found in this alloy, which have the smallest size range (dv = 4–11 μm) and number density (Nv = 559 incl. mm−3).
| FeTi-1 | |||
|---|---|---|---|
| Type | Type A | Type B | Type C |
| Typical photo |
|
|
|
| L, μm | 7–84 | 7–74 | 5–12 |
| dv, μma) | 22 ± 13 (6–70) | 24 ± 14 (7–65) | 5 ± 4 (4–11) |
| Composition, wt% | ≈100% TiO x | ≈100% Ti-(C,N) | 74–95% SiO2, 5–26% Al2O3 |
| Percentage, n% | 63 | 28 | 9 |
| Nv, incl. mm−3 | 3915 | 1739 | 559 |
| FeTi-2 | |||
| Type | Type A | Type D | Type E |
| Typical photo |
|
|
|
| L, μm | 6–33 | 7–48 | 4–15 |
| dv, μma) | 15 ± 5 (5–24) | 16 ± 6 (6–42) | 8 ± 4 (3–13) |
| Composition, wt% | ≈100% TiO x | ≈100% Ti–Al–(O) | ≈100% SiO2 |
| Percentage, n% | 26 | 66 | 8 |
| Nv, incl. mm−3 | 2033 | 5244 | 566 |
- a) – average value ± standard deviation σ, (…– …) – minimum and maximum values.
The number density of TiO x inclusions in FeTi-2 alloys is about one-half of that in FeTi-1 alloys. In addition, the size range of them in FeTi-2 alloys (5–24 μm) is much smaller than that in FeTi-1 alloys (6–70 μm). The majority of particles in FeTi-2 alloys are type D inclusions which contain high Ti contents (>80%) with some amounts of O and Al (11–14%). They account for 66% of the total inclusion content and have the largest number density (Nv = 5244 incl. mm−3) and size ranges (6–42 μm) among all the inclusion types found in FeTi-2 alloy. They cannot be considered as TiO x inclusions due to the low O contents and are more likely a Ti–Al intermetallic phase. In addition, some SiO2 inclusions (type E) having the smallest sizes ranges (3–13 μm) were also observed.
According to the results reported by Pande et al.,[ 1 ] the extracted inclusions in FeTi alloys were mostly SiO2, Al2O3, and Al–Ti–O inclusions. FeTi alloys are usually produced by the reduction of Ti from titanium minerals (TiO2, FeO·TiO2, or CaO·TiO2).[ 18 ] Generally, Si has a lower affinity for oxygen than Ti, and thus the reduction of TiO2 is only possible with a high content of Si (20–25%) in the alloy.[ 18 ] In the present study, the relatively low Si contents (<0.6%) and high Al contents in these two FeTi alloys indicate that they were obtained by the aluminothermic method. Therefore, the reduction of Ti by Al from titanium minerals via the formation of intermediate TiO x , which later can form Al2O3–TiOx inclusions. The behavior of these existing inclusions in FeTi alloys has not been extensively studied. As reported before, the possible inclusions in steel melts after additions of FeTi alloys depended on the Ti/Al ratio, which is an important factor in Al-killed Ti-stabilized steel.[ 15, 19, 20 ]
3.1.2 FeMo Alloys
The typical inclusions in three LCFeMo alloys are shown in Table 3 . It should be pointed out that a large number of pure Mo and FeMo intermetallic phases were found after EE. However, they are not considered in this study. Type A inclusions in FeMo-1 alloys are single spherical or cluster-like SiO2 inclusions (27%), whose sizes reach 33 μm. They were commonly found in these alloys as described in previous works.[ 1, 12 ] Type B inclusions are MoO x inclusions which account for 53% of the total inclusion contents. The third group of inclusions are pure Al2O3 (20%), which were also investigated by Pande et al.[ 1 ] using the acid extraction method.
| FeMo-1 | |||
|---|---|---|---|
| Type | Type A | Type B | Type C |
| Typical photo |
|
|
|
| L, μm | 5–41 | 4–30 | 8–29 |
| dv, μm | 20 ± 15 (4–33) | 16 ± 7 (4–25) | 14 ± 6 (7–21) |
| Composition, wt% | ≈100% SiO2 | ≈100% MoO x | ≈100% Al2O3 |
| Percentage, n% | 27 | 53 | 20 |
| Nv, incl. mm−3 | 2820 | 5452 | 2068 |
| FeMo-2 | |||
| Type | Type A | Type B | Type D |
| Typical photo |
|
|
|
| L, μm | 6–53 | 2–38 | 2–26 |
| dv, μm | 14 ± 10 (6–48) | 17 ± 6 (2–33) | 7 ± 4 (2–20) |
| Composition, wt% | ≈100% SiO2 | ≈100% MoO x | ≈100% MoO x –FeO |
| Percentage, n% | 6 | 62 | 32 |
| Nv, incl. mm−3 | 3488 | 35752 | 18312 |
| FeMo-3 | |||
| Type | Type A | Type B | Type E |
| Typical photo |
|
|
|
| L, μm | 2–100 | 2–18 | 2–181–56 |
| dv, μm | 20 ± 17 (2–93) | 8 ± 5 (2–23) | 25 ± 20 (1–48) |
| Composition, wt% | ≈100% SiO2 | ≈100% MoO x | 73–94% SiO2, 6–27% Al2O3 |
| Percentage, n% | 29 | 6 | 65 |
| Nv, incl. mm−3 | 6001 | 1286 | 13717 |
In FeMo-2 alloys, MoO x inclusions (type B) are the major-type inclusions (62%). Their number density (Nv = 35 752 incl. mm−3) is almost six times higher than that in FeMo-1 alloys (Nv=5452 incl. mm−3). Moreover, they have a similar average size and wider size ranges compared with those found in FeMo-1 alloys. The elemental mappings of typical MoOx inclusion are shown in Figure 1a, which shows a very smooth surface and homogeneous distributions of Mo and O in inclusions. The second common type of inclusions (type D) are Mo–Fe–O inclusions (32%), whose number density is about half of MoO x inclusions. Spherical and irregular SiO2 inclusions (type A) were also found, the mappings of typical SiO2 inclusion are shown in Figure 1b. The morphologies of SiO2 inclusions in these two FeMo alloys were found to be similar. The only difference is that they have a larger number density and size ranges in FeMo-2 alloys compared with those found in FeMo-1 alloys.

In FeMo-3 alloys, about 29% of inclusions are SiO2 (type A). However, they present a dendritic or flower-like shape, which is different from those found in the other two FeMo alloys. The mapping results of a SiO2 inclusion in FeMo-3 alloys are shown in Figure 1c. They have the largest size ranges (2–93 μm) compared with those found in FeMo-1 (4–33 μm) and FeMo-2 (6–48 μm) alloys. The majority of inclusions (65%) in FeMo-3 sample are irregular silicate inclusions (type E) containing a small amount of Al2O3 (6–27%), and their mapping results are shown in Figure 1d. A small number (6%) of MoO x inclusions was also observed in this sample.
According to the previous results,[ 1, 12 ] SiO2, SiO2–Al2O3, SiO2–CaO–Al2O3 and high SiO2-containing inclusions were observed in FeMo alloys. Therefore, pure SiO2 are the most common inclusions as they are found in all the samples. Considering the different morphologies of SiO2 inclusions observed in this study, it is suggested that the dendritic or flower-like SiO2 inclusions form at the end of the solidification of the ferroalloy melt. This might be similar to the findings for the case of Al2O3 inclusions.[ 21, 22 ] If the dendritic inclusions are formed at an early stage, a transformation to a spherical shape is more probable due to the driving force provided by a decreased surface area. The usual molybdenum mineral is MoS2, which first transforms to MoO3 during oxidative roasting of Mo concentrates. In the production process of FeMo alloys, Al and FeSi are added as the main reductants. Therefore, SiO2 and silica along with alumina inclusions can be found in this alloy. The production process of FeMo alloys should be optimized to remove or decrease these SiO2 inclusions. Thus, the possible behavior of SiO2 inclusions in steels after the addition of FeMo alloys are discussed in detail in Section 3.4.
MoO x and Mo–Fe–O inclusions are other common inclusion types observed in FeMo alloys of the given study, which have not been reported before. Also, MoO x inclusions were not found in FeMo alloys in Pande's study after the dissolution of FeMo sample using a strong acid.[ 1 ] They might be dissolved in acid solution, indicating that the acid extraction method might not suitable for the investigation of these MoO x inclusions. It is well known that Mo has a smaller affinity toward oxygen. Therefore, MoO x inclusions from added FeMo alloy will be reduced by the other stronger deoxidizers (e.g., Al, Ti, and Si) in steel melt. Anyway, they can be a source of additional oxygen content in the liquid steel and contribute to the formation of new oxide inclusions.
3.1.3 FeW Alloys
Ferrotungsten (FeW) is one of the heaviest commercial alloys (15 500 kg m−3). Also they have a high melting temperature (≈2700 °C).[ 18 ] They are widely used in high-speed, tool steels as well as many hard metal alloys due to their tendency to form extremely hard carbides.[ 18 ]
The photos, size ranges, compositions, percentages, and number densities of the typical inclusions observed after EE of FeW samples are shown in Table 4 . As can be seen, the majority of inclusions are type A irregular (Mn,Fe)S inclusions (44%), which have the largest number density compared with the other types of inclusions. This is followed by type B MnS inclusions, which have approximately half number density (Nv = 5443 incl. mm−3) compared with (Mn,Fe)S inclusions (Nv = 9979 incl. mm−3). Type C inclusions are single globular or clustered SiO2 inclusions. They have the largest size ranges (4–50 μm) among all the inclusion types. The elemental mappings of typical SiO2 inclusion are shown in Figure 2a. Moreover, type D inclusions consist of SiO2 and (Mn,Fe)S. As can be seen from the elemental mappings in Figure 2b, Si and O located in the center, and Mn, Fe, and S are located in the outer layer. The average composition of the outer layer is 68% MnS–32% FeS, which has a melting point of ≈1216 °C. Considering that pure SiO2 (1726 °C[ 23 ]) has a higher melting point than the surrounding (Mn,Fe)S compound, it is suggested that the presence of type D inclusions might be explained by the fact that (Mn,Fe)S inclusions precipitate on pure SiO2 inclusions at lower temperatures. In addition, heterogeneous nucleations are more likely to occur for smaller SiO2 cores.
| Type | Type A | Type B | Type C | Type D |
|---|---|---|---|---|
| Typical photo |
|
|
|
|
| L, μm | 3–33 | 4–13 | 4–51 | 4–26 |
| dv, μm | 8 ± 3 (3–23) | 7 ± 2 (4–13) | 19 ± 14 (4–50) | 8 ± 3 (4–18) |
| Percentage, n% | 44 | 24 | 18 | 14 |
| Composition, wt% | ≈100% (Mn,Fe)S | ≈100% MnS | ≈100% SiO2 | SiO2 + (Mn, Fe)S |
| Nv, incl. mm−3 | 9979 | 5443 | 4082 | 3175 |

In summary, FeW alloys contain MnS, (Mn,Fe)S, SiO2 inclusions as well as a combination of them. Thermodynamically, tungsten has a low affinity to oxygen and its oxides can easily be reduced by silicon, carbon, and aluminum. Based on the inclusion results, the investigated FeW sample is more likely to be produced by the carbon and silicon reduction method. Tungsten minerals could be roughly divided into two classes depending on the leading mineral: wolframite ((Fe, Mn)WO4) and scheelite (CaWO4), which contain about 60–65% WO3.[ 24 ] During the production process, Si and C are added in the form of FeSi and coke, which results in a reduction of WO3 to tungsten. Therefore, this also determines the amount and distribution of SiO2 impurities in the alloy, which is similar to the case of FeMo alloys. However, the minerals contain significant amounts of S and MnO2, which can result in the formation of MnS and (Mn,Fe)S inclusions during solidification. It is known that MnS and (Mn,Fe)S inclusions will decompose at steelmaking temperatures, which can lead to the formation of new inclusions during the solidification of steel.
3.1.4 MnN and FeCrN Alloys
Nitrogen has attracted much attention due to certain beneficial effects resulting from its interaction with the present alloying elements in many steel grades.[ 25-27 ] Usually, in the production of steels with high N contents, the introduction of nitrogen is carried out by the addition of N-containing ferroalloys.
The characteristics of some typical inclusions in MnN and FeCrN alloys are shown in Table 5 . In MnN alloys, the majority of inclusions (≈61%) are pure MnO (type A), which have a very large number density (Nv = 101 504 incl. mm−3). It should be noted that this number was underestimated as a lot of small inclusions less than 1 μm were not considered. The following type B inclusions are Mn–Si–Mg–O inclusions (17%). The third type of inclusions are irregular manganese oxides containing a small amount of N (type C). They have the largest size ranges (4–26 μm) compared with other types of inclusions found in MnN alloys. The oxide inclusions account for above 90% of the total inclusion content as this alloy contains 3.33% of O (Table 1). Type D inclusions are Mn(S,Se) inclusions, in which the Se contents in these inclusions are about 5–9%. This can be explained by the fact that Se is contained in the raw electrolytic Mn, as SeO2 is commonly used as an additive during the electrolytic–manganese process.[ 28, 29 ]
| MnN | ||||
|---|---|---|---|---|
| Type | Type A | Type B | Type C | Type D |
| Typical photo |
|
|
|
|
| L, μm | 1–16 | 2–27 | 4–39 | 2–14 |
| dv, μm | 5 ± 2 (1–15) | 5 ± 2 (2–15) | 10 ± 6 (4–26) | 6 ± 3 (2–13) |
| Percentage, n% | 61 | 17 | 14 | 8 |
| Composition, wt% | ≈100% MnO | 55–74% MnO, 22–34% SiO2, 3–9% MgO | ≈100% Mn(O,N) | ≈100% Mn(S,Se) |
| Nv, incl. mm−3 | 101 504 | 29 280 | 23 424 | 11 712 |
| FeCrN | ||||
| Type | Type A | Type B | Type C | Type D |
| Typical photo |

|
|
|
|
| L, μm | 7–51 | 4–35 | 3–32 | 6–41 |
| dv, μm | 29 ± 8 (6–41) | 25 ± 5 (4–28) | 21 ± 3 (4–26) | 22 ± 9 (5–37) |
| Percentage, n% | 38 | 31 | 21 | 10 |
| Composition, wt% | ≈100% Cr2O3 |
44–50% SiO2, 36–39% CaO, 7–10% Cr2O3, 5–8 Al2O3 |
≈100% Al2O3 | 66–72% SiO2, 22–26% Al2O3, 6–10% MgO |
| Nv, incl. mm−3 | 16 565 | 13 513 | 9154 | 4359 |
In terms of FeCrN alloys, the most common inclusion type (≈38%) is irregular or clustered Cr2O3 inclusions. They have the largest size ranges (6–41 μm) and number densities (Nv = 16 565 incl. mm−3). It is known that chromium has a much lower affinity to O than the stronger deoxidizing elements Al or Si. Therefore, the Cr2O3 inclusions are easily reduced by Al, Si, and other deoxidizers in the liquid steel. Therefore, they can be a source of the formation of new oxide inclusions. This is followed by type B Si–Ca–Cr–Al–O complex oxide inclusions (31% and type C pure Al2O3 inclusions (21%). Finally, the other silica-containing inclusions are complex Si–Al–Mg–O inclusions (type D) having the second largest size ranges (5–37 μm).
MnN alloys are generally produced using a gas–solid metal reaction, which is controlled by the solid-state diffusion of nitrogen in electrolytic manganese in the temperature range of 800–1000 °C. The nitrogen pickup in the nitriding process is dependent on the temperature, activity coefficient of nitrogen and partial pressure of nitrogen.[ 30 ] Moreover, nitriding of FeCrN alloy is a solid-phase process by forced introduction of a flow of N2 (pressures of 2–10 MPa) through FeCr alloys during the combustion temperature of 900–1400 °C.[ 31 ] Therefore, the presence of nitrogen in the alloys is mainly in the form of Mn2N and Mn4N in MnN alloys and CrN, Cr2N, (CrFe)2 N, and Fe in various proportions in FeCrN alloys depending on the nitrogen contents in the alloys. Except for the nitride-containing matrix phase, the main inclusion types are oxides of the main elements (MnO and Cr2O3), which result in high O contents (>2%). Their additions can cause the formation of additional inclusions in steel. Therefore, the relatively high oxygen contents need to be avoided during the production of these alloys.
3.2 Microstructural Features of Different Ferroalloys
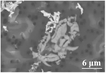
Microstructure analysis of the different ferroalloy samples was carried out to investigate the ferroalloy matrix phases, how the inclusions are bonded in the matrix as well as the distribution of impurity elements, as shown in Figure 3 . It should be pointed out that the different phases were roughly determined based only on the results obtained by the energy-dispersive spectroscopy (EDS) analysis.

In FeTi-1 alloy (Figure 3a), two major distinguishable FeTi phases were observed, namely a light one consisting of lower Ti contents (≈65.6%) and a gray one consisting of higher Ti contents (≈80.1%). In addition, dark phases consisting of high Ti contents as well as small amounts of C and N, which show a good agreement with the results for the extracted type B inclusions found in this alloy. In FeTi-2 alloy (Figure 3b), relatively large-sized dark phases containing Ti and C, N elements were observed. Light FeTi phases contain up to 8.6% of Al. Moreover, cluster-like phases consisting of Ti, Al, and O contents distributed in the FeTi phases, which might correspond to the Ti–Al intermetallic phase in FeTi-2 alloy. The obvious difference between these two alloys is that phases containing Al were only detected in FeTi-2 alloy. This can be related to the higher Al contents in FeTi-2 alloy (3.3%) compared with that in FeTi-1 alloy (0.44%). Even though the presence of Al is not in the form of Al2O3 or Al2O3-TiO x inclusions, which have been reported previously,[ 1, 6 ] the addition of FeTi alloy can possibly increase the Al content in the molten steel and result in the formation of new Al2O3-based inclusions. It should be pointed out that TiO x inclusions were not observed on polished surfaces, which might be due to their similar contrast to the matrix phases. It indicated that the 2D method is not preferable to use for this alloy.
FeMo alloys were found to have very similar microstructures, where three different phases were observed (Figure 3c–e). They are almost pure Mo phases containing small amounts of Fe, two FeMo phases with relatively higher Mo contents (65.8–70.2% Mo) and lower contents (48.6–54.9% Mo). The difference between FeMo-3 and FeMo-1, FeMo-2 alloys is that the characteristics of the bonded inclusions. Pure SiO2 inclusions were commonly found in FeMo-1 and FeMo-2 alloys, whereas large-sized high silica inclusions containing about 14% Al2O3 were present in FeMo-3 alloys. The compositions of these inclusions are also in good agreement with those extracted inclusions found in FeMo alloys.
The microstructure of FeW alloys reveals that three phases can be found (Figure 3f), which can be divided into one pure W phase and two W-containing phases. Specifically, a light phase consisting of high W contents (≈68.4%) and a dark phase consisting of low W contents (≈15.8%). According to the Fe–W phase diagram,[ 18 ] W stabilizes the body centered cubic (bcc) Fe, which might dissolve up to 34% W at subsolidus temperatures. Large-sized SiO2 inclusions are the common particles found in this alloy, complex SiO2-(Mn,Fe)S inclusions also exist but they are not listed here.
The microstructure of MnN and FeCrN are shown in Figure 3g,h, respectively. The apparent densities of these ferroalloys are very low (3000–4200 kg m−3) due to their high porosities,[ 32 ] which are well recognized by their microstructures as they are quite fragile and porous in nature. In MnN alloys, they consist of one pure Mn phase containing some amount of N and another FeMn phase. In addition, MnO and MnO–SiO2 inclusions were commonly observed in these alloys. Similarly, the FeCrN alloy also contains two phases, a dark phase consisting of almost pure Cr and some amount of N and a gray FeCr phase with about 75% Cr. Moreover, it was found that some Cr2O3 and Si–Ca–Cr–Al–O inclusions were combined together (as a cluster) in the matrix, it was difficult to measure their accurate sizes.
Based on the aforementioned discussions, some inclusions cannot be seen and some inclusions are difficult to analyze on polished ferroalloy surfaces. Therefore, it can be concluded that the investigations of inclusions on polished ferroalloy samples cannot give a clear and comprehensive information of the inclusions in some specific ferroalloys.
3.3 Inclusions on the Metal Surfaces of Different Ferroalloys after EE
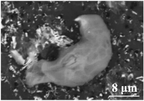
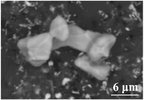
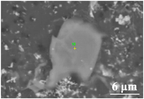
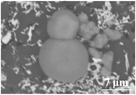
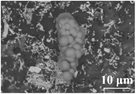
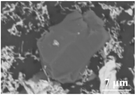
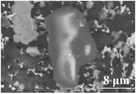
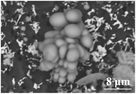
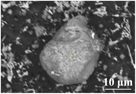
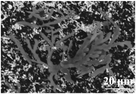
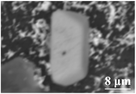
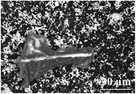
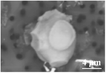
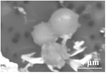
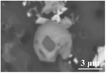
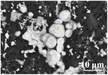
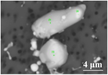
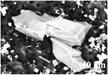
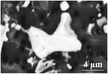
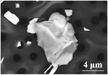
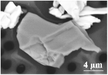
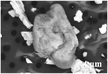
It has been reported in a previous paper[ 9 ] that investigations on metal surface after EE was found to be more advantageous in detecting large-sized inclusions. Therefore, the metal surfaces of different ferroalloy samples after extraction (EE-MS method) were investigated. The morphologies and locations of some typical inclusions observed in different ferroalloys are shown in Figure 4 .

It should be pointed out that the investigations of inclusions only focused on the easily recognized and relatively large-sized inclusions. As can be seen, TiO x were the common inclusions found on the metal surface for FeTi alloys. Moreover, the sizes of TiO x inclusions were significantly larger in FeTi-1 alloys than those found in FeTi-2 alloys, which also in agreement with the results of the extracted inclusions. In FeMo alloys, the inclusions found on the metal surfaces were SiO2 in FeMo-1 and FeMo-2 alloys and silica inclusions containing a small amount of Al2O3 in FeMo-3 alloys. These results are similar to those inclusions found on polished surfaces. In FeW alloys, big size SiO2 inclusions could easily be observed. When it comes to MnN alloys, a large number of small size MnO inclusions were found on the metal surface. However, no obvious big size inclusions were observed. In FeCrN alloys, Cr2O3 inclusions were easily found based on their different contrast to the matrix.
To compare the size ranges of main typical inclusions in different ferroalloys observed on the film filter and the metal surface after extraction, more than 100 inclusions were measured in each ferroalloy sample and the obtained results of the average inclusion size with standard deviations (as error bars) are shown in Figure 5 . It is obvious that the sizes of inclusions observed on the metal surfaces are significantly larger than those found on the film filters. The largest differences in average inclusion sizes were found for FeMo-3 and FeW alloys. More specifically, the largest length of the inclusions observed on metal surfaces in FeMo-3 and FeW alloys are 1755 and 1634 μm, whereas those found on the film filters are 100 and 51 μm, respectively. This might be because the dissolved depth of ferroalloy samples during EE was smaller than the large size of the present NMIs. As a result, they cannot be fully extracted from the matrix and cannot be observed on a film filter. Also, the orientation and location of the inclusions have some effect. Nevertheless, if we want to find larger size inclusions, the metal surface after extraction should also be investigated. Furthermore, this method is more preferable for the investigation of inclusions in ferroalloys than steels due to the fact that the inclusions in ferroalloys are usually much larger than those found in steel.

3.4 Evaluation of the Influence of Ferroalloy Impurities on Steel Cleanliness
Impurities in ferroalloys include nitrogen, oxygen, sulfur, trace elements, and inclusions, which all can impair the quality of steel. Except for the N-containing ferroalloys, the nitrogen content in the other ferroalloys should be considered specifically in the production of the extra-low nitrogen steels. Figure 6 shows the average oxygen contents in different ferroalloys. The total oxygen contents are thousands of ppm in these samples, and the highest value reaches 33 000 ppm (3.3%). Thus, it is certain that the addition of ferroalloys can contribute to the increase in the total oxygen content of steel, which might result in the formation of new inclusions. Specifically, if we assume that the added ferroalloy is 1 kg ton−1 in steel and the O content reaches 1% in the ferroalloy, then it can result in the contribution of 10 ppm O in the steel. Such an increase in O content in steel can cause the formation of a large amount of new inclusions. However, this effect can be minimized by changing their addition time and sequence, such as FeMo are usually added in an earlier stage. Some high-purity ferroalloy can be used for trimming additions. To get a high-purity grade ferroalloy, a high O content should be avoided during the production of ferroalloys by additional refining process. It should also be noted that the sulfur contents in all the investigated ferroalloys are less than 700 ppm. However, the additional amount of S from ferroalloy can significantly affect the final sulfur content in steel, especially in the production of clean steels with extra-low sulfur content.

Except for the elemental impurities, the behaviors of the large-sized inclusions from these ferroalloys in molten steel are important to the steel cleanliness. First of all, they can float up depending on their densities and are absorbed by slag, whereas some inclusions which are smaller than the critical diameters will stay in the steel. Moreover, it is quite unlikely for inclusions from ferroalloys to remain unchanged during the alloying process. As elements such as Ti, Si, Mn, and Cr have a smaller affinity to oxygen than Al, they can easily be reduced by dissolved Al in the steel melt. The reduction processes are explained based on the thermodynamic calculations using FactSage 7.2 with the FToxide, FactPS, and FSstel databases. The simplified calculations were carried out for a 100 g Fe containing varying contents of Al (0–0.5%) and 1% Ti2O3, SiO2, MnO, and Cr2O3 inclusions at 1600 °C, and the results are shown in Figure 7 . However, it should be noticed that these calculations were simplified cases where other elements in steel were ignored. The obtained calculation results showed only a tendency of the reduction process between different oxides and dissolved Al. Real steel grades and the proper range of ferroalloy additions should be studied in future.

As shown in Figure 7a, the amount of Ti2O3 inclusions sharply decreases when TiO x –Al2O3 liquid inclusions are formed and then the amount of TiO x –Al2O3 inclusions increases with an increased Al content. When the Al content reaches 0.2%, pure Al2O3 inclusions start to form and the amount of liquid oxide inclusions decreases. With the increase in Al content in the molten steel, the modification route of SiO2 inclusions is almost identical to SiO2→liquid oxide (SiO2–Al2O3–FeO)→mullite (Al2O3–SiO2)→corundum (Al2O3). It can be seen that the Si in liquid Fe increases with the Al content (Figure 7b). Moreover, the Al2O3 content in liquid inclusions increases with an increased Al content. Similarly, MnO inclusions would be reduced by Al to form liquid MnO–Al2O3–FeO inclusions. Then, the amount of liquid inclusions decreases, whereas MnAl2O4 spinel inclusions start to form. Pure Al2O3 inclusions can form at a higher Al content (Figure 7c). Moreover, the Cr2O3 inclusions are found to be present as (Al, Fe)Cr2O4 spinel inclusions at the beginning and they gradually decrease first. After the Al content in molten steel is larger than 0.1%, corundum (Al2O3, Cr2O3) inclusions are formed and increase with the increase in Al content (Figure 7d). Therefore, these inclusions can be partially or completely reduced in Al-killed steels, which can result in new Al2O3 based inclusions in steel. It should be noted that during real steelmaking conditions, inclusions containing FeO are hardly to be observed, so the reduced inclusions might be different from these calculation results. Depending on the specific steelmaking conditions, more complex reactions can happen. Therefore, controlled alloying experiments are needed for each ferroalloy grade, which will be carried out in a further study.
4 Conclusions
The impurity elements (O, S, and so on) and inclusion characteristics present in different ferroalloys were analyzed. The information obtained in this study can provide a more detailed knowledge of the ferroalloy quality than what has been available. According to the results obtained in this study, the following specific conclusions were obtained: 1) The existing inclusions in different ferroalloys were closely related to their manufacturing route, in which the main inclusions were more likely the oxidization products of the reductant and some unreduced ore during the production process, such as SiO2 inclusions in FeMo and FeW alloys and TiO x inclusions in FeTi alloys, and MoO x inclusions in FeMo alloys. 2) The inclusions bonded in the matrix as well as the main phases in different ferroalloys were studied based on the traditional 2D method on polished surfaces of metal samples. However, this method cannot always be applied for precise investigations of inclusions in some specific ferroalloys. In this case, 3D investigations of NMIs after EE of ferroalloy samples are more preferable compared with the 2D method. Moreover, the investigations of inclusions on metal surfaces after extraction show a big advantage in detecting larger-sized inclusions. Specifically, the largest length of SiO2 inclusions found on a metal surface of FeMo and FeW alloys reached 1755 and 1634 μm, respectively, whereas those found on film filters were not larger than 100 μm. 3) The Ti2O3 from FeTi alloys, SiO2 from FeMo and FeW alloys, MnO from MnN alloys, and Cr2O3 from FeCrN alloys can be partially or completed reduced in Al-killed steel depending on the dissolved Al contents in the steel melt. This, in turn, can result in the formation of new Al2O3-based inclusions in the steel based on thermodynamic calculations.
Acknowledgements
Yong Wang acknowledges the financial support from the China Scholarship Council (CSC).
Conflict of Interest
The authors declare no conflict of interest.
Open Research
Research data are not shared.