Microstructural Analysis of the Recrystallization Behavior of Low Alloyed Steels
Abstract
The recrystallization behavior of five low alloyed steels is investigated using double hit deformation tests. It is shown, that Niobium has the biggest influence in retarding the recrystallization kinetics. Further, the microstructural evolution dependent on strain and temperature during deformation is studied with a picric acid etchant and light-optical analysis. It is shown how the microstructure of two differently alloyed ultra-high strength steels changes along with the peculiarities of the corresponding stress–strain curves including the evolution of grain size and aspect ratio of the prior austenite grain. The findings on the different recrystallization kinetics with the role of recrystallization retarding elements are further reinforced by investigations on the Zener-Hollomon parameter and the activation energy needed for dynamic recrystallization. A rolling scenario on a deformation dilatometer is simulated on a hardenable and a micro-alloyed steel to illustrate the microstructural evolution between the rolling steps. It is shown, how the two ultra-high strength steels perform different in their microstructural evolution, as the waiving of micro-alloying elements (MAE) provides finer austenite grains.
1 Introduction
For decades micro-alloying is an attractive procedure in industrial steel production to provide high strength steel grades through an economic production route.1 In a systematic combination of alloying and rolling, the recrystallization processes can be tuned to generate a fine grained microstructure with high strength and good ductility.2 Nb, V, and Ti serve herein as MAE with the strongest impact on the microstructure. Both in solute as in undissolved condition they are proficient to retard the recrystallization through their high solute drag and stable precipitates (Nb and Ti)3-7 or stimulate the recrystallization in the austenite region (V) promoting fine grains and low rolling forces.8, 9 Their usage allows to noticeably improve the properties of structural steels and enables the production of ultra-high strength steel (UHSS) grades. For the latter, transformation retarding elements such as Mn or B are also used to reduce the critical cooling rate.3, 10-12 Besides, its effect as solid solution strengthener, in the case of Mn,13 they both provide no prominent contribution to recrystallization, but retard the austenite to ferrite and pearlite transformation and therefore enable a bainitic or martensitic microstructure.
The application of the mentioned alloying elements mainly covers the spectrum from mild to ultra-high-strength steels with their ability to modify the microstructure in controlling the grain size and the γ–α transformation. Their influence on the static (SRX), metadynamic (MDRX), and dynamic (DRX) recrystallization processes determined by means of double-hit deformation tests is broadly investigated.4, 14-17 There have also been reports of corresponding influences on the DRX and MRX in numerous publications.16, 18-23 Furthermore, several models exist to quantify these mechanisms mathematically, which make these microstructural phenomena, that is, the onset of the DRX and even further recrystallization-influencing factors, such as the formation of strain induced precipitations predictable.18, 23-26 Nevertheless, on the one hand, there is no clear delimitation in the recrystallization behavior of mild and hardenable steels with respect to the alloying elements influencing the γ to α transformation. And, therefore, a sequenced analysis of microstructure evolution in a series of deformations is worth investigating. For example, in the case of a rolling process, the involved mechanisms coincide and often cannot be distinguished clearly from each other, which limits the precision of these models.
Thus, the goal of this study is the comparison of the recrystallization behavior of mild steels and hardenable steels during hot deformation. Furthermore, the present work shall solve the challenge to display the underlying microstructural processes both, in laboratory scale deformations and metallographic analysis. The motivation is to support the development of UHS steel grades with revealing the microstructural evolution.
This is done by a clear representation of the microstructural evolution of two selected steel grades through a combination of several small scale deformations with a subsequent metallographic examination. The results on the microstructural development, dependent on the imposed deformation, will be complemented by an empirical investigation of the initiation of DRX.
It is experienced, that microstructural processes in a hot rolling mill are not only based on straightforward predictable static and dynamic recrystallization sequences. Moreover, they are subject of complex combinations of both, recovery and suspended recrystallization such as MDRX. The metadynamic recrystallization, also known as postdynamic recrystallization, belongs to the static restoration processes following a preceded deformation. Metadynamic recrystallization is initiated from a partially or steadily recrystallized microstructure by DRX after straining over the critical strain.21, 22, 27 In order to study the microstructural development during hot rolling of a TM-steel, we reproduce a laboratory scale deformation corresponding to the real rolling process.
2 Experimental Section
2.1 Steels Investigated
To investigate the influence of different alloying elements in combination with different process parameters on the microstructural evolution, five different low carbon steels were analyzed. For the sake of simplicity, the steels were numbered consecutively and their chemical compositions are listed in Table 1. Steels 1–3 are mild steels with carbon contents of 0.15%. Steel 2 is alloyed with 1.20% Cr. Steel 3 contains 0.012% Nb. Steels 4 and 5 represent hardenable steels with an elevated amount of Mn. Steel 4 was dispensed with alloying elements which influence hardenability and tempering resistance (Cr, Ni, Mo, Cu) or recrystallization behavior (V, Ti, Nb).3, 27, 28 Steel 5 completes the list with the highest addition of MAE, modified for a TM treatment and meeting the requirements for high strength structural applications. With the ulterior motive of maintaining strength and increasing ductility, steel 5 is therefore alloyed with elements improving the post tempering condition such as Cr, Ni, Mo, and additionally Cu. A good weldability is given29-31 and the relatively high amount of C of 0.17% combined with 2.3% of manganese enables a product with full martensitic strength.
| Steel | Description | C | Mn | Cr | Ni | Mo | Cu | V | Ti | Nb | B |
|---|---|---|---|---|---|---|---|---|---|---|---|
| 1 | Mild steel | 0.15 | 1.1 | 0.02 | <0.01 | 0.01 | 0.01 | <0.01 | <0.01 | <0.01 | <0.001 |
| 2 | Mild steel + Cr | 0.15 | 1.2 | 1.20 | <0.01 | 0.01 | 0.01 | <0.01 | <0.01 | <0.01 | <0.001 |
| 3 | Mild steel + Nb | 0.15 | 1.1 | 0.02 | <0.01 | 0.01 | 0.03 | <0.01 | <0.01 | 0.01 | <0.001 |
| 4 | Hardenable steel | 0.17 | 2.3 | 0.30 | <0.01 | 0.01 | 0.08 | <0.01 | 0.02 | <0.01 | 0.002 |
| 5 | Hardenable steel + MAE | 0.17 | 1.4 | 0.70 | 1.0 | 0.50 | 0.45 | 0.05 | 0.02 | 0.04 | <0.001 |
For the deformation experiments, dilatometer samples were manufactured from industrially available material via wire-eroding with dimensions of 10 mm length and a diameter of 5 mm. In the following, tungsten platelets were utilized in order to reduce the thermal flow between the sample and the deformation stamp and a “type S” thermocouple was mounted on the sample to determine the sample temperature during deformation.
2.2 Sample Preparation and Determination of the PAG
The preparation of the samples is identical for all following analysis procedures. The specimens were hot embedded and then ground from 320 grit to 4000 grit SiC paper for at least 30 s. Subsequently, the samples were polished with 3 µm diamond paste for at least 3 min and with 1 µm for 30 s. For the metallographic investigation, a picric acid etchant was used to reveal the PAGs after direct quenching. A specially developed etching process was applied, which is described in detail elsewhere,32 based on the picric acid presented by Bechet-Beaujard in 1955.33 The etchant was modified by sodium dodecyl sulfate as wetting agent and performed at room temperature. Yet, selected samples were treated in a heated etching solution at 70 °C to enhance the emerge of the PAGs. For the evaluation of the grain sizes, the image analysis software “Olympus Stream” was used to determine the equivalent grain diameter. The width to height ratio of the grain was used to calculate the aspect ratio. The detailed description of the method can be found in ref. 32
2.3 Dilatometer Experiments and Characterization of the Recrystallization Behavior
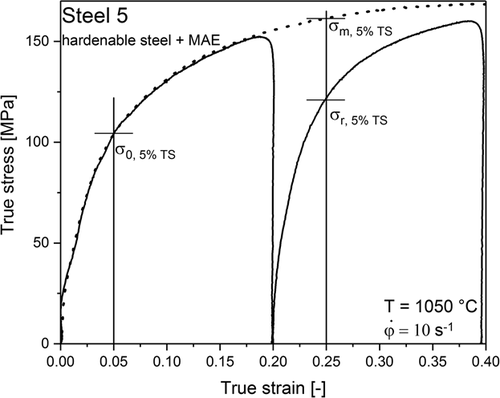
If the calculated softening is plotted against ti for a selected temperature, the Johnson-Mehl-Avrami fit can be applied to model the recrystallization kinetics. Palmiere et al. stated, that 20% of the FS can be attributed to recovery.25, 37, 38 Consequently, softening above 20% is related to SRX. Nevertheless, the present work will continue the convention using the term fractional softening in analogy with restriction to the recrystallized fraction,17, 18 as this fact plays a decisive role sequencing different steels concerning their recrystallization behavior. An absolute confidence about the recrystallized fraction only is gained with a corresponding metallographic analysis. Nevertheless, the effort to analyze each individual sample would exceed the benefits by far and bring the methodology to analyze the SRX behavior via flow stress curves in question.
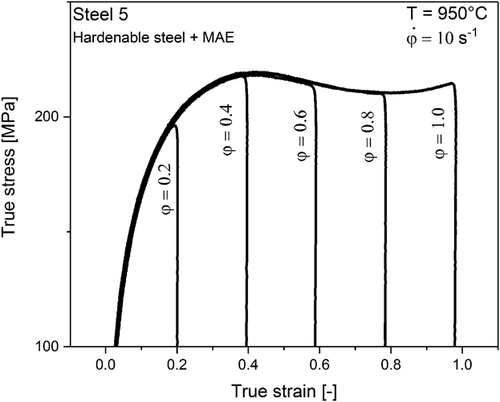
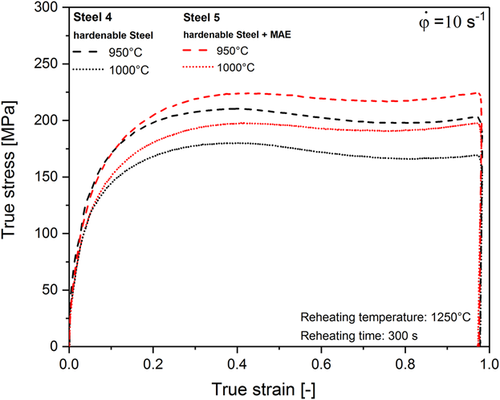
In a set of experiments, the combination of both, deformation and subsequent metallographic analysis was realized. The scientific issue is, how accurately characteristic elements such as a decline of a stress–strain curve, which is associated with a DRX as can be seen in Figure 2, can be visualized in the microstructure. The sequence of deformation chosen for this study can be reconstructed by the flow stress curve displayed in Figure 2 with an overall deformation of φ = 1.0. These flow stress curves of steel 4 and 5 were split in deformations of φ = 0.2, 0.4, 0.6, and 0.8 in order to study the microstructural evolution at these stages of deformation. After the samples were subjected to solution annealing of 5 min at 1250 °C they were cooled to deformation temperatures of 950 and 1000 °C, respectively. After deformation, the samples were immediately quenched in order to preserve the austenite grain condition.
The deformation procedure of the two selected steels (steel 4 and steel 5) involved solution annealing at 1250°C and subsequent forming at 850, 900, 950, and 1000 °C, respectively, at four different strain rates φ̇ = 0.01, 0.1, 1.0, and 10.
The calculated activation energy is used to demonstrate the influence of alloying elements on the underlying microstructural processes such as grain refinement.
In order to study the microstructural development during hot rolling of a TM-steel, a hypothetical milling process was chosen according to Table 2 to investigate the austenite grain condition between the different rolling steps. The deformation degree decreases during rolling as the deformation resistance increases with declining temperature. The time between the rolling passes decreases as the hot strip extends in length which consequently leads to an enhancing deformation rate. Due to limitations of the deformation dilatometer, the deformation rate was kept constant at φ̇ = 10. Although, recrystallization processes are dependent on the deformation rate, the corresponding influence was classified as marginal and thus neglected in this study. After the corresponding deformation, the samples were immediately quenched in order to preserve the austenitic grain structure and adjust the martensitic grain structure intended for these steels. Due to the fact that in a milling process with subsequent quenching, the impact of water occurs delayed, after the last deformation step a holding time of 3 s was realized.
| Deformation step/parameter | 1 | 2 | 3 | 4 | 5 |
|---|---|---|---|---|---|
| φ [−] | 0.25 | 0.25 | 0.15 | 0.15 | 0.1 |
| φ̇ [s–s] | 10 | 10 | 10 | 10 | 10 |
| T [°C] | 1000 | 950 | 925 | 900 | 875 |
| T [s] | 2.5 | 2 | 1.5 | 1.5 | (3) |
3 Results
3.1 Static Recrystallization Behavior and Softening
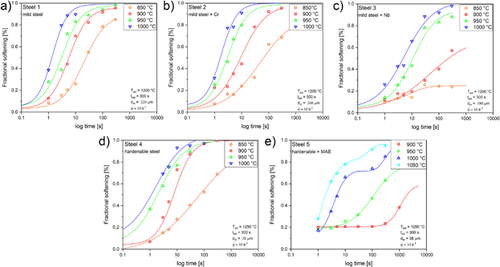
The fractional softening of steel 1–5 was analyzed using the 5% true strain method described in the previous chapter. The FS of steel 1–4 was studied at 850–1000 °C, whereas steel 5 was evaluated at 900–1050 °C due to the fact that its micro-alloying and its resulting retarded recrystallization made an investigation below 900 °C not conductive. The double-hit experiments for the five different steels investigated showed the softening behavior displayed in Figure 3a–e. Steel 1 (Figure 3a) shows a clearly defined softening/static recrystallization behavior. Even at relatively low temperatures of 850 °C softening starts within seconds. Steel 2 (Figure 3b) behaves similar, however the recrystallization at 850 °C seems slower. Figure 3c illustrates the significant influence of Nb on the softening behavior of steel 3. Already the 50%-softening at 950 and 1000 °C is shifted by a factor of 10. At 900 °C the recrystallization is already slowed down so much, that especially in a hot strip mill with interpass times of a few seconds full static recrystallization does not occur. At 850 °C, recrystallization processes are suppressed so far, that a probable softening rather can be attributed to recovery. Figure 3d displays the softening of steel 4, with an interesting fit of the recrystallization behavior. The elevated Mn content possesses no influence on the softening, when compared to the mild steels. Although these differences are not significant, it seems that above 900 °C the softening proceeds even faster than in mild steels, whereas at 850 °C it is clearly reduced. For steel 5 (Figure 3e) an examination at 850 °C was omitted since the recrystallization at 900 °C was already reduced immensely, that below this temperature softening processes are not expected. The softening distribution of steels 5 exhibits plateaus between temperatures of 1000 and 1050 °C.
3.2 Dynamic Recrystallization and Corresponding Grain Size Analysis
The true stress–strain curves reveal material specific peculiarities, which can be indicative for a softening due to recovery or recrystallization. Steels 4 and 5 are classified as ultra-high strength steels, but are – due to varying applications – differently alloyed. In order to study their different recrystallization, in particular DRX, the microstructure of steel 4 and 5 was investigated following the deformation procedure described in section 2.3. Figure 4 displays the flow stress curve of steel 4 (black curves) and steel 5 (red curves) at a temperature of 950 °C (dashed line) and 1000 °C (dotted line), respectively. The peaks, which are supposed to be an indication for the beginning of DRX are slightly shifted; the peak of Steel 4 is located at a strain of φ < 0.4 at 1000 °C, whereas the onset of the DRX at 950 °C of steel 4 is shifted toward a higher strain φ > 0.4. Moreover, steel 4 responds both at 950 and 1000 °C with a more pronounced decline of the stress curve on the applied deformation than steel 5, which can be explained by a more significant softening due to DRX processes.
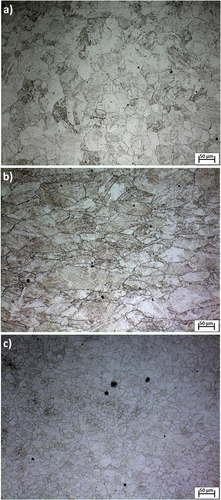
The light-optical images (Figure 5a–c) demonstrate the microstructural evolution of steel 5 with respect to the imposed deformation according to Figure 2. The mean grain size after solution annealing of 5 min at 1250 °C was 38 μm. With increasing deformation, the austenite grain elongates perpendicular to the axis of compression. At the peak of the flow stress curve (φ = 0.4), the corresponding microstructure reveals zones of recrystallized grains. The grain size analysis (Figure 6) confirms this fact as the grain size distribution is shifted to smaller grain sizes. According to both light – optical analysis and the subsequent grain size investigation, full recrystallization of the austenite grain is reached at φ = 0.8, where the flow stress curve reaches a saturation level.

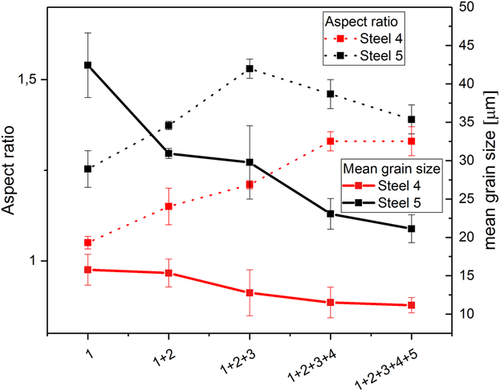
The different recrystallization behavior of steel 4 and 5 moreover is reflected by the evolution of the PAG aspect ratio displayed in Figure 7 for two different temperatures, 950 and 1000 °C. With increasing deformation, the aspect ratio rises for both, steel 4 and 5. However, steel 4 possesses a very globular grain throughout the whole deformation. The aspect ratio does not exceed values above 1.5, at φ = 0.4 it shows a maximum, and decreases to values of ≈1. This trend coincides with the progression of the flow stress curve (Figure 4). At 950 °C an aspect ratio of 1.17 remains, whereas at 1000 °C the aspect ratio is reduced to 1.06. Steel 5, however behaves different. At 950 °C, the aspect ratio develops to a maximum at φ = 0.8 and falls subsequently to a value of 1.98 at φ = 1.0. In contrast to the evolution at 950 °C, the development of the aspect ratio at 1000 °C shows only an increase till φ = 0.6. The recrystallization is obviously accelerated to lower deformations. The light-optical images (Figure 8a–d) reflect, that compared to steel 5, steel 4 reveals no increased pancaking toward higher deformations, even at high deformations the PAGs exhibit a globular shape. The corresponding grain sizes at a deformation of φ = 0.2 are measured with 24 μm at 950 °C (Figure 8a) and 10 μm at 1000 °C (Figure 8c). The mean grain sizes decrease at both temperatures with increasing deformation of φ = 0.8 down to 7 μm (950 °C – Figure 8b) and 10 μm (1000 °C – Figure 8d), respectively.

3.3 Calculation of the Activation Energy for the Initiation of DRX
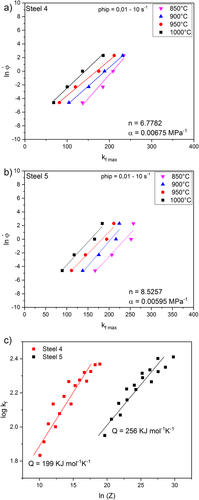
Figure 9 demonstrates the evaluation of the Zener-Hollomon parameter and the activation energy of steel 4 and 6. The determination is based on the evaluation of flow stress maxima kf max at four different temperatures between 850 and 1000 °C and strain rates of φ̇ = 0.01, 0.1, 1.0, and 10. Figure 9a provides the relationship between kf max and φ̇ for steel 4 at the different temperatures. The material specific constants were determined with n = 6.7782 and α = 0.00675 MPa−1. For steel 5, (Figure 9b) the constants are calculated as follows: n = 8.5257 and α = 0.00595 MPa−1. Figure 9c demonstrates the relationship between the flow stress kf as a function of the Zener-Hollomon parameter Z for both steels investigated. Following this approach, the values for Q were deduced which amounts Q = 199 KJ K−1 mol−1 for steel 4 and 256 KJ K−1 mol−1 for steel 5.
3.4 Grain Size Evolution during Rolling-Like t-T- φ Cycles
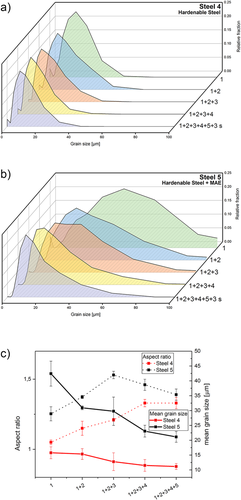
After deforming steel 4 and steel 5 following a hot rolling scheme (Table 2), the grain size distributions as depicted in Figure 10 were detected. The grain size range of steel 4 is spread over a limited area, whereas steel 5 possesses a wider size distribution. With increasing deformation, steel 4 in general develops smaller size partitions. The mean grain sizes of steel 5 trend to smaller fractions with increasing deformation as well, that means, large grains recrystallize in favor of smaller ones. Nevertheless, the mean grain sizes do not reach the magnitude of steel 4. Figure 10c provides an overview of the development of the microstructural characteristics. For both steels, the aspect ratio increases in general with growing deformation, whereas the mean grain sizes decrease.
4 Discussion
4.1 Static Recrystallization Behavior and Fractional Softening
Double-hit experiments provided an extended survey of the softening and thus the static recrystallization behavior of the investigated low-C steels. This analysis enables a sequencing of the steels investigated regarding their different alloying elements. Figure 11a–d demonstrate the softening of the different steels arranged parallel at the individual temperatures of 850–1000 °C. Mild steel 1 and 2 possess a continuous fast SRX behavior. Despite the content of transformation retarding elements present in steel 4, its SRX behavior matches the behavior of mild steels. The increased levels of both Si and Mn apparently do not affect the SRX, although Medina et al. have reported a minimal influence.41 Also, Ti seems not to affect SRX although Ti is known to possess high potential to elevate the TNR in retarding the recrystallization.7, 16 A major function of Ti however, is revealed in regarding the grain sizes after solution annealing. Whereas the variants which are dispensed with Ti show a high potential to grain growth at 1200 °C, in opposite, the Ti variants, steel 4 and 5 still reveal relatively small grain sizes despite a higher solution annealing temperature of 1250 °C.
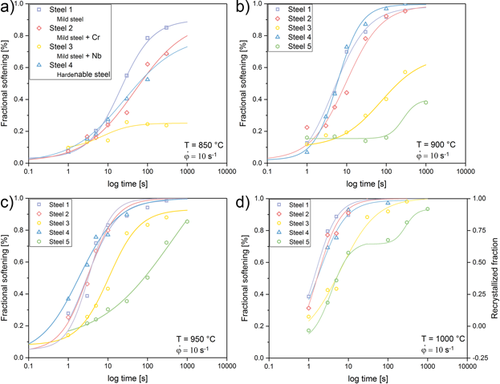
The effect of Nb on the SRX is more pronounced and thus clearly visible in the diagrams. A surcharge of 0.01% Nb in steel 3 results in a similar recrystallization behavior as this of the micro-alloyed hardenable variant, steel 5. Steel 5, furthermore forms plateaus at 1000 °C (Figure 11d) and 1050 °C (Figure 3f). This is an indication to the formation of strain induced precipitations, (VC and TiC), which delay the recrystallization. The amount of V however is very little (0.05%) and this phenomenon is not very pronounced at the other temperatures. Thus, is can be presumed that strain induced precipitations need to be attributed to NbC or TiC. For proofing this hypothesis, TEM investigation would be required.
4.2 Grain Size Analysis after Deformation and DRX Behavior
Steel 4 and 5 were imposed to different deformations in order to investigate the microstructural development during deformation. The first set of deformations was performed at a constant temperature, yet different degrees of deformation. The second set contained a laboratory scale rolling-like t-T- φ cycle. These investigations provided an interesting insight into the development of the microstructure. From the true stress curves (Figure 4) a maximum of the DRX at the peak point of φ ≈ 0.4 and a saturation region of the DRX at φ ≈ 0.8 can be expected. For both steels, the corresponding microstructure however showed differences in their progression at 950 and 1000 °C. It is evident, that the flow stress curve of both steels behave approximately congruent. The niveau of their corresponding flow stress curve is shifted upwards with descending temperature as the deformation resistance increases with decreasing temperature. Nevertheless, comparing the yield stress curves of the two steels, it is obvious, that they behave differently in their further progression as they possess a different recrystallization behavior due to their different alloy contents. At the individual temperatures, the gradient of the curves coincides for both temperatures which indicates, that both steels exhibit similar strength. However, the stress-inclination of steel 4 declines earlier as softening processes are in progress, whereas the stress level of steel 5 rises higher as the incorporated MAE prevent a preliminary softening. Besides this accelerated creasing of steel 4, the overall appearance of the similar flow stress curves could be taken to imply that the recrystallization processes between the steels behave similar. Although it is common to declare the onset of the DRX with the relatively easy-to-interpret peak value, literature agrees, that the start of the DRX at this point is already in progress.42, 43 More precisely is the inflection point of the flow stress curve to be classified as the onset of DRX.44, 45 Both steels first show a significant peak and then reach a saturation level, at 950° as well as at 1000 °C. However, the corresponding metallographic analysis demonstrates, that steel 4 which exhibits an initial grain size after annealing of 30 μm already recrystallizes to a grain size of 10 μm after deforming with φ = 0.2 at 1000 °C. Steel 5 though, which exhibits an initial grain size of 37 μm starts not before φ = 0.4 with small recrystallized spots. The elongated austenite grain and zones of smaller globular grains, whose presence are indicative for an active recrystallization, can be seen in Figure 8b. The shift of the peaks presents a clear change in the microstructure through ongoing microstructural processes. The PAGs of the sample deformed with φ = 0.8 at 1000 °C (Figure 8c) illustrate, that the microstructure is fully recrystallized at this state of deformation. The grain size distribution represents a limited area of existence far below the initial grain size. With increasing deformation (φ = 1.0) the grain partitions are yet recrystallized and thus smaller in size, but rise in their aspect ratio. The deformation at 950 °C delivered quite different findings concerning the microstructural processes. At φ = 0.4, some small grain fractions are recognizable, whose proportion increases constantly up to φ = 0.8. However, full DRX was not accomplished. The empirical determination of TNR with the Boratto equation11 delivers a value of 993 °C. This value would coincide with the softening curves (Figure 11c, d), as between 950 and 1000 °C a significant gap in the static recrystallization kinetics is visible. However, the determination of TNR with the Boratto equation needs to be accepted with reservation, as it does not include the effect of Mo. Mo is known to influence the TNR and retard the recrystallization significantly.46
In order to extend the observed feature to the DRX, the investigations demonstrate, that below 1000 °C a fully dynamic recrystallization only can be accomplished with very high deformations (>φ = 1.0). This fact again stands in conflict with the peculiarities of the flow stress curve, in which the saturation regime might lead to the assumption that a DRX is present.
As discussed, steel 4 responds with a significantly accelerated recrystallization due to the reduced micro-alloying elements. Already at φ = 0.2 a clear grain refining occurs, compared to the initial state. Since steel 4 demonstrated to be very receptive for recrystallization especially in the static softening (Figure 3d and 11a–d), the small deformation of φ = 0.2 in the immediate moment before quenching could have led to recrystallization. Nevertheless, differences in the microstructure are also evident, as the grains are much finer at 1000 °C then at 950 °C. With increasing deformations, the grain evolution behaves almost identical for both temperatures. At 950 °C the grain size (≈7 μm) decreases in favor of a consistent aspect ratio (1.25), while at 1000 °C a globular grain remains, marginally enlarged in size (≈10 μm). These findings confirm the prevailing DRX processes that result in complete recrystallization at both temperatures. At 1000 °C the temperature is high enough to activate the complete globularization of the grain with a tendency to grain enlargement, whereas at 950 °C the temperature is enough to initiate grain refinement, yet leaves a remaining aspect ratio.
The comparison of the microstructural evolution after both steels were subjected to a hypothetical rolling process, provided an insight into the different grain refinement behavior. Both steels show a clear grain-refinement tendency as a result of the successive deformation steps (Figure 10a–c). However, in the case of steel 5, recrystallization is not complete. During the first two deforming steps, the grain aspect ratio increases, whereas subsequent deformations steps result in a decrease of the grain aspect ratio and grain size. Only after this degree of deformation, it appears, that enough energy has been induced to initiate at least a partial recrystallization. Steel 4 obviously recrystallizes after each deformation step. After the third step the remaining aspect ratio is elevated and differs just weakly in value from steel 5. An inauguration of the microstructure after etching the PAGs with a picric-acid etchant indicate, that the aspect ratio of steel 4 is distributed over the whole aggregation of grains. The aspect ratio calculated for steel 5 is concentrated on several big grains, whereas the microstructure possesses areas of a high amount of globular recrystallized grains which possess an aspect ratio of 1. These grains compensate the high aspect ratio of the bigger grains.
5 Summary
- Double-hit deformation tests performed on a dilatometer showed the softening behavior of 3 mild and 2 hardenable steels with different alloying contents. A significant gap in the SRX behavior between the Nb or V alloyed and the plain carbon steels gap could be shown. Mn and Cr, which retard the γ to α transformation do not have any influence on the SRX behavior.
- Sequenced deformations were performed to reproduce the different microstructural stages of a flow stress curve metallographically. Is it shown, that characteristic peculiarities of a stress strain curve such as an evident peak or a saturation regime, which can be associated with microstructural features need to be interpreted with reservation. In specific, DRX can be initiated already before the inflection point of the inclining curve and a saturation regime does not necessarily mean a full recrystallization due to DRX.
- Deformations with different deformation parameters (T and ϵ̇) on two UHSS steels showed the influence of MAE on the activation energy of DRX. These findings coincide with the metallographic analysis of the investigated steels, micro-alloying leads to a reduced recrystallization visible in the microstructure. The corresponding activation energy for DRX is increased.
- A rolling scenario was performed on a dilatometer on two ultra-high strength steels and the microstructure development at the different deformation steps was investigated. Although both steels show the same carbon content, the particular steel dispensed with MAE recrystallizes continuously to a homogenous globular austenite grain. The second steel, alloyed with recrystallization retarding elements, such as V and Nb generated a pancaked austenite grain with wide grain size distributions.
Acknowledgement
Funding of the Austrian BMVIT (846933) in the framework of the program “Production of the future” and the “BMVIT Professorship for Industry” was gratefully acknowledged.
Conflict of Interest
The authors declare no conflict of interest.


