Modeling of the Effect of the Gas Flow Rate on the Fluid Flow and Open-Eye Formation in a Water Model of a Steelmaking Ladle
Abstract
In ladle metallurgy of steelmaking, the role of gas injection into the metal bath is been studied to a great extent as it improves the quality of steel. The size of the open-eye is associated with higher emulsification of top slag, which intensifies metal–slag reactions, and information about the position and size of the open-eye is important for effective alloying practice. Moreover, the open-eye has an effect on the energy balance since it increases heat losses. In this work, experimental measurements and numerical simulations are performed to study the effect gas flow rate on the formation of the open-eye in a steelmaking ladle. A one-fifth scale water model is constructed for studying gas injection with single and dual plug configurations. For the numerical modeling, the Multiphase Volume of Fluid (VOF) model is used for simulating the system including the behavior of the slag layer. The physical modeling results show that the open-eye area changes from 9.22 to 198.34 cm2 when the gas flow rate varies from 0.75 to 15 SLM using a single plug. The effect of the number of plugs on the open-eye area for the same range of flow rates mentioned above is also studied. The two open-eye areas generated due to the gas injected through the dual plugs change from 37.59 to 231.1 cm2 when the gas flow rate is increased from 0.75 to 7.5 SLM for each plug in the physical modeling. The numerical simulation results of the open-eye area are found to be in good agreement with the experimental data obtained from the water model. During the gas stirring process, the slag layer is deformed such that the thickness of the slag becomes thick near to the wall and thin near the slag eye at high gas flow rates. In dual plug system, the two open-eyes tends to merge and form a huge open-eye at high flow rates that suits for better alloying purposes. The high-flow velocity near the surface, which could damage the ladle refractory, tends to be reduced in dual plug system when compared to single plug system.
1 Introduction
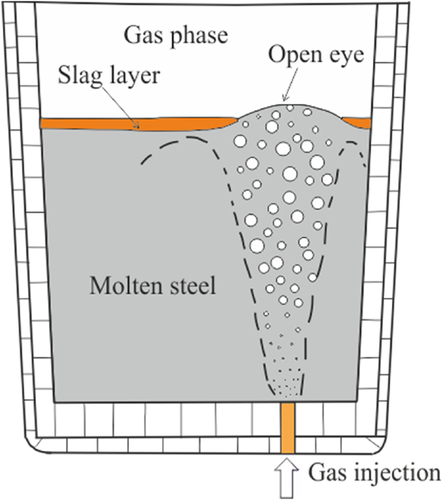
The ladle refining process has a direct effect on the production of steel with good quality. In this process, gas stirring is employed to homogenize the chemical composition and temperature of the metal bath. It is also responsible for the process of deoxidation, desulphurization and removal of inclusions, and intensifying the rate of refining reactions.1-4 In ladle metallurgy, the slag layer plays a pivotal role in refining the molten steel in the ladle as it can encourage metal–slag reactions, prohibit the secondary oxidation of steel, and reduce heat dissipation. In order to enhance the slag–steel interactions and improve the flotation of non-metallic inclusions, gas is commonly injected into the molten steel through one or a number of porous plugs located at the bottom of the ladle. The bubbles in the column rise due to buoyancy, encroach into the slag sporadically, and break the slag layer creating a slag open-eye formation as shown in Figure 1.
The evolution of the open-eye is important in ladle metallurgy, because the refining reactions with the slag are bounded to the slag–metal contact area. Although the open-eye exposes molten steel to an oxidizing atmosphere and introduces heat loss, there are situations where forming an open-eye is beneficial for the outcome of the process. For example, in slag reduction intensive gas stirring promotes slag emulsification on the edge of the open-eye and this enhances reduction reactions. It has been suggested that the slag-metal reaction and desulphurization rate will increase if there is good slag-metal contact around the slag eye.4 Breaking the slag can also be exploited in alloying during which the alloyed material is fed through the open-eye and contact with the slag is avoided.
Studies related to studying the open-eye in a gas-stirred ladle through physical modeling 1-12 and numerical simulation13-24 have been performed extensively in the past three decades. Yonezawa and Schwerdtfeger1-3 carried out cold model measurements using mercury and silicone oil to represent liquid metal and slag, respectively, for investigating the open-eye size in the ladle. Using a video camera technique, the open-eye geometry was found to be highly dynamic. A non-dimensional correlation was developed to represent the time-averaged open-eye size area. They also performed measurements for studying the dynamics of spouts of gas plumes in a large-scale water model. In their paper, a non-dimensional height which is independent of the Froude number and nozzle diameter was defined. Based on the experimental data of Yonezawa and Schwerdtfeger,1-3 Subagyo et al.,5 and Mazumdar et al.6 proposed new correlations for estimating the plume eye area. Krishnapisharody and Irons7 critically evaluated the above work and proposed a model which expresses the dimensionless eye area in terms of a density ratio of the fluids and Froude number. They extended this model, developed a new one to compute the open-eye size from the primary operating variables of the ladle, and demonstrated reliable predictive abilities in a variety of multi-phase systems.8
Wu et al.9 studied the open-eye formation in an argon stirred ladle using two cold physical models. To simulate the liquid steel, water was used in both models. To simulate the slag, silicon oil was used in the first model and a Ga–In–Sn alloy was used in the second model. The results showed that the open-eye size highly depends on the gas flow rate, the height of the lower liquid, and the height of the top liquid. In contrast, the viscosity of the top liquid and interfacial tension between the two liquids has only a slight effect on the open-eye size. Similar work has been by Thuman et al.10 where they used Ga–In–Sn alloy with a melting temperature of 283 K (10 °C) to simulate the liquid steel and an MGCL2-Glycerol (87%) solution to simulate the slag. It was found that no open-eye formed at lower flow rates, but did occur when the gas flow reached a critical rate. This critical flow rate was found to depend greatly on the height of the top liquid.
The influence of the stirring rate on the flow pattern and open-eye size in an industrial 170-ton ladle has been investigated by Valetin et al.11 recently. From the results, it was found that the shape and size of the open-eye are influenced greatly by the gas flow rate and that empirical correlations are not able to fully describe the dynamic flow behavior in the gas stirred ladle. Recently, Zhongqiu et al.12 studied the open-eye size in industrial and a one-third scale water model for different gas flow rates. It was found that the open-eye area increases approximately linearly as the gas flow increases. The open-eye area increases with the decrease in the slag layer thickness and vice versa. Lv et al.13 calculated the effect of ladle dimensions on the open-eye size in a water model ladle. Water and silicon oil were used to simulate the liquid metal and slag. The physical modeling measurements showed that the gas flow rate and slag layer thickness play a critical role in the open-eye size.
Understanding the characteristics of gas plume behavior and the metal–slag interface during the gas stirring process in ladle is very important. Numerical simulations play an important role in understanding the above characteristics due to the high temperatures and the inadequacy of visual accessibility in industrial ladles. Several mathematical models have been developed to study the flow in the ladle by both Eulerian-Lagrange14-16 and Eulerian-Eulerian17-19 approaches. Li et al.20 developed a mathematical model by using a multiphase Volume of Fluid (VOF) method coupled with Population Balance Model (PBM) to investigate the effect of the gas flow rate, plug radial position on the gas bubble diameter, and the open-eye size in the ladle. The results predicted by the model agreed with the experimental results. Li et al.21-23 also developed a three-phase mathematical model based on Large Eddy Simulation (LES) coupled with Discrete Particle Modelling (DPM) and the VOF model to investigate bubble movement and slag layer behavior during gas stirring in the ladle. The predicted simulation results of the formation and closing of the open-eye qualitatively agreed with the experiments.
Cloete et al.15 developed a full-scale, three-dimensional, transient mathematical model by applying the Lagrangian Discrete Phase Model (DPM) for describing the bubble plume and the Eulerian VOF model for tracking the free surface of the melt. This model was proved to be computationally efficient for investigating the influence of a large number of operating and design variables on the fluid flow and mixing time in the ladle. Numerical simulations were performed by Li et al.24 by using a similar model to that developed by Cloete et al.15 to study the fluid and metal–gas–slag behavior in an argon-stirred ladle with single and dual plugs. The simulation results presented a detailed description of velocity fields of molten metal, streamline distributions, slag layer deformation, in addition to the open-eye size with single and double plug configurations. It was concluded that the flow pattern of the molten metal and open-eye size is highly dependent on the flow rate and plug configurations. Numerical simulations were performed by Li et al.25 using an Eulerian VOF model to study the three-phase flow, open-eye size, and spout height in the metal–slag interface with single and dual plugs in the ladle. The simulation results showed that there is huge deformation of the slag layer during the gas stirring operation. The gas flow rate and nozzle plug configurations have a significant effect on the molten metal flow and open-eye size in the ladle.
Over the past decade, there have been relatively few studies on both physical modeling and CFD modeling together with strong validation in studying the metal–slag interface behavior in the ladle. In the current work, the simulation results of open-eye behavior are provided with strong experimental data measured for validation and vice versa. As for the physical modeling part, the work focuses on measuring the open-eye size for different flow rates and identifying the critical flow rates when the open-eye formation starts to exist, appears to be large and becomes dynamic with single and dual plug configurations. As for the simulation part, the work focuses on the development of the CFD model with the Eulerian VOF approach to track the slag/steel/air interface behavior for the gas-stirred ladle.
2 Mathematical Models
The calculations were carried out by using the Eulerian VOF model to track the volume fraction of each phase and free surfaces by solving single set of momentum equations. In this current work, this model was used for tracking the free surfaces between liquid metal, top slag and gas. The governing equations are described in the following based on refs.15, 16, 23, 24
The turbulent viscosity is calculated by Equation 7 using the equations and from Equation 3 and (4), respectively. In these equations, constants are taken as follows: , , , ,
3 Experimental Apparatus and Procedure
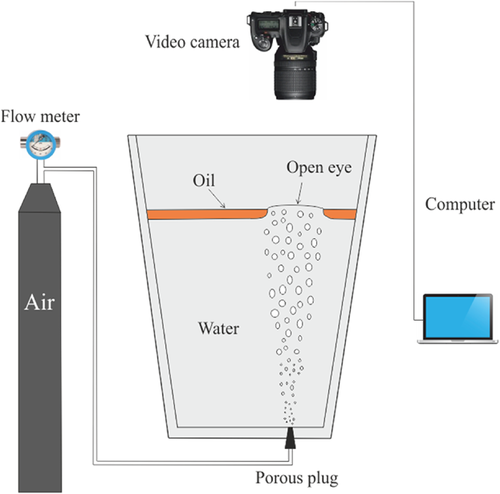
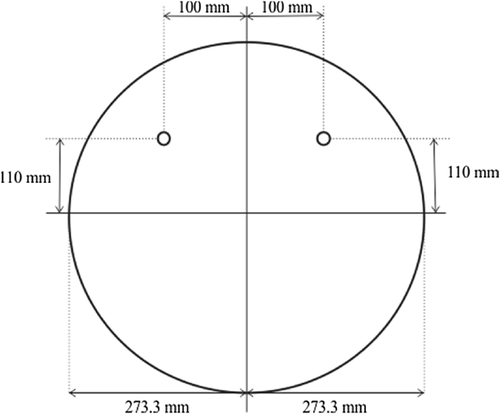
To validate the simulation results, a one fifth-scale water model of a 150-ton ladle was adopted to study the effect of the gas flow rate on the open-eye in the ladle. Air was injected into the water bath through an 8-mm nozzle flush located at a radial position of 0.54R on the bottom of the vessel. The nozzle plug arrangements for the dual plug configuration is shown in Figure 3. The ladle bath was filled with water up to a height of 520 mm from the bottom wall. A slag layer thickness of 30 mm was used, and free space of 205 mm above the slag layer was occupied by atmospheric air. The experimental setup is shown in Figure 2. Tap water and rapeseed oil were used to represent the liquid metal and slag, respectively.
The open-eye was determined with a video technique based on the color difference of rapeseed oil and water. The movement of the open eye for different flow rates was recorded with a digital video camera mounted on the top of the vessel. The recorded images were transferred to computer and processed using the ImageJ software to extract the area of the open-eye. The physical properties of liquid and geometry parameters used in the experiments are shown in the Table 1. Measurements were conducted for gas flow rates ranging from 0.75 SLM to 15 SLM for single and double porous plugs.
| Thermal physical properties | ||
|---|---|---|
| Property | Value | Units |
| Density of water | 997.2 | kg m−3 |
| Dynamic viscosity of water | 0.000891 | Pa · s |
| Density of oil | 907.3 | kg m−3 |
| Dynamic viscosity of oil | 0.0778 | Pa · s |
| Density of air | 1.258 | kg m−3 |
| Dynamic viscosity of air | 1.846 × 10⁻⁵ | Pa · s |
| Interfacial tension | 0.01304 | N m−1 |
| Geometry parameters of the water model ladle | ||
| Radius of the bottom of the ladle | 273.3 | mm |
| Diameter of the top of the ladle | 298.4 | mm |
| Height of the ladle | 755 | mm |
| Slag layer thickness | 30 | mm |
| Effective height filled with water | 520 | mm |
| Height of the top of gas | 205 | mm |
| Porous plug diameter | 8 | mm |
| Plug radial position | 0.54R | – |
4 Geometry Model and Numerical Procedures
The geometrical model was developed according to the one-fifth scale water model parameters reported in Table 1. The computational mesh and boundary conditions for the model with single and double nozzles are shown in Figure 4.

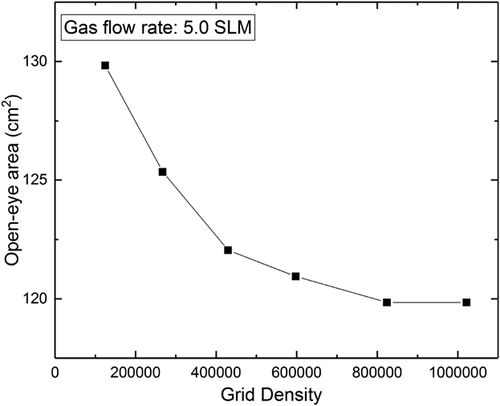
The grid independency tests were conducted on grids with number of cells ranging from 120,000 to 1 million cells. The grid independency tests results are shown in Figure 5. There was a significant change in the slag open eye size area when the grid size was refined from 120,000 to 830,000 cells. However, further refining the grid size to 1 million cells did not alter the results. An optimum grid size of 830,000 cells was chosen for the simulations with a single nozzle plug and with the same configurations for a double nozzle about 880,000 cells were used. The commercial fluid dynamics software ANSYS Fluent was used for solving and finding the solutions of the governing equations in the current three flow simulations. The calculations were performed using the unsteady solution mode with a pressure-based solver. The Eulerian VOF model with explicit geo-construct scheme was used to solve the volume fraction equation. The variable time step Δt was used by setting the Courant number (Co) to be 1 and the convergence criteria was set to 10−6 for the residuals dependent variables.
The time-averaged procedure is presented to get the time-averaged results shown in Figure 6 for validating the unsteady simulations against the experimental results.
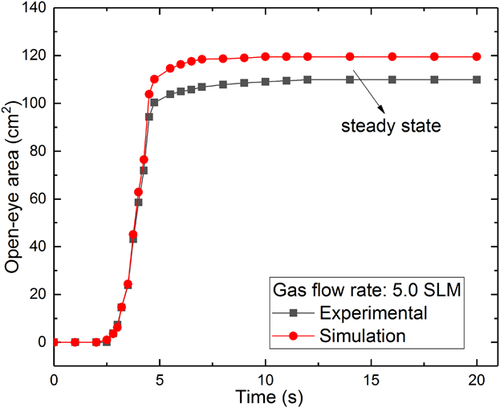
The simulation reached a steady state when the physical flow time was around 13 s and there was no change in the results when the simulations were continued further. The simulations were stopped and results were taken once the physical time reached 20 s. The experiments also reached a steady state at the same time at around 13 s, after this time there was no change in the open-eye size area. The images of the open-eye area were captured after reaching the steady state condition.
5 Results and Discussion
5.1 Dimensionless Presentation of the Open-Eye Behavior in the Physical Model
The dimensions of the current water model, densities of water, and oil used in the current work are substituted in the Equation 10 for calculating the dimensionless open-eye area. Li et al.21 also measured the dimensionless open-eye area using the model developed by Krishnapisharoday et al.7 The results of the current work are also shown in Figure 7. This indicates that the open-eye area obtained by the present model may be somewhat higher compared to the literature data. These measured experimental results of the open-eye were used for validating the numerical simulations.
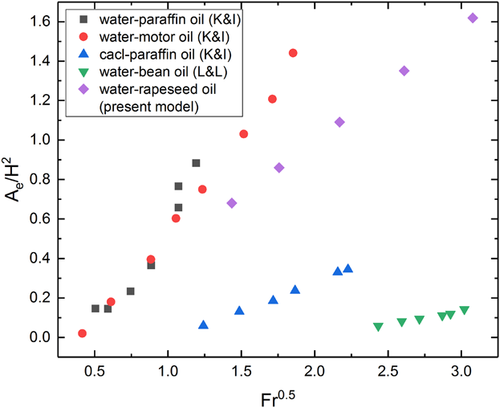
The simulation results of fluid flow and open-eye behavior for different flow rates using single and double plug were compared to the experimental results measured and discussed below.
5.2 Simulated Fluid Flow and Open-Eye behavior in a One-Plug System
Figure 8-12 present the experimental and simulation results of the effect of the gas flow rate on the open-eye size in a single plug system. A smaller open-eye opening occurred when a flow rate of 0.75 SLM was used, which is shown in Figure 8 and the open-eye formation was not observed to occur if the flow rate was lower than this. A flow rate of 0.75 SLM generated an open-eye of diameter of approximately 3.43 cm in physical modeling, whereas this was 3.58 cm in the simulation results.
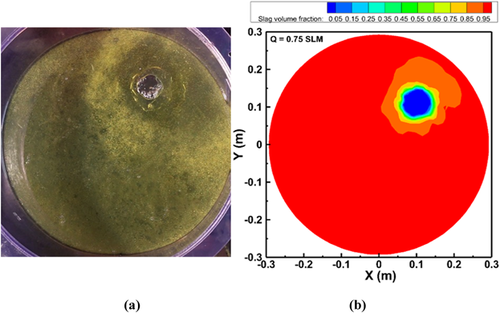
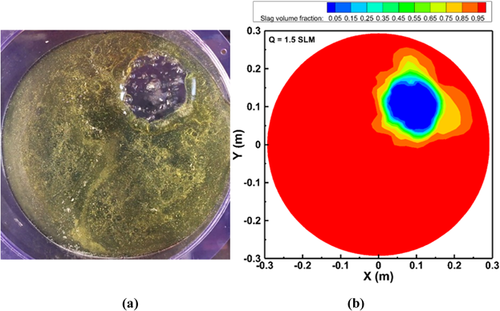
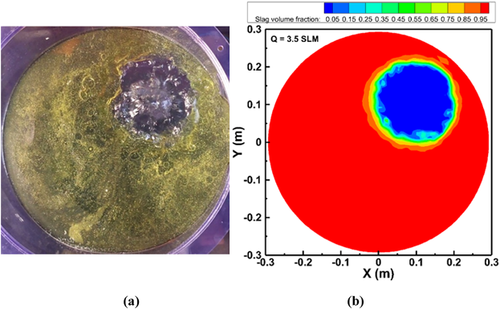
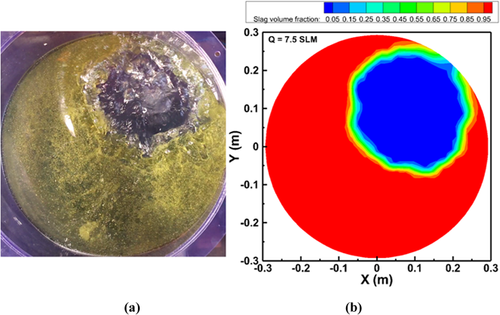
The diameter of the open-eye expanded to 6.31 cm when the flow rate was elevated to 1.5 SLM, which shows a good agreement to 6.35 cm measured experimentally shown in Figure 9. When the flow rate was increased to 3.5 SLM, the diameter of open-eye enlarged to 9.46 cm in the physical modeling, whereas it was 9.94 cm in the numerical modeling (see Figure 10). The open-eye expanded from 9.46 to 12.79 cm when the flow rate was increased to 7.5 SLM, which was somewhat larger than the value obtained from the simulations (Figure 11).
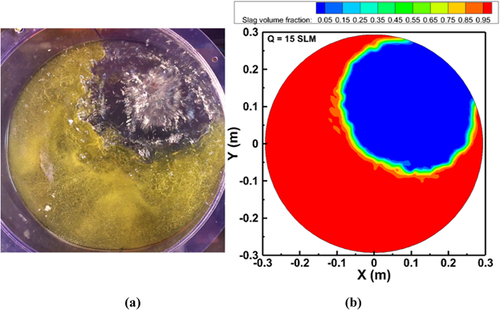
The gas flow rate of 15 SLM generates an open-eye of diameter 15.89 cm through physical modeling, which was not quite in agreement with the simulation result. At high gas flow rates (7.5 and 15 SLM), it was observed that there were significant deformation of the slag layer during gas stirring, and the thickness of the slag layer became thin near the open eye. This indicates that there would be a strong flow in the liquid metal, which may damage and reduce the life of ladle. The predicted open-eye sizes are in agreement with the shape and size when compared to the simulation results by Li et al.20 and Li et al.25 When the gas flow rate was increased beyond 15 SLM, the open-eye became highly dynamic and the fluid flow was more turbulent. The increment of the open-eye area when the gas flow rate was increased from 1.5 to 15 SLM is shown in Figure 13 and a summary of the increments of the open-eye area and diameter with respect to the gas flow rate is shown in Table 2.
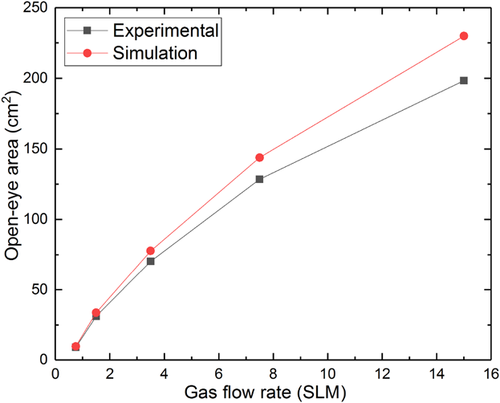
| Gas flow rate [SLM] | Experimental: area [cm2] | Simulation: area [cm2] | Experimental: diameter [cm] | Simulation: diameter [cm] |
|---|---|---|---|---|
| 0.75 | 9.22 | 9.84 | 3.43 | 3.58 |
| 1.5 | 31.24 | 33.73 | 6.31 | 6.65 |
| 3.5 | 70.22 | 77.70 | 9.46 | 9.94 |
| 7.5 | 128.41 | 143.83 | 12.79 | 13.53 |
| 15 | 198.34 | 229.93 | 15.89 | 17.11 |
The open-eye area increased from 9.22 to 198.34 cm2 in the physical modeling and from 9.84 to 229.93 cm2 in the numerical simulations. The diameter of the open-eye increased from 3.43 to 15.89 cm in the physical modeling and from 3.58 to 17.11 cm in the numerical simulations. When the gas flow rate increased from 0.75 to 15 SLM, the relative error in the area of the open-eye increased from 6.7 to 15.9%, while the error in the open-eye diameter increased from 4.4 to 7.7%. In view of the complexity of the studied case, the agreement is satisfactory. Figure 14 shows the velocity distribution of the mixture flow at four different XY section plots for gas flow rates of 3.5 and 15 SLM in a one-plug system. The velocity distribution plots show that the rising gas jet due to the injection of gas bubbles forms a plume and enlarges as it rises.
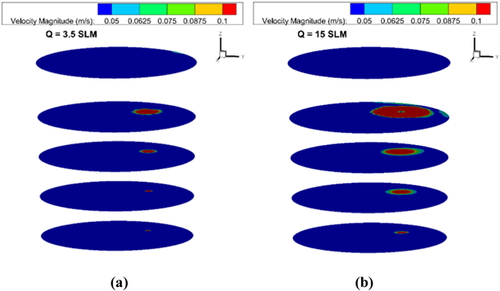
The enlargement of the plume depends on the gas flow rates. At a low gas flow rate of 3.5 SLM, the bubble plume is less intensive and generates a smaller open-eye on the surface of the slag shown in Figure 10. On the other hand, the bubble plume is more intensive and a larger open-eye is formed on the surface of the slag for a gas flow rate of 15 SLM shown in also Figure 12. The predicted mixture flow distribution appearances were consistent with the available experimental observations of Joo et al.26 and simulation results of Liu et al.24
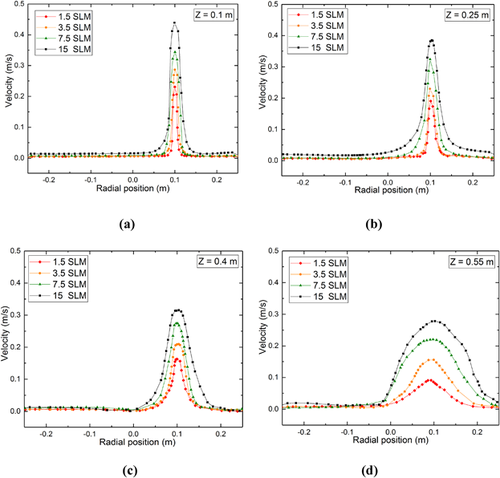
Figure 15 depicts the velocity distribution of the mixture flow on the horizontal planes shown in Figure 14 in the vertical direction where the flow enters from the nozzle in a single plug system. For all the velocity profiles at four different heights, shown in Figure 15, a higher mixture flow velocity occurred in the region at a radius of 0.1 m from the central region. This was because the bubble plume developed from the air injected through the nozzle located at that position. The velocity of the mixture flow is very high near the nozzle inlet and decreases as the flow move upwards for all gas flow rates. For a lower gas flow rate of 1.5 SLM, the mixture flow velocity decreased from 0.24 to 0.09 m s−1 at heights Z = 0.1 to 0.54 m. At a higher gas flow rate of 15 SLM, it decreased from 0.45 to 0.3 m s−1 approximately. At a height near to nozzle inlet (Z = 0.1 m), the flow velocity of the mixture increased from 0.24 to 0.45 m s−1 when the gas flow rate was increased from 1.5 to 15 SLM. At a height near the air/water/oil interface (Z = 0.55 m), the velocity of the mixture flow increased from 0.09 to 0.3 m s−1 approximately. The predicted velocity fields follow the same trend as the physically measured radial velocity profiles by Xie et al.27 There are negative velocities near to the ladle wall, due to the circular motion of water. However, the scale in the Figure 15 was limited to present clearly the velocities in the gas plume area. The same applies later for Figure 23 as well.
5.3 Simulated Fluid Flow and Slag Open-Eye behavior in Dual-Plug System
The experimental and simulation results of the effect of the gas flow rate on the open-eye in a dual plug system are shown in Figure 16-20. In the dual plug system, air was injected through the two nozzles present at the bottom of the model, which results in the formation of two open-eyes. As we can observe in Figure 16 the open-eye is quite hard to form when a gas flow rate of 0.375 SLM was injected from the both the nozzles. A flow rate of 0.75 SLM from each nozzle developed two open-eyes with a diameter of approximately 3.46 cm for each one in the physical modeling, whereas 3.55 cm from simulation results. The diameter of the two open-eyes expanded to 7.14 cm when the flow rate was elevated to 1.75 SLM in each nozzle, which shows good agreement with the 7.18 cm measured experimentally shown in Figure 18.
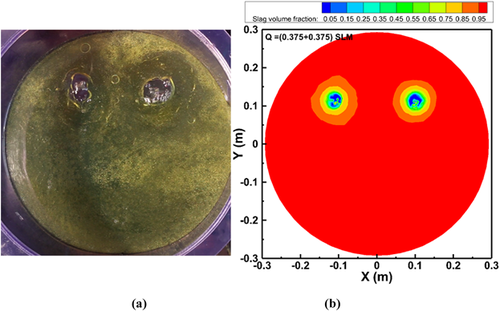
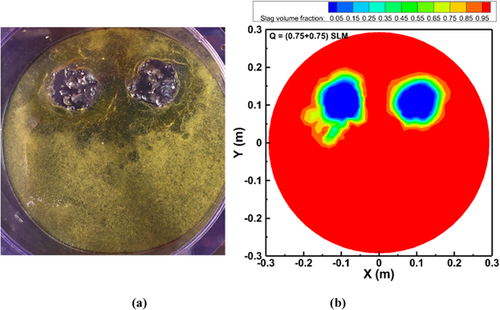
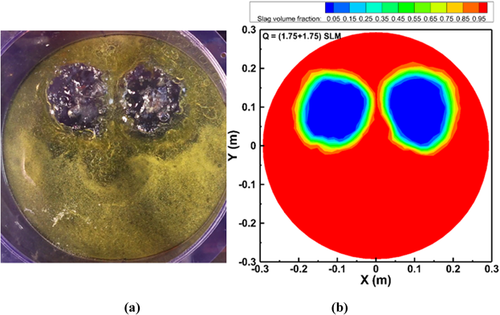
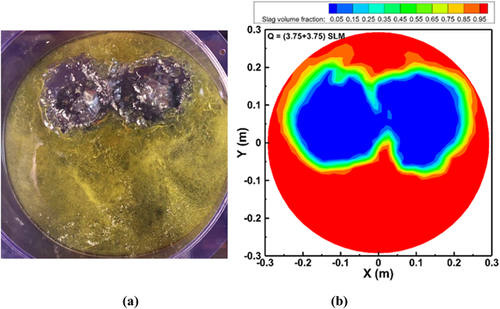
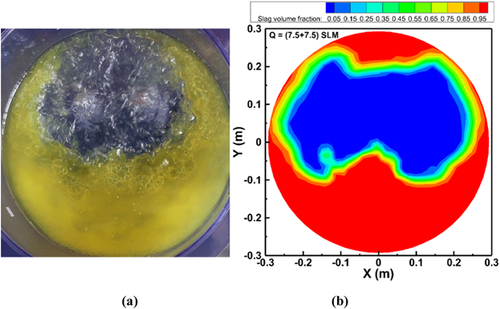
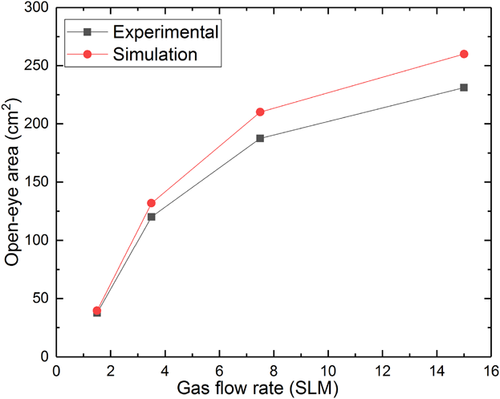
A series of experiments was conducted to measure the critical gas flow rate as the two open-eyes started to merge into one large open-eye. When the flow rate was increased to 3.75 SLM in each plug, the two open-eyes formed tended to merge and form a single open-eye shown in Figure 19. The same tendency was shown in both the physical and numerical modeling results. A gas flow rate of 7.5 SLM in both the nozzles generated one large open-eye by merging the two generated open-eyes shown in Figure 20. This information will help us to understand in choosing the flow rates to generate a larger open-eye for better alloying practice when using double nozzles. To avoid the deformation of the slag layer at high gas flow rates, it might be beneficial to use dual plugs by dividing the gas flow into two weakened plumes. Table 3 shows a summary of the effect of the gas flow rate on increments of the open-eye area and diameter in a dual plug system. At a critical flow rate of 3.75 SLM from each plug, the merged two open-eyes generated an area of 187.4 cm2 in the physical modeling, and 210.1 cm2 in the simulations. At a high gas flow rate of 7.5 SLM in each plug, the open-eye was about 231.1 cm2 in the physical modeling, while the corresponding simulation result was about 259.9 cm2. The open-eye generated from a single plug system at a high gas flow rate of 15 SLM was about 229.93 cm2 approximately, whereas in the dual plug system it was about 259.9 cm2. This indicates that a large open-eye can be generated for better alloying purpose using a dual plug system.
| Gas flow rate [SLM] | Experimental: area [cm2] | Simulation: area [cm2] | Experimental: diameter [cm] | Simulation: diameter [cm] |
|---|---|---|---|---|
| 0.75 + 0.75 | 37.59 | 39.57 | 3.46 + 3.46 | 3.55 + 3.55 |
| 1.75 + 1.75 | 120.1 | 131.8 | 6.18 + 6.18 | 6.47 + 6.47 |
| 3.75 + 3.75 | 187.4 | 210.1 | 15.45 | 16.35 |
| 7.5 + 7.5 | 231.1 | 259.9 | 17.16 | 18.19 |
The increments of the open-eye area when the gas flow rate was increased from 0.75 to 7.5 SLM in each plug in the dual plug systems are shown Figure 21. The area of the two open-eyes increased from 37.59 to 231.1 cm2 in the physical modeling and from 39.57 to 259.9 cm2 in the numerical simulations. The diameter of the each open-eye increased from 3.46 to 6.18 cm in the physical modeling and from 3.55 to 6.47 cm in numerical simulations, when the gas flow rate was increased from 0.75 to 1.75 SLM in each plug. The merged single open-eye diameter increased from 15.45 to 17.16 cm in the physical modeling and from 16.35 to 18.19 cm in simulations. The error percentage between the physical modeling and numerical modeling is about 12.5% at a high gas flow rate of 7.5 SLM. The agreement is quite satisfactory in studying the complexity in this current case.
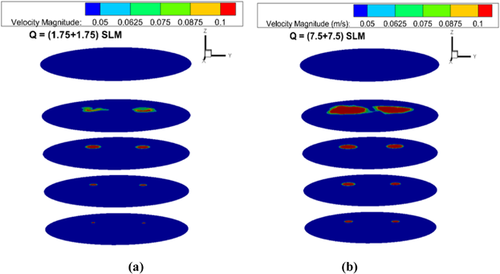
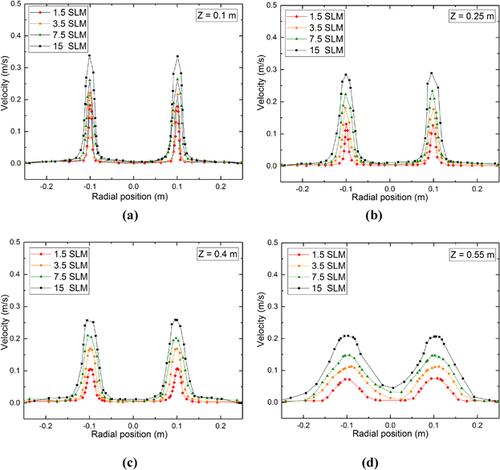
The velocity distribution of the mixture flow at different XY section plots for gas flow rates of 1.75 and 7.5 SLM for each nozzle in the dual-plug system is shown in Figure 22. As discussed earlier concerning the flow behavior in a single-plug system, the augmentation of the plume depends on the gas flow rates. At a low gas flow rate of 1.75 SLM in each nozzle, the bubble plume is less intensive, which is similar to the single plug system shown in Figure 18. At higher flow rates, the bubble was more intensive in the double-plug system than it was in the single-plug system. Li et al.21 and Liu et al.24 had also made similar predictions by plotting the streamlined distribution of the flow in the ladle. The velocity distribution of the mixture flow at different sections in the dual plug configuration is illustrated in Figure 23. As discussed earlier in Figure 15, the velocity distribution is plotted on the horizontal plane in the vertical direction where the flow enters from the two nozzles. As seen in Figure 23, higher fluid velocity arises in the region of 0.1 m and −0.1 m from the center due to presence of the nozzles located at that position. Similar to the single plug system, the fluid flow velocity was very high near the nozzle inlet and decreased as flow moved away in the vertical direction. The mixture flow velocity declined from 0.2 to 0.06 m s−1 for the lower gas flow rate of 1.5 SLM and from 0.34 to approximately 0.21 m s−1 for a higher gas flow rate of 15 SLM at heights Z = 0.1 to 0.55 m. The flow velocity of the mixture rose from 0.21 to 0.34 m s−1 at Z = 0.1 m (height near the nozzle inlet) and from 0.09 to 0.21 m s−1 at Z = 0.55 m (air/water/oil interface), when the gas flow rate was increased from 1.5 to 15 SLM. Predictions by Xie et al.28 of the flow velocity distribution with eccentric blowing corresponds to the similar velocity profiles of the current work.
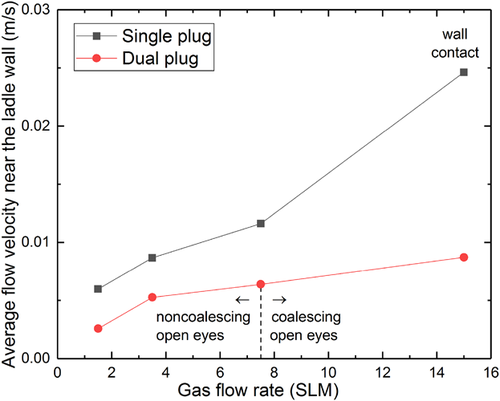
In a single plug system, the open-eye moves closer to the ladle walls with higher gas flow rate, thus increasing the fluid flow velocities near the ladle wall. In plant practice, a higher fluid flow velocity near the ladle wall would contribute to higher refractory wear at the metal–slag interface. In this work, a user defined function (UDF) was employed to calculate the average flow velocity near the ladle wall in the region near the slag–steel interface. The observed region was limited from 400 mm from the bottom of the ladle to the initial upper boundary of the slag layer which is at 550 mm. The effect of the number of plugs on the average flow velocity near the wall is shown in Figure 24. It can be seen that, for a given flow rate, the average velocity near the ladle wall is always greater in the one plug systems. During alloying an open-eye is formed to feed the alloying material into steel without making contact with the slag. The open-eye needs to be large enough for this purpose and this can be obtained with high gas flow rates. However, excessive gas flow rates increase the flow velocity near the ladle wall which may lead to mechanical wear of the refractory. With dual plugs the flow rate must be high enough to form one open-eye instead of two separate open-eyes. As shown in Table 2 and 3, a larger open-eye with a given flow rate is generated if it is divided between two plugs instead of feeding it from one plug only. Combining this with the information provided in Figure 24, it can be concluded that with dual plugs a larger open-eye can be obtained with a less intensive flow at the ladle wall. Furthermore, judging from Figure 8–12 and Figure 16–20 it seems that the wall contact of the open-eye can be better avoided in the dual plug systems. As it can be seen from Figure 24, the wall contact at the highest flow rate in the single plug case induces more intensive flow in the vicinity of the ladle wall. With this qualitative analysis it can be concluded that, from an alloying perspective, a given volumetric gas flow rate using two bottom plugs instead of one seems to be a preferable choice because a larger open-eye can be created with a less intensive flow in the vicinity of the ladle walls which reduces the mechanical wear of the ladle refractory.
6 Conclusions
A one-fifth scale water model of a 150-ton steelmaking ladle was employed to study the effect of the gas flow rate on the open-eye formation in single and dual-plug configurations. A numerical model based on the Multiphase Volume of Fluid (VOF) approach was developed to simulate the multiphase flow in a gas stirred ladle and validate the present experimental open-eye results. The characteristics of the fluid flows for different gas flow rates in single and dual-plug configurations were described. A comparison of the open-eye formation for different gas flow rates, between single-plug and two-plug systems was made.
- The injected gas flow rate had an effect on the open-eye area and diameter. In a single plug system, when the gas flow rate was increased from 1.5 to 15 SLM, the diameter of the open-eye changed from 3.58 to 17.11 cm and the error percentage of variance between physical modeling results to simulations results open-eye diameter increased from 4.4 to 7.7%.
- An open-eye did not form when the gas flow rate was lower than 0.75 SLM. At high gas flow rates (7.5 and 15 SLM), there was a large deformation in the slag layer in the single plug system which may damage the ladle.
- In the dual plug configuration, the critical gas flow rate for two generated open-eyes to merge was obtained. The merged open-eye was larger in area at high gas flow rates than in the single plug system. Through using the dual plug configurations, it was possible to reduce the high gas flow rates into two equally weakened plumes, thus reducing the significant deformation of the slag layer.
- The velocity of the fluid flow developed from the air injected through the nozzle was very high at lower heights and tended to decrease as the flow reached the air/water/oil interface for both single and dual plug configurations.
- With a given flow rate, the flow velocity in the vicinity of the ladle wall tended to decrease in the dual plug system when compared to the single plug system. Along with forming a larger open-eye, the increase in the number of plugs for gas injection could thus reduce the wear of the ladle refractory.
Acknowledgement
The authors are grateful for the financial support of the European Commission under grant number 675715-MIMESIS − H2020-MSCA-ITN-2015, which is part of the Marie Sklodowska-Curie Actions Innovative Training Networks European Industrial Doctorate Programme. Furthermore, the Finnish Cultural Foundation is acknowledged for their financial support.
Conflict of Interest
The authors declare no conflict of interest.
Nomenclature
-
- ρ
-
- Density, kg m–3
-
- u
-
- Fluid velocity, m s–1
-
- µ
-
- Effective viscosity, Pa.s
-
- g
-
- Gravitational acceleration, m s–2
-
- P
-
- Pressure, Pa
-
-
- Effective turbulent viscosity, Pa.s
-
- k
-
- Turbulent kinetic energy, m2 s–2
-
- ϵ
-
- Turbulent dissipation rate, m2 s–3
-
-
- Turbulent eddy viscosity, Pa.s
-
- Co
-
- Courant number
-
-
- Additional force vector, kg m–2 s–2
-
-
- Phase volume fraction
-
- Q
-
- Gas flow rate, m3 s–1
-
- A
-
- Area, m2
-
- SLM
-
- Standard liters per minute


