Capsaicin Enhanced the Efficacy of Photodynamic Therapy Against Osteosarcoma via a Pro-Death Strategy by Inducing Ferroptosis and Alleviating Hypoxia
Abstract
Ferroptosis, a novel form of nonapoptotic cell death, can effectively enhance photodynamic therapy (PDT) performance by disrupting intracellular redox homeostasis and promoting apoptosis. However, the extremely hypoxic tumor microenvironment (TME) together with highly expressed hypoxia-inducible factor-1α (HIF-1α) presents a considerable challenge for clinical PDT against osteosarcoma (OS). Hence, an innovative nanoplatform that enhances antitumor PDT by inducing ferroptosis and alleviating hypoxia is fabricated. Capsaicin (CAP) is widely reported to specifically activate transient receptor potential vanilloid 1 (TRPV1) channel, trigger an increase in intracellular Ca2+ concentration, which is closely linked with ferroptosis, and participate in decreased oxygen consumption by inhibiting HIF-1α in tumor cells, potentiating PDT antitumor efficiency. Thus, CAP and the photosensitizer IR780 are coencapsulated into highly biocompatible human serum albumin (HSA) to construct a nanoplatform (CI@HSA NPs) for synergistic tumor treatment under near-infrared (NIR) irradiation. Furthermore, the potential underlying signaling pathways of the combination therapy are investigated. CI@HSA NPs achieve real-time dynamic distribution monitoring and exhibit excellent antitumor efficacy with superior biosafety in vivo. Overall, this work highlights a promising NIR imaging-guided “pro-death” strategy to overcome the limitations of PDT for OS by promoting ferroptosis and alleviating hypoxia, providing inspiration and support for future innovative tumor therapy approaches.
1 Introduction
Within the past 20 years, the efficacy of surgery combined with neoadjuvant chemotherapy for osteosarcoma (OS) has not considerably increased, and the 5-year survival rate of OS patients has not significantly improved.[1] As a novel treatment characterized by minimal side effects, noninvasiveness, and favorable safety, photodynamic therapy (PDT) has emerged as an effective modality for OS treatment, as it can trigger the excessive accumulation of cytotoxic reactive oxygen species (ROS) by absorbing energy from irradiation.[2] However, OS cannot be completely eradicated by a single PDT session due to phenotypic diversity and multidrug resistance, which leads to tumor recurrence and metastasis.[3] As an emerging nonapoptotic mode of cell death, ferroptosis not only enhances the sensitivity of apoptosis-based cancer treatments while relying on the amplified oxidative stress mediated by ROS, but also bypasses apoptotic pathway-related therapeutic resistance by regulating intracellular redox homeostasis, especially in chemotherapy-resistant tumor cells.[4, 5] Moreover, the severe hypoxia characteristic of the tumor microenvironment (TME) severely limits the therapeutic efficiency of PDT by restricting the production of ROS, and the consumption of O2 during PDT could further aggravate hypoxia.[6, 7] With the rapid development of nanotechnology, nanocarriers have attracted extensive attention due to their ability to improve drug activity and selectivity.[8] Therefore, rationally designing nanoparticles (NPs) that induce ferroptosis and alleviate hypoxia to improve the therapeutic effect of PDT is an interesting strategy.
The natural nontoxic small molecule organic substance capsaicin (trans-8-methyl-N-vanillyl-6-nonenamide, CAP) is one of the major pungent ingredients of red pepper and has been reported to have potential anticancer ability in different cancer cells.[9, 10] We demonstrated that CAP could serve as a chemotherapy adjuvant for the treatment of OS.[11] Transient receptor potential vanilloid 1 (TRPV1), specifically activated by CAP, is a ligand-gated nonselective cation channel that, when activated is accompanied by extracellular calcium ion (Ca2+) influx. Since Ca2+ is a ubiquitous second messenger involved in diverse signal transduction pathways, the increase in intracellular Ca2+ concentration causes an imbalance in intracellular calcium homeostasis. The intimate connection between Ca2+ and ferroptosis has been widely revealed specifically, increasing intracellular Ca2+ levels enhance the level of ferroptosis.[12-14] Unlike other death modes, ferroptosis is partly dependent on defects in lipid peroxide repair that occur via inhibition of glutathione peroxidase 4 (Gpx4), which is responsible for preventing the cytotoxicity of lipid peroxides and maintaining the homeostasis of the membrane lipid bilayer. Importantly, it was fortunately reported that CAP induces ferroptosis by inactivating Gpx4.[15] Current strategies to overcome tumor hypoxia mainly involve increasing the oxygen level at the tumor site. Moreover, it is important to elucidate and exploit the molecular and genetic changes in tumor cells that result in decreased physiological oxygen consumption as another strategy to relieve tumor hypoxia.[7, 16] Hypoxia-inducible factor-1α (HIF-1α) is a classic transcription factor that regulates the expression of various genes in response to hypoxia in the TME and is rapidly degraded by the oxygen-dependent proteasomal pathway under normoxia.[17] Hypoxic conditions result in the accumulation of HIF-1α, which is associated with resistance to radiotherapy,[18] chemotherapy,[19] and particularly PDT.[7, 20] Additionally, it was reported that CAP inhibited HIF-1α accumulation to decrease oxygen consumption in the treatment of some diseases, such as lung cancer[21] and arterial calcification.[22] Inspired by these results, we hypothesized that CAP not only has the potential to induce ferroptosis by increasing the levels of TRPV1/Ca2+ and inhibiting Gpx4 but also by suppressing HIF-1α accumulation to relieve hypoxia. Thus, the “killing two birds with one stone” pro-death strategy to enhance PDT efficacy against OS may be promising.
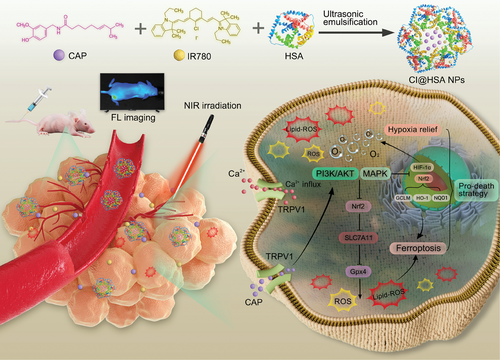
Small organic near-infrared (NIR) photosensitizers (PSs) (such as IR780) have been used in PDT due to their ability to deeply penetrate tissue.[23] Benefitting from the excellent NIR fluorescence (FL) imaging ability of IR780 and the covalent bonding characteristic between IR780 and albumin,[24] our designed CI@HSA NPs could achieve precise and real-time dynamic distribution monitoring in vivo.[25-27] Herein, as a proof of concept, to improve PDT efficiency against OS by NIR imaging-guided synergistic therapy, we established an emerging theranostic nanoplatform (CAP@IR780@HSA NPs, CI@HSA NPs), in which CAP and IR780 were coloaded into HSA via the ultrasonic emulsification-solvent evaporation method. Moreover, the combination of CAP and PDT synergistically promoted ferroptosis by accumulating excessive ROS and Lipid-ROS, potentially triggered by the increased Ca2+ levels and inactivation of Gpx4, which was restrained by suppression of the Nrf2/SLC7A11 pathway. Moreover, HIF-1α was suggested to be downregulated by the released CAP to alleviate hypoxia in OS cells. Furthermore, the specific molecular mechanism of the synergistic effects between TRPV1/Ca2+ and Nrf2/SLC7A11/Gpx4 or HIF-1α was revealed to occur via the activation of MAPK and the suppression of the PI3K/AKT signaling pathways (Scheme 1). In this study, systematic evaluations were conducted to demonstrate the enhanced PDT efficacy of CI@HSA NPs in vitro and in vivo and explore the potential mechanisms underlying the synergistic effects of the treatments, providing a promising strategy for safe and effective tumor therapy.
2 Results
2.1 Design and Characterization of CI@HSA NPs
First of all, we previously reported that treatment with CAP or IR780-PDT can inhibit OS in a concentration-dependent manner.[11, 26] Based on our previous study, to determine whether CAP combined with IR780-PDT had synergistic effects on inducing enhanced cytotoxicity to OS, we performed cell viability tests by CCK-8 assay with different ratios of reagents. Briefly, 143B and HOS cells were treated with different concentration gradients of CAP (15, 30, and 45 µg mL−1) and IR780 (5, 10, and 15 µg mL−1) for 24 h following NIR irradiation, and the results showed that various concentrations of CAP can enhance PDT-induced cytotoxicity (Figure 1A,B). Subsequently, the zero interaction potency (ZIP) synergy scores were calculated by SynergyFinder software (https://synergyfinder.fimm.fi)[28] to further determine the optimal combinations. Scores higher than 10 indicated a specific synergistic effect of the two treatments. As shown in Figure 1C,D, the results showed that the average proportions of the antitumor response attributable to the therapy interaction were 25.98 and 16.543 in 143B and HOS cells, respectively. The white rectangle represents the region of the maximum synergistic area, indicating that the optimal weight ratio of CAP and IR780 in nanoparticles was fixed at 3:1 (w/w) for subsequent experiments.
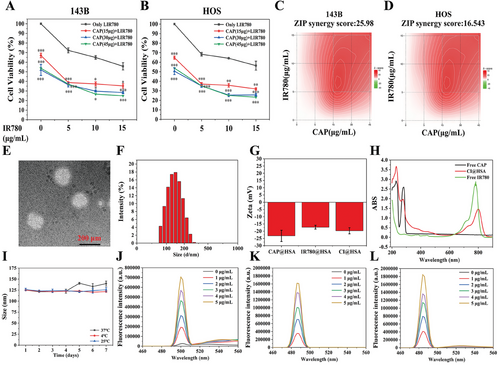
CI@HSA was synthesized via the ultrasonic emulsification-solvent evaporation method, and TEM showed that the CI@HSA NPs were spherical with a smooth surface (Figure 1E). The mean diameters of the CAP@HSA, IR780@HSA, and CI@HSA NPs were 153.45 ± 5.285, 134.4 ± 6.024, and 139.6 ± 4.893, respectively (Figure 1F). The average zeta potential was −23.3 mV for CAP@HSA NPs, −17.2 mV for IR780@HSA NPs, and −19.7 mV for CI@HSA NPs (Figure 1G). As shown in Figure 1H, UV–vis spectra indicated that free CAP has a characteristic absorption at 280 nm and free IR780 at 780 nm. No absorption overlap was present. The CI@HSA NPs showed a slightly shifted absorbance peak at 780 nm, probably due to the molecular conformation change after IR780 complexed with albumin, while showing significantly reduced absorbance at 280 nm, indicating that CAP formed a complex with albumin (Figure 1H). For CI@HSA NPs, the EE% values were ≈94% for CAP and 79.43% for IR780. The DL% values were 2.3% and 0.247, respectively. The average particle sizes remained nearly unchanged for all the NPs after 1 week of storage at 4 °C, room temperature, and 37 °C (Figure 1I; Figure S1, Supporting Information), suggesting CI@HSA NPs generally have suitable stability. Meanwhile, we conducted the gel imagining on our nanoparticle formulations, and compared with single HSA NPs, we observed the fluorescence of IR780 on the albumin in CI@HSA NPs, which was significantly weakened after NIR irradiation and three groups showed a similar expression at ≈66 kDa, indicating a positive covalent binding (Figure S2, Supporting Information).
To determine whether laser irradiation and ROS generation have an impact on CI@HSA NPs, we first scanned the UV–vis absorption spectrum. The characteristic absorption of IR780 ≈780 nm was significantly reduced after irradiation, indicating that IR780 had been fully reacted. However, there was no observable change in absorption ≈280 nm (Figure S3B, Supporting Information). Then, we compared the average size and PDI of CI@HSA NPs after laser irradiation. No significant changes could be detected (Figure S3C,D, Supporting Information), which means that the nanoparticles remained relatively the same and no significant degradation of the carriers happened. Next, we extracted the total CAP from CI@HSA NPs before and after NIR irradiation to see if the generated ROS would damage its molecular integrity. As indicated in the HPLC diagram, the retention time, peak area, peak height, and shape were absent from any significant changes, as well as no new unknown peaks were found (Figure S3E,F, Supporting Information). We also investigated if laser irradiation could affect CAP release in vitro. As shown in Figure S2A (Supporting Information), the free CAP release reached more than 90% within the first 24 h. For CI@HSA NPs, more than 70% of CAP was released in vitro during the first 24 h at pH 6.8 (Figure S3A, Supporting Information). And such release could not be significantly accelerated under both 0 and 12 h NIR irradiation compared to that without laser irradiation possibly due to relatively lower contents of IR780 in the nanoparticle formulation. The CI@HSA NPs were prepared to boost PDT efficiency, which was closely related to the generation of ROS. In vitro singlet oxygen (1O2) generation by IR780 under NIR irradiation was demonstrated by a singlet oxygen sensor SOSG fluorescence probe.[25, 29] As shown in Figure 1J, the FL intensities gradually increased with increasing concentrations of IR780, showing concentration-dependent characteristic. Considering the encapsulation of cyanine dyes may alter the ROS type or yield, we further investigated other possible types of ROS. 4-hydroxyphenyl-fluorescein (HPF) was used for hydroxyl radicals (•OH).[30] Dihydrorhodamine 123 (DHR123) was used as an indicator of superoxide radical (O2−•) formation.[31] The results demonstrated that both the FL intensity of •OH and O2−• showed high yield in concentration-dependent characteristics (Figure 1K,L).
2.2 Intracellular Uptake and Synergistic Therapeutic Performance In Vitro
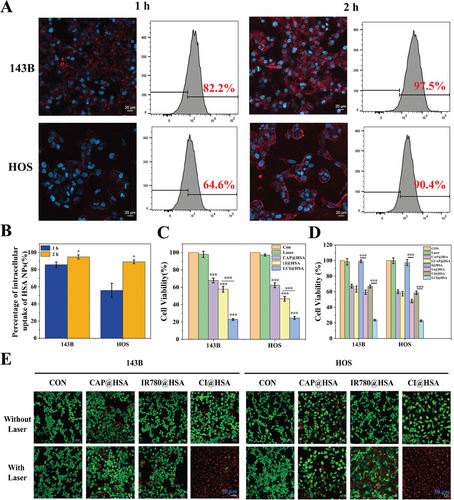
After the successful preparation and characterization of CI@HSA NPs, the intracellular uptake of DID@HSA NPs was visualized by CLSM and analyzed by FC, as the optimal intracellular uptake time is important for subsequent therapeutic efficacy. As shown in Figure 2A,B, DID@HSA NPs were rapidly internalized by 143B and HOS cells after 1 h of coincubation, as demonstrated by the presence of red FL intensity. After 2 h of coincubation, obvious intracellular red FL could be observed as a result of the efficient phagocytosis of HSA NPs in the two OS cell lines. Moreover, quantitative analysis by FC determined that the intracellular uptake rate was greater than 90% after 2 h of coincubation of HSA NPs in both 143B and HOS cells. These results indicated that HSA NPs exhibited significantly efficient intracellular uptake. After verifying the highly efficient phagocytosis of HSA NPs, a CCK-8 assay was used to estimate the antitumor efficacy of CAP@HSA NPs, LI@HSA (laser + IR780@HSA NPs) and LCI@HSA (laser + CI@HSA NPs) in two OS cell lines (143B and HOS) in vitro. As shown in Figure 2C, compared to the control group, the single laser group had no effect on cell viability. However, it was reduced in both the CAP@HSA NPs and LI@HSA treatment groups, and LCI@HSA induced significantly higher cytotoxicity, highlighted by decreased relative cell viability to 0.232 and 0.249 in the 143B and HOS cell lines, respectively. To further verify the difference in cell viability between the different drug-treated cells that received laser irradiation or not, the single or synergistic therapeutic anticancer effects of CAP and PDT were further investigated through a CCK-8 assay under NIR irradiation or not. The results demonstrated that there was no significant difference between the CAP@HSA group and the laser + CAP@HSA group. In contrast, cell viability was inhibited when receiving NIR irradiation in both the LI@HSA and LCI@HSA groups compared with the IR780@HSA and CI@HSA groups (Figure 2D). Moreover, the cytotoxicity of different treatments was also visualized by live/dead cell staining observed by CLSM, which showed that almost all of the cells presented red FL intensity in the LCI@HSA treatment group (Figure 2E), which was consistent with the results of the CCK-8 assay. These results indicated that low doses of CAP could sensitize 143B and HOS cells to PDT, and the specific mechanism by which CAP enhanced the sensitivity of OS cells to PDT was further explored.
2.3 Elevation of Intracellular Ca2+ Concentration by TRPV1 Activation
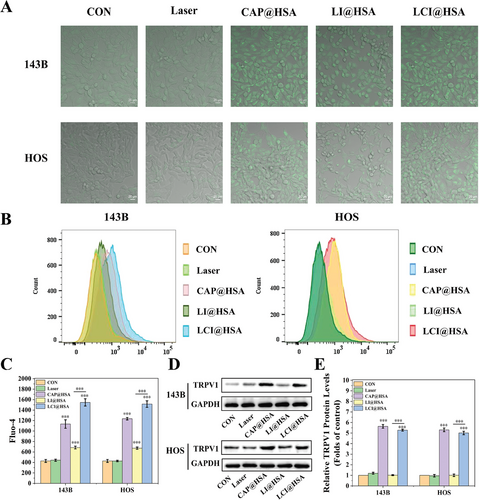
The FL probe Fluo-4 was used to monitor Ca2+ influx in different treatment groups to indirectly indicate the activation of TRPV1. As shown in Figure 3A, CLSM images of two OS cells incubated with different experimental treatments showed that a strong green FL signal was observed in both the CAP@HSA NPs and LCI@HSA treatment groups because of the responsive activation of TRPV1 and increased intracellular Ca2+ concentration. No FL signal was observed in the control and laser groups, and LI@HSA treatment exhibited a suboptimal increase in green FL intensity. Subsequently, the quantitative analysis of intracellular Ca2+ concentrations was also investigated by FC. The obtained Ca2+ influx comparison curves of different treatment groups showed the same trend of Ca2+ influx as the CLSM images. The Ca2+ concentration of the CAP@HSA NPs and LCI@HSA groups was almost three and fourfold higher than that of the control group, respectively, in both 143B and HOS cells. The Ca2+ concentration of the LI@HSA group increased nearly 1.61- and 1.57-fold compared with that of the control group in 143B and HOS cells, respectively, indicating that PDT alone could mildly promote Ca2+ influx (Figure 3B,C). Furthermore, the protein expression of TRPV1 was detected by western blot analysis. As shown in Figure 3D,E, TRPV1 expression was significantly upregulated by the CAP@HSA NPs and LCI@HSA treatments in the two OS cell lines. Therefore, these results all demonstrated that our designed nanoplatform CI@HSA NPs could efficiently induce calcium overload in two OS cell lines under NIR irradiation.
2.4 Ability of LCI@HSA to Induce Ferroptosis
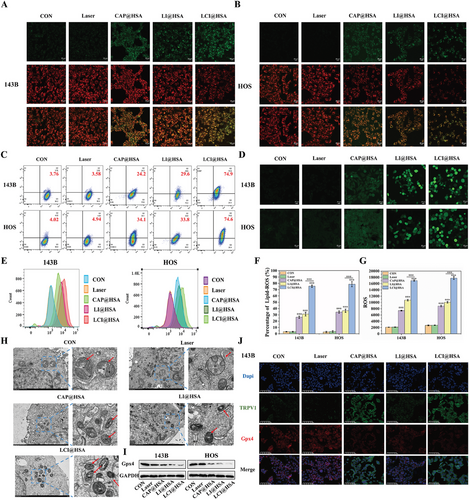
Having established that intracellular Ca2+ overload and the inactivation of Gpx4 cause ferroptosis by disrupting intracellular redox homeostasis, we further investigated whether encapsulating CAP with PDT in albumin nanoparticles could collectively elicit more potent ferroptosis. Lipid-ROS and ROS have both been recognized as crucial biomarkers of ferroptosis related to impaired cell structure and compromised integrity and were used to examine the degree of ferroptosis stimulated by different treatments. Lipid-ROS and ROS were detected by C11-BODIPY and DCFH-DA FL probes, respectively. The red FL signal of C11-BODIPY was converted to green after the lipids were oxidized. As shown in Figure 4A,B, compared with the strongest red FL intensity and weakest green FL intensity in the control and single NIR irradiation treatments, a slight decrease in red FL intensity and a mild increase in green FL intensity were observed after both single CAP and PDT, and these changes were more prominent after combined treatment of CAP and PDT in the two OS cell lines. The specific proportions of C11-BODIPY oxidation states in the two OS cell lines after different interventions were determined by FC. Compared with the control treatment, CAP@HSA NPs increased the oxidation of C11-BODIPY to 26.3%±1.86% and 34.5%±1.88% in 143B and HOS cells, respectively, and the proportions of LI@HSA treatment were 31.3%±2.98% and 36.6%±2.62% in 143B and HOS cells, respectively. The percentages of 143B and HOS cells with high lipid peroxidation after combined treatment were significantly increased to 75.5%±1.87% and 78.7%±4.05%, respectively (Figure 4C,F), indicating that the combination of CAP and PDT could significantly promote the production of Lipid-ROS. In addition, ROS generation was also closely related to PDT efficiency. Compared with the changes produced in the control and laser alone groups in the two OS cell lines, the combination of CAP and PDT with our developed NPs resulted in remarkable FL intensity, while CAP@HSA NPs and LI@HSA treatments alone produced lower green FL intensity compared with that of LCI@HSA treatment. Moreover, we quantitatively analyzed the production of intracellular ROS by FC, and compared it with the control, single treatment of CAP (3.62- and 4.17-fold in the 143B and HOS cells, respectively) or PDT (5.41- and 5.04-fold in the 143B and HOS cells, respectively) exhibited a stronger FL signal, which represented the consequential production of ROS, while the combined treatment of CAP and PDT displayed the strongest FL signal, ≈8.42- and 8.89-fold compared with the control group, indicating excellent ROS generation (Figure 4D,E), which was similarly expressed in CLSM imaging. These findings suggested that CAP increased the intracellular generation of ROS induced by PDT. After treating HOS cells with different interventions, the cells were observed under TEM to identify mitochondrial shrinkage, which is the gold standard for proving the occurrence of ferroptosis. As shown in Figure 4H, the morphology of mitochondria changed significantly in the CAP@HSA NPs, LI@HSA, and LCI@HSA treatment groups compared to the control group. They were more rounded in shape and smaller, and the mitochondrial cristae were reduced or absent. In addition, the expression level of Gpx4 was evaluated by western blot analysis. As illustrated in Figure 4I and Figure S4 (Supporting Information), CAP@HSA NPs and LI@HSA alone reduced the expression levels of Gpx4 compared with the levels in the control group, which decreased more significantly after the combined treatment of CAP and PDT in the two OS cell lines. To further evaluate the expression of Gpx4 and TRPV1 simultaneously, IF images were obtained. As depicted in Figure 4J and Figure S5 (Supporting Information), accompanied by the lack of obvious changes in the control, laser alone, and single PDT treatment, nanoparticle-loaded CAP exhibited a strong green FL signal of TRPV1. Compared to the control and laser groups, a noticeably weak Gpx4 red FL intensity was observed in the CAP@HSA NPs and LI@HSA treatment groups, while the weakest red FL intensity was observed in the LCI@HSA group due to the pro-death effect of CAP-induced ferroptosis. Consistently, the changes in FL intensity were in accordance with the western blot analysis results. As indicated above, the combination of CAP and PDT more effectively induced ferroptosis by increasing the levels of Lipid-ROS and ROS through Gpx4 inhibition and increasing the intracellular Ca2+ content, achieving a synergistic therapeutic effect through mutual ROS promotion in vitro.
2.5 Alleviation of Tumor Hypoxia by CAP@HSA NPs
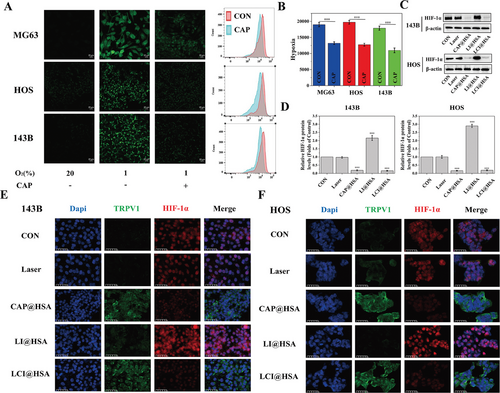
The effects of CAP on intracellular oxygen levels were investigated using Image-iT™ Green Hypoxia Reagent. Confocal images showed that the FL signal was almost undetectable under normoxic conditions (20% O2), whereas the FL signal was enhanced when the cells were incubated for 6 h under hypoxic conditions (1% O2). Treating three OS cell lines (MG63, HOS, and 143B) with CAP for 12 h significantly decreased the hypoxia-induced FL intensity. At the same time, all the cells were subsequently harvested for FC analysis, and the FL intensities of MG63, HOS, and 143B cells treated with CAP were weaker than those of the control cells under hypoxic conditions (Figure 5A,B). Therefore, we believe that the decrease in O2 consumption by CAP-containing HSA NPs could have the ability to relieve tumor hypoxia. In addition, to further investigate the mechanism of the hypoxia-relieving effect in vitro, the expression level of HIF-1α was evaluated via western blot and IF assays after different treatments in vitro. Figure 5C,D shows that HIF-1α expression was downregulated only in the CAP@HSA NPs and LCI@HSA treatment groups compared with the control group due to the hypoxia relief effect of CAP, and no significant changes were observed in the laser group. However, the LI@HSA group promoted HIF-1α expression because PDT consumes oxygen and can exacerbate tumor hypoxia. The IF observations further supported these results. Treatments containing CAP led to a remarkable green FL signal of TRPV1 expression in the cytomembrane and a negligible red FL signal of HIF-1α mostly in the nucleus. In marked contrast, the control and single NIR irradiation groups showed an inappreciable green FL signal of TRPV1 and conspicuous expression of HIF-1α, in which red FL was more significant after a single PDT treatment (Figure 5E,F). In conclusion, encapsulating CAP could alleviate tumor hypoxia to enhance PDT performance in vitro by inhibiting HIF-1α.
2.6 Potential Mechanisms of LCI@HSA-Mediated Ferroptosis and Hypoxia Amelioration
For deeper insight into the potential mechanism by which CAP induces ferroptosis and alleviates hypoxia to enhance PDT, we investigated a nuclear factor (erythroid-derived-like 2, Nrf2). As a transcription factor, Nrf2 regulates the expression of various antioxidant proteins and enzymes, thus protecting tumor cells from oxidative damage,[32] and has also been considered one of the key negative regulators of ferroptosis. Compared to the control group, single NIR irradiation and PDT treatment had no effect on the total protein expression of Nrf2. Despite the inhibition of Nrf2 by released CAP in both the CAP@HSA NPs and LCI@HSA groups, we found that the expression of Nrf2 and its downstream genes, including GCLM, HO-1, and NQO1 in 143B and HOS cells was downregulated after CAP@HSA NPs and LCI@HSA treatments, which was accompanied by a significant upregulation in the expression of the Nrf2 upstream gene Kelch-like ECH associated protein 1 (Keap1) (Figure 6A–F). The nuclear translocation of Nrf2 could suggest resistance to the deleterious effects of hyperoxidation, which further regulates the expression of a series of cytoprotective genes that can resist the deleterious effects of hyperoxidation, promoting the PDT resistance of tumor cells. Therefore, the expression of Nrf2 protein in the nucleus was detected via western blot. The results demonstrated that the LI@HSA group significantly promoted Nrf2 expression compared with the control group, while released CAP downregulated the expression of Nrf2 in the LCI@HSA group and reversed PDT-induced Nrf2 nuclear translocation in the LCI@HSA group (Figure 6A; Figure S6, Supporting Information). In addition, it was found that there was obvious red FL intensity in the cell nucleus after LI@HSA treatment via IF images, demonstrating that PDT enhanced Nrf2 nuclear translocation, which was reversed after LCI@HSA treatment as well, and a similar reduction in Nrf2 expression levels after CAP@HSA NPs treatment was also observed compared to the control and laser groups (Figure 6H). Altogether, these results demonstrated that NPs-released CAP could effectively improve the PDT-mediated defense system by inhibiting the Nrf2 antioxidant defense pathway and manipulating intracellular redox homeostasis in two OS cell lines. Considering the discovery that all of the single and synergistic treatments could inhibit Nrf2 and Gpx4, we determined the expression of SLC7A11, which is one subunit of system XC-, a glutamate/cysteine antiporter that is responsible for maintaining the cellular antioxidant environment. Its low expression is regulated by Nrf2 inhibition and further triggers the inactivation of GPX4. As shown in Figure 6A,G, the expression level of SLC7A11 was mildly decreased in the groups treated with CAP@HSA NPs and LI@HSA alone and significantly downregulated in the synergistic treatment group compared with the control group in the two OS cell lines. Hence, we presumed that the inactivation of Gpx4 by CAP@HSA NPs and LCI@HSA may be related to the inhibition of SLC7A11 mediated by the suppression of Nrf2. The specific mechanism by which LI@HSA inhibits SLC7A11 will be further explored in the future.
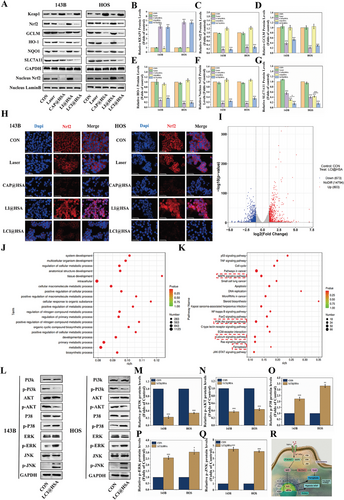
However, as a membrane protein, TRPV1 has difficulty directly regulating cytoplasmic or nuclear proteins, such as Nrf2, Gpx4, and HIF-1α. Therefore, we conducted a preliminary investigation into potential connections between TRPV1/Ca2+ and Nrf2/Gpx4 and HIF-1α after LCI@HSA treatment. A gene expression analysis was conducted, and a total of 1476 differentially expressed mRNAs (673 upregulated and 803 downregulated) were identified in another OS cell line, K7M2 (Figure 6I). Based on these altered genes, Gene Ontology (GO) and Kyoto Encyclopedia of Genes and Genomes (KEGG) pathway enrichment analyses indicated that LCI@HSA treatment activates TRPV1 to inhibit HIF-1α and Nrf2/Gpx4, possibly through the phosphatidylinositol 3 kinase/protein kinase B (PI3k/AKT) and mitogen-activated protein kinase (MAPK) signaling pathways, which are considered keys that connect the transfer of information between the cell membrane and nucleus to maintain intracellular redox homeostasis.[33] More importantly, the calcium signaling pathway and ferroptosis were also significantly enriched in the LCI@HSA treatment group compared to the control group (Figure 6J,K), which was consistent with previous results. Simultaneously, the PI3K/AKT and MAPK signaling pathways were also enriched after LCI@HSA treatment in HOS cells (Figures S7 and S8, Supporting Information). However, there was no significant enrichment of HIF-1α signaling pathways after combination therapy, and the levels of HIF-1α mRNA were also not affected by CAP treatment alone (Figure S9, Supporting Information), indicating that released CAP suppressed the hypoxia-induced elevation of HIF-1α protein expression possibly through posttranscriptional regulation. To confirm whether the PI3K/AKT and MAPK signaling pathways play an important role in the LCI@HSA-mediated killing of OS cells, the expression of vital proteins in the PI3K/AKT and MAPK signaling pathways (PI3K, p-PI3K, AKT, p-AKT, P38, p-P38, ERK, p-ERK, JNK, and p-JNK) was analyzed by western blot. As shown in Figure 6L–Q, compared with the control group, the LCI@HSA treatment group showed remarkable decreases in p-PI3K and p-AKT activity and unmistakable increases in p-P38, p-ERK and p-JNK expression in both 143B and HOS cells. Altogether, these findings suggest that the PI3K/AKT and MAPK signaling pathways are potential mechanisms by which our designed theranostic nanoplatform activated TRPV1 under NIR irradiation to downregulate Gpx4 and HIF-1α to induce ferroptosis and alleviate hypoxia, as presented in Figure 6R.
2.7 FL Imaging of CI@HSA NPs and Antitumor Capacity of LCI@HSA NPs In Vivo
Benefiting from the NIR FL imaging capability of IR780, this dye can be used to monitor the accumulation and distribution of CI@HSA NPs in vivo and further guide synergistic therapy.[25, 26] Hence, CI@HSA NPs were intravenously injected into HOS tumor-bearing mice to evaluate the biodistribution of the CI@HSA NPs in vivo after prolonged periods, which is a prerequisite for effective PDT therapeutic effects. As depicted in Figure 7A, FL images were collected preinjection and 1, 2, 3, 6, 12, 24, 36, 48, 60, and 72 h after injection. The FL signals at tumor sites gradually increased over time and peaked at 48 h postinjection (Figure 7B). Based on FL imaging in vivo, major organs and tumors were also harvested at 48 h postinjection to further determine the biodistribution of CI@HSA NPs for ex vivo FL imaging. Notable accumulation of CI@HSA NPs was found in tumor tissue, where the FL signal was stronger than that of other major organs (heart, liver, spleen, lung, and kidney), which could be attributed to the enhanced permeability and retention (EPR) effect and active intake of the tumor cells. These results reflected the favorable tumor-targeting ability of our prepared nanoplatform and its ability to facilitate the accumulation of CAP and IR780 in tumor tissue (Figure 7C,D).
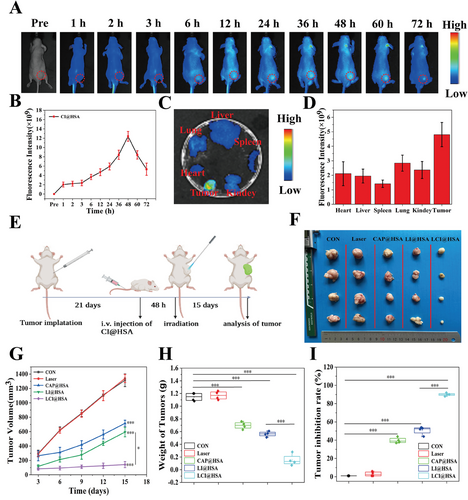
Since a prominent therapeutic effect of the combination treatment with PDT due to CAP-mediated ferroptosis induction and hypoxia relief was observed in vitro, the therapeutic effects were investigated in a xenograft model. Briefly, HOS cells were subcutaneously injected into tumor-bearing BALB/c nude mice, and then the tumor-bearing mice were randomly divided into the abovementioned five groups and received the designated interventions as illustrated in Figure 7E. Considering the FL imaging results in vivo, the tumor regions were irradiated with an NIR laser (808 nm, 2 W cm−2, 6 min) at 48 h postinjection in the groups that needed irradiation. After managing different therapies, images of all the tumors were captured (Figure 7F), and the volumes of the tumors were measured every three days over 15 days during the therapeutic period to evaluate therapeutic outcomes. By monitoring the volume of primary tumors, it was found that the tumors in the control and laser groups grew rapidly as no therapeutic effect was exerted. The CAP@HSA NPs and LI@HSA treatment groups moderately inhibited tumor growth, while obvious tumor growth inhibition was observed in the LCI@HSA group (Figure 7G). Moreover, the variation in tumor weight was measured ex vivo at the end of the treatments and presented a similar trend to the tumor volumes (Figure 7H). The mouse weight fluctuations of all groups were negligible, showing the small side effects of the different NPs during the experimental period in vivo (Figure S10, Supporting Information). Furthermore, the relative tumor inhibition rates of primary tumors were calculated and compared. As expected, the LCI@HSA group showed the highest tumor suppression rate, which was as high as 91.47%, while the CAP@HSA NPs and LI@HSA groups had inhibition rates of ≈44.34% and 51.87%, respectively (Figure 7I), indicating the superior therapeutic efficacy of the combination treatment in a xenograft model.
2.8 Evaluation and Biosafety of Combination Treatment
Tumor tissues were harvested at the end of the treatments for further analysis to evaluate the antitumor efficacy of different treatments. Hematoxylin and eosin (H&E) staining of tumor tissues confirmed that the combination therapy presented the most potent therapeutic efficacy, and single CAP and PDT also exhibited necrosis to some extent, while the control and laser groups showed intact cellular shapes and structures (Figure 8A). Moreover, the expression of proliferation proteins, including PCNA and KI67, as well as typical proteins of tumor ferroptosis and hypoxia such as TRPV1, Gpx4, and HIF-1α, were assayed by IHC and analyzed by ImagePro Plus to obtain the IOD data (Figure 8B–F). The expression levels and IOD values of both PCNA and KI67 in the tumor specimens were lower in the CAP@HSA NPs and LI@HSA groups, while the LCI@HSA group showed the lowest expression levels of these two indicators. Moreover, compared with the other three groups, only treatment with CAP@HSA NPs and LCI@HSA resulted in a significant increase in TRPV1 staining and an apparent decrease in HIF-1α staining of the tumor specimens. The IOD value of HIF-1α in the CAP@HSA NPs and LCI@HSA treatment groups decreased 2.26- and 2.14-fold compared with the control group, confirming hypoxia relief with the assistance of CAP. The IOD value of TRPV1 in the CAP@HSA NPs and LCI@HSA groups was increased by nearly 6.81- and 6.67-fold, respectively, compared with that in the control group. Gpx4 staining of tumor tissues was notably inhibited after single CAP or PDT therapy compared with that of the control group and was further decreased in the combination treatment group. Compared with the control group, the IOD value of Gpx4 was 3.44- and 3.56-fold lower in the CAP@HSA NPs and LI@HSA groups, respectively, and was further decreased by nearly 7.48-fold in the LCI@HSA group, substantiating the occurrence of ferroptosis in vivo. Furthermore, the IF staining results of TRPV1, Gpx4, and HIF-1α were basically consistent with those of IHC staining (Figure 8G). The TUNEL-stained tumor sections further confirmed the therapeutic efficacy of LCI@HSA, which yielded a significantly increased green FL intensity (Figure 8H), suggesting substantial apoptosis of tumor cells. In summary, a highly efficient synergistic antitumor effect was achieved by combining CAP and PDT, suggesting that CAP could be a promising adjuvant for OS PDT in vivo, which is in agreement with the in vitro results.
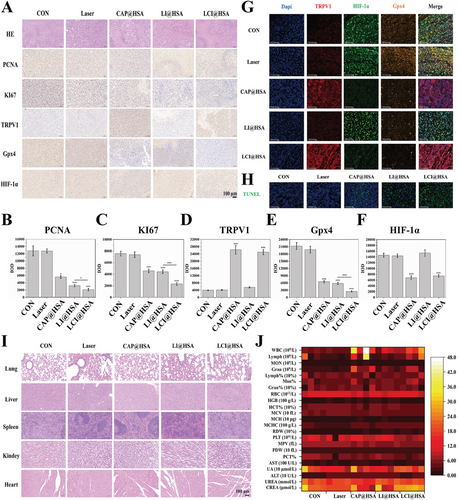
The biosafety of the NPs was a pivotal aspect that needed to be focused on. H&E staining of the heart, liver, spleen, lung, and kidney was conducted at the end of different treatments, and no obvious histopathological lesions were observed (Figure 8I). Moreover, routine blood and biochemical analyses also showed almost no significant changes among the various groups (Figure 8J). Altogether, these findings indicated that CAP induced ferroptosis and provided hypoxia relief, which enhanced PDT performance in a xenograft model. Moreover, our designed novel theranostic nanoplatform CI@HSA NPs had low systemic toxicity and high biocompatibility.
3 Discussion
Considering that the survival rate of patients with OS has reached a plateau through the combination of surgery and other treatments, PDT can serve as a neoadjuvant treatment (NAT) that can be combined with conventional surgery to remove residual tumor cells during palliative treatment of larger tumors, particularly those that are resistant to chemotherapy and insensitive to radiotherapy. The application of targeted recognition technology and nanocarriers has further improved the selectivity and safety of PDT, which provides an effective strategy to overcome the defects of PSs in PDT cancer therapy. Albumin, the most abundant protein in human serum, is applied to various diseases as a drug delivery carrier because of its superior blood retention, high biocompatibility, and wide variety of drug-binding abilities. It has been widely used to extend the half-life, enhance stability, provide protection from degradation, and allow specific targeting of therapeutic agents to various disease states.[34] The outstanding half-life of albumin and its ability to precisely target tumor sites have made albumin an excellent drug carrier system for anticancer agents.[35] Albumin and its various binding sites have been extensively studied.[36] It is actively transported via transcytosis through interaction with various cell surface receptors such as glycoprotein receptors (gp60, gp30, and gp18), a secreted protein acidic and rich in cysteine (SPARC), the megalin/cubilin complex, and neonatal Fc receptors.[37, 38] Furthermore, Abraxane, (an albumin-bound form of paclitaxel manufactured using proprietary nab® technology (nab = nanoparticle albumin-bound) from American Bioscience resulting in a water-soluble galenic formulation that comprises albumin paclitaxel nanoparticles with a diameter of ≈130 nm),[38] has been reported to be effective in osteosarcoma xenografts in vivo.[39] Combined, albumin nanoparticles have been suggested to show prior accumulation ability in tumor cells through various albumin-related phagocytosis pathways. In our experiments, CI@HSA NPs could accumulate in tumor sites resulting from not only the EPR effect but also the active intake of the tumor cells, as demonstrated by cellular uptake experiments; more than 90% of both 143B and HOS cells showed internalization of the nanoparticles. NIR-activated PDT technology has been considered a promising approach for improving cancer treatment because NIR-based PDT can produce higher ROS due to longer wavelength light sources with deeper tumor penetration.[40] Benefitting from its NIR absorption and high singlet oxygen quantum yield, IR780 can effectively influence deeply located tumors such as those found in OS. Several studies have reported the encapsulation of IR780 in serum albumin, although toxic protein cross-linkers were used to cleave the disulfide bond and expose the hydrophobic domains of the protein to bind with the extremely hydrophobic molecule, thus forming nanoscale particles.[29, 41]
Although apoptosis has long been considered the main death mode induced by CAP or PDT,[10, 11, 42] increasing evidence has also indicated that ferroptosis plays a critical role in apoptosis-based tumor cell death.[5, 43] We previously demonstrated that ferroptosis acted as a “death switch” in homologous targeting-associated PDT nanoplatform-induced apoptosis.[26] Another report explained that p53/Ce6@ZF-T on H1299 tumor-bearing mouse-mediated ferroptosis could synergistically sensitize cells to apoptosis.[5] Moreover, a variety of drugs and molecules have been shown to effectively inhibit OS progression by inducing ferroptosis, so we believe that promoting ferroptosis may be an effective method to inhibit tumor progression. The evocation of ferroptosis could be regarded as a promising approach to improve PDT performance in vitro and in vivo. Hence, we mainly focused on evaluating combination therapy to induce ferroptosis in this research, which is desirable to provide valuable help and vital support for current tumor treatment regimens.
As the CAP receptor, TRPV1 is a member of the TRPV subfamily of TRP channels. Stimulation of TRPV1 causes Ca2+ influx through transmembrane ion channels, leading to intracellular Ca2+ overload, which plays an important regulatory role in the proliferation and migration of tumor cells.[44] Another study reported that Ca2+/CaM signaling is a key determinant of erianin-induced ferroptosis to inhibit lung cancer cell growth.[14] As demonstrated in this study, CAP improved the efficiency of PDT-induced ferroptosis against OS through the activation of TRPV1 and Ca2+ influx. To some extent, ferroptosis itself has also been considered a Ca2+ influx process because the accumulation of lipid peroxides induces the formation of ferroptotic pores of a few nanometers on the cell membrane, which are expected to dramatically accelerate Ca2+ influx from the extracellular matrix into tumor cells, ultimately disrupting the osmotic balance and leading to cell death.[13, 45] This process could explain why the elevated intracellular calcium levels were also increased by LI@HSA treatment in our research.
The therapeutic effectiveness of PDT is severely limited due to the apparent hypoxic nature of many solid tumors, which is frequently associated with tumor progression, recurrence, metastasis, and drug resistance.[46] HIF-1 is a potential transcriptional activator that consists of the subunits HIF-1α and HIF-1β, the former of which helps as a master regulator of O2 detection and adaptation, subsequently initiating downstream gene transcription and leading to cellular proliferation and metastasis.[47] Therefore, inhibiting the HIF-1α signaling pathway has been reported to be an effective strategy to overcome hypoxic limitations to achieve optimal PDT outcomes. In our research, we found that CAP blocked HIF-1α expression at the translation level but had no influence on HIF-1α transcription, and the specific mechanism for CAP-mediated HIF-1α inhibition will be further explored in the future.
Based on the KEGG analysis and western blot results, we demonstrated that the mechanism by which this combination therapy promotes ferroptosis and alleviates hypoxia may be regulated by the PI3K/AKT and MAPK signaling pathways. MAPK belongs to the serine-threonine protease family and is a fundamental pathway in cell biology that is mainly composed of extracellular signal-regulated kinase (ERK), c-Jun-N-terminal kinase (JNK), and P38. Moreover, the MAPK signaling pathway has been reported to positively regulate ferroptosis in OS cells.[48] As a serine/threonine protein kinase with oncogenic effects, AKT and its signaling pathway also play crucial roles in many cellular functions such inhibition of AKT activation has been proven to promote ferroptosis or inhibit HIF-1α in various other cancer types.[49] In summary, under the regulation of the AKT and MAPK signaling pathways, CAP and PDT combination treatment significantly downregulated Nrf2/SLC7A11/GPX4, reduced the nuclear translocation of Nrf2, and inhibited HIF-1α.
We have previously demonstrated that the combination of CAP and cisplatin, a traditional chemotherapeutic drug, has strong synergistic inhibitory effects on OS cells by inhibiting cell viability and invasion and inducing cell apoptosis, autophagy, and G0/G1 cell cycle arrest.[11] In this research, we also provided an interesting NIR imaging-guided “pro-death” approach that can promote ferroptosis and relieve hypoxia via CAP to improve the therapeutic effect of PDT against OS. Taken together, these results suggest that CAP could serve as an adjuvant for further OS therapy.
4 Conclusion
With the goal of enhancing PDT efficacy, we successfully constructed a potential theranostic nanoplatform (CI@HSA NPs) with a superior ability to induce ferroptosis and alleviate hypoxia to overcome the deficiency of single PDT therapy. Benefiting from the involvement of CAP, the prepared CI@HSA NPs not only promoted ferroptosis by activating TRPV1-mediated calcium overload and restraining the Nrf2/Gpx4 pathway but also reduced oxygen consumption through the inhibition of HIF-1α in OS cells. Moreover, our results suggested that the underlying mechanisms between TRPV1/Ca2+ and Nrf2/Gpx4 or HIF-1α are initiated by the MAPK (ERK, JNK, and P38) and PI3K/AKT signaling pathways. As a result of the superior NIR FL imaging performance, CI@HSA NPs are also desirable for precise tumor diagnosis and therapy. The administration of CAP and PDT undeniably suppressed xenograft tumor growth in vivo. Based on the high efficiency of NIR imaging-guided combination therapy in OS cells, our work presents a considerable “pro-death” strategy for the induction of ferroptosis and relief of hypoxia to enhance the efficacy of antitumor PDT, which might have potential for innovative cancer treatment approaches in the future.
5 Experimental Section
Reagents
Capsaicin and IR780 iodide were purchased from Sigma‒Aldrich (St. Louis, MO, USA). Human serum albumin was purchased from Yuanda Shuyang Pharmaceutical (Chengdu, China). Soybean oil was purchased from Beiya Medical Oil (Tieling, China). All other chemical reagents and solvents were of analytical grade or above. Singlet Oxygen Sensor Green (SOSG), C-11 BODIPY 581/591 (C11-BODIPY), and Image-iT Green Hypoxia Reagent were purchased from Invitrogen (Carlsbad, CA, USA). Cell-Counting Kit-8 (CCK-8), calcein AM, and pyridine iodide (PI) were purchased from Dojindo Molecular Technologies (Kumamoto, Japan). 4-hydroxyphenyl-fluorescein (HPF) and Dihydrorhodamine 123 (DHR123) were acquired from MCE (USA). RIPA lysis buffer, phenylmethanesulfonyl fluoride (PMSF), a bicinchoninic acid (BCA) protein assay kit, nuclear dye 4,6-diamidino-2-phenylindole (DAPI), 1,1″-dioctadecyl-3,3,3″,3′-tetramethylindodicarbocyanine, 4-chlorobenzenesulfonate salt (DiD), Fluo-4 AM and 2′,7′-dichlorofluorescin diacetate (DCFH-DA) were purchased from Beyotime Biotechnology (Shanghai, China). Rabbit anti-human TRPV1 (cat. 305 299), rabbit anti-human HIF-1α (cat. 179 483), rabbit anti-human Gpx4 (cat. 125 066), rabbit anti-human Nrf2 (cat. 62 352), rabbit anti-human Keap1 (cat. 227 828), and rabbit anti-human HO-1 (cat. 52 947) antibodies were purchased from Abcam (MA, USA). Rabbit anti-human SLC7A11 (cat. 12 691), rabbit anti-human AKT (cat. 4691), rabbit anti-human phospho-AKT (Ser 473) (cat. 4060), the MAPK family antibody sampler kit (cat. 9926) and the phospho-MAPK family antibody sampler kit (cat. 9910) antibodies were purchased from Cell Signaling Technology (Boston, MA, USA). Mouse anti-human TRPV1 (cat. 66983-1-Ig), mouse anti-human NQO1 (cat. 67240-1-Ig), rabbit anti-human GCLM (cat. 14241-1-AP), rabbit anti-human PCNA (cat. 10205-2-AP), rabbit anti-human KI67 (cat. 27309-1-AP), and rabbit anti-human HIF-1α (cat. 20960-1-AP) were acquired from Proteintech Corp (USA).
Nanoparticle Synthesis
The CI@HSA NPs were prepared via the ultrasonic emulsification-solvent evaporation method. In brief, 1.5 mg of CAP, 18 mg of soybean oil, and 0.5 mg of IR780 were dissolved in 400 µL of dichloromethane. Eighty milligrams of HSA was dispersed in 4 mL of deionized water. The dichloromethane solution was then dropped into the aqueous phase, and the mixture was intermittently sonicated at 200 W with a probe ultrasonicator (Xinzhi Biotechnology, Ningbo, China) for 10 min, followed by rapid evaporation using a rotary evaporator. The CI@HSA NPs were obtained by filtration through a 0.22 µm filter membrane.
CAP@HSA NPs were prepared according to the same procedure as above, but 2.5 mg of CAP was used.
IR780@HSA NPs were prepared according to the same procedure as above, but 2 mg of IR780 was used.
Nanoparticle Characterization
The mean particle size and zeta potential of CAP@HSA NPs, IR780@HSA NPs, and CI@HSA NPs were determined by dilution with ultrapure water and measurement with a Malvern Zetasizer (Malvern, NanoZS90, UK). The morphology of the nanoparticles was further examined using transmission electron microscopy (TEM; Field Electron and Ion Company, ON, USA) after staining the samples with uranyl acetate. The encapsulation efficiency (EE%) and drug loading efficiency (DL%) of these three nanoparticles were measured by ultrafiltration. Briefly, nanoparticle solution was added to an ultrafiltration tube (retention capacity of 30 kDa, Merck Millipore UFC803096) and centrifuged at 10 000 rpm for 10 min. The total drug contents and the contents of drugs that were loaded in the nanoparticles were measured by HPLC (methanol:water 80:20, v:v, 30 °C, 280 nm, 1 mL min−1, Kromasil, C18, 5 µ, 150 × 4.6 Vmm, and DIONEX Ultimate 3000, Thermo Scientific, USA) for CAP and by UV absorption for IR780. EE (%) = (weight of drug encapsulated)/(weight of drug added) × 100%. DL (%) = (weight of drug encapsulated)/(weight of nanoparticles in total) ×100%. UV–vis spectra were acquired with a UV–vis spectrophotometer (Thermo Fisher, GENESYS 1XX, USA). In vitro CAP release was conducted by the dialysis method. Briefly, 200 µL of nanoparticles (equivalent to 75 µg CAP) was placed in a dialysis bag (Solarbio, MWCO 2k). The bag was placed in 5 mL of release medium (methanol: PBS, 5:95 (v/v), containing 0.25% Tween 80). An aliquot (500 µL) of medium was taken for HPLC measurement and immediately replaced with 500 µL of fresh medium at each time point. To study the effect of NIR laser irradiation on CAP release, the dialysis bags containing CI@HSA NPs were exposed to NIR irradiation (1.0 W cm−2) for 3 min at 0 and 12 h, respectively. The stability of the coloading nanoparticles was investigated by storing them at 4 and 37 °C for 1 week. Changes in particle sizes were recorded. The in vitro ROS generation of CI@HSA NPs was evaluated by SOSG, HPF, and DHR123 assay. CI@HSA NPs dispersed in PBS containing different probes (12.5 µm) at different IR780 concentrations (1, 2, 3, 4, and 5 µg mL−1) were added to a cuvette and exposed to 808 nm NIR laser irradiation (1.0 W cm−2, 3 min). The FL intensity curves were recorded by using a Shimadzu RF-6000 Fluorescence Spectrometer (SOSG λexcitation = 504 nm; HPF λexcitation = 490 nm; DHR123 λexcitation = 488 nm).
Cell Culture
The OS cell lines 143B, HOS, MG63, and K7M2 were purchased from American Type Culture Collection (ATCC; Manassas, VA, USA) and maintained in DMEM supplemented with 10% FBS, 100 µg mL−1 penicillin and 100 µg mL−1 streptomycin. All cells were incubated at 37 °C in a humidified atmosphere containing 5% CO2.
Cell Viability Assay
Cell viability was measured by the CCK-8 method. Briefly, OS cells were seeded into 96-well plates at a density of 5000 cells per well and incubated overnight to adhere. Then, the cells were incubated with CAP@HSA NPs (final concentration CAP 37.5 µg mL−1) and CI@HSA NPs (final concentration CAP 37.5 µg mL−1, IR780 12.5 µg mL−1) for 12 h and IR780@HSA NPs (final concentration IR780 12.5 µg mL−1) for 2 h. After incubation, IR780@HSA NPs and CI@HSA NPs were exposed to NIR irradiation (laser power: 1.5 W cm−2, 2 min). Finally, 10 µL of CCK-8 was added to each well and incubated for 1 h. The plates with cells were then placed in a microplate reader (Hangzhou Allsheng Instrument Co, Ltd, Hangzhou, China, FlexA-200), and the absorbance at 450 nm was measured. Cell viability was calculated as follows: cell viability (%) = experimental group absorbance value/control group absorbance value × 100%. Furthermore, to visually observe the therapeutic effects after the aforementioned treatments, 5 µm calcein AM (λ excitation/λ emission = 490 nm/515 nm) and 5 µm PI (λ excitation/λ emission = 536 nm/617 nm) were added and stained for 30 min to dye living (green FL) and dead (red FL) cells, respectively, following CLSM observation.
Cellular Uptake of the CI@HSA NPs
Confocal laser scanning microscopy (CLSM; Zeiss LSM900, Germany) and flow cytometry (FC; BD FACS Canto II, USA) were used to evaluate the cellular uptake of HSA NPs. Typically, 143B and HOS cells (1 × 10⁵/dish) were seeded into a confocal cell culture dish. After cell adherence, the culture medium was replaced with a serum-free medium containing 50 µg mL−1 HSA NPs (stained with DiD, λ excitation/λ emission = 644 nm/665 nm) for 1 and 2 h. Then, the cells were fixed with 4% formaldehyde for 10 min and stained with DAPI (λ excitation/λ emission = 364 nm/454 nm). FL images were directly captured by CLSM. Moreover, the cellular uptake of CI@HSA NPs at 1 and 2 h intervals was quantitatively analyzed by FC.
In Vitro Ca2+ Influx Measurement
After different treatments, Ca2+ influx, which is increased by CAP-activated TRPV1, was monitored in real-time using the FL probe Fluo-4. 143B and HOS cells (1 × 10⁵/dish) were seeded into a confocal cell culture dish. After cell adherence, the medium was replaced with different treatments: a) Control: serum-free medium, b) Laser, c) CAP@HSA NPs (final concentration CAP 37.5 µg mL−1) for 12 h coincubation, d) IR780@HSA NPs (final concentration IR780 12.5 µg mL−1) for 2 h following NIR irradiation, and e) CI@HSA NPs (final concentration CAP 37.5 µg mL−1, IR780 12.5 µg mL−1) for 12 h following NIR irradiation (laser power: 1.5 W cm−2, 2 min). Then, after coincubation with 2 µM Fluo-4, FL images, and signals were directly observed and analyzed with CLSM and FC, respectively.
Hypoxia Detection
Hypoxia-conditioned cells were stained using Image-iT Green Hypoxia Reagent (λ excitation/λ emission = 488 nm/520 nm), a fluorescent hypoxia probe that fluoresces in response to reduced oxygen levels. After treatment with 30 µg mL−1 CAP alone for 12 h under hypoxic conditions, the three OS cell lines (MG63, HOS, 143B) were coincubated for 4 h with the hypoxia reagent (5 µm) for the evaluation of O2 consumption by imaging and analysis through CLSM and FC.
Intracellular ROS and Lipid-ROS Measurements
Intracellular ROS and Lipid-ROS were detected using DCFH-DA (λ excitation/λ emission = 488 nm/530 nm) and C11-BODIPY, respectively. Oxidized C11-BODIPY displayed green fluorescence (λex: 485 nm/λem: 520 nm). Typically, 143B and HOS cells (1 × 10⁵/dish) were seeded into a laser confocal cell culture dish. After cell adhesion, the medium was replaced with serum-free medium with or without NPs (37.5 µg mL−1 CAP@HSA NPs and 50 µg mL−1 CI@HSA NPs followed by incubation for 12 h, and 12.5 µg mL−1 IR780@HSA NPs incubated for 2 h). Then, the cells needed a laser with 808 nm NIR irradiation at a power density of 1.5 W cm−2 for 2 min. Furthermore, the cells were incubated in a serum-free medium containing 10 µm DCFH-DA or 2 µm C11-BODIPY in the dark at 37 °C for 30 min. Finally, the cells were immediately observed by CLSM to determine the intracellular ROS and lipid-ROS levels, treated with trypsin, and collected in 300 µL of PBS for FC detection.
Transmission Electron Microscopy (TEM)
Ferroptosis induction was assessed by examining mitochondrial morphology after different interventions. HOS cells were seeded overnight to allow adherence and then treated with various groups (control, laser alone, CAP@HSA NPs, IR780@HSA NPs, and LCI@HSA NPs (CAP: 37.5 µg mL−1 IR780: 12.5 µg mL−1)). Next, the cells were trypsinized, collected, and fixed with 2.5% glutaraldehyde and 1% osmic acid. The cells were then dehydrated with gradient ethanol and acetone, embedded, sliced, and stained with 3% uranyl acetate lead citrate. Finally, the cells were examined by TEM (HITACHI HT7700, JEOL, Japan).
Western Blot
After 143B and HOS cells were treated with different regimens for a specified time, they were lysed in RIPA lysis buffer containing PMSF and phosphatase inhibitors to extract total intracellular proteins. Protein samples (40 µg per lane) were separated on 10% or 12.5% gels by SDS‒PAGE, transferred onto polyvinylidene fluoride (PVDF) membranes, blocked with 5% skim milk at room temperature for 1 h, and then incubated with the corresponding primary antibodies (1:1000 for TRPV1, Gpx4, Keap1, Nrf2, NQO1, HO-1, GCLM, AKT, p-AKT, ERK, p-ERK, JNK, p-JNK, P38, p-P38, 1:800 for HIF-1α, PI3K, p-PI3K) at 4 °C overnight. The membrane was rinsed with Tris-buffered saline Tween-20 (TBST) and incubated with a secondary antibody (1:5000) at room temperature for 1 h. Finally, an enhanced chemiluminescence (ECL) detection system was used to detect the bands of immunoreactive proteins on the membrane.
Immunofluorescence (IF) Analyses
After different interventions, 143B and HOS cells were fixed with 10% formalin and incubated with 0.2% Triton X-100 in PBS for 10 min followed by 5% bovine serum albumin (BSA) for 60 min at room temperature. The slides were then incubated with rabbit anti-Gpx4 antibody (1:100), rabbit anti-HIF-1α antibody (1:100), rabbit anti-Nrf2 antibody (1:100), or mouse anti-TRPV1 antibody (1:50) at 4 °C overnight. After washing with PBS, the slides were incubated with the corresponding secondary antibody for 60 min at room temperature. Slides were stained with DAPI and cover-slipped, and FL images were captured using a fluorescence microscope (CKX53, Olympus Corporation, Japan). Triple IF was performed according to the manufacturer's instructions (AFIHC024, China).
RNA Sequencing Analysis
RNA samples were collected from OS cells using a TRIzol Plus RNA purification kit. Then, library construction and sequencing were performed using the NovaSeq 6000 platform (Illumina). Subsequently, the differential expression of genes was analyzed by DESeq (1.30.0) with the following screening parameters: expression differences |log twofold Change| > 1 and significant p-value < 0.05. TopGO was used to perform GO enrichment analysis on the differentially expressed genes, and ClusterProfiler (3.4.4) software was used to carry out KEGG pathway enrichment analysis of the differentially expressed genes. Both of these analyses focused on the significantly enriched pathways with a p-value < 0.05. In vitro assays were performed on ice to exclude the therapeutic effect of PTT.
FL Imaging/Biodistribution of the CI@HSA NPs In Vivo
HOS tumor-bearing mice were intravenously injected with suspensions of CI@HSA NPs (1 mg mL−1, 200 µL). Subsequently, NIR FL images were collected preinjection and 1, 2, 3, 6, 12, 24, 36, 48, 60, and 72 h postinjection, and the relative FL intensity of each tumor region was measured with an IVScope 8200 (China). Ex vivo imaging was performed on the major organs (heart, liver, spleen, lung, and kidney) and tumor tissues at 48 h postinjection to detect the biological distribution of the CI@HSA NPs. The corresponding FL intensities were also quantified using FL analytic software.
In Vivo Synergistic Tumor Therapy
All male BALB/c nude mice were purchased from Vital River Laboratory Animal Technology Co., Ltd. (Beijing, China). To evaluate the antitumor effect of synergistic therapy in vivo, HOS tumor-bearing mice were established by subcutaneous injection of 200 µL aseptic PBS suspension with a density of 106 cells. After the tumor volumes reached 50 mm3, different treatments were initiated. Mice were randomly separated into five groups as follows: 1) control, 2) laser only, 3) CAP@HSA NPs (20 mg kg−1), 4) laser+IR780@HSA NPs (LI@HSA) (6.67 mg kg−1), and 5) laser+CI@HSA NPs (LCI@HSA) (equivalent to a CAP dose of 20 mg kg−1, and an IR780 dose of 6.67 mg kg−1) (laser power: 2 W cm−2, 6 min of irradiation). In order to avoid PTT interference as much as possible, the nude mice were treated with ice baths before NIR irradiation. After 1 min of NIR irradiation, the temperature of the tumor region was kept below 42 °C by interval cooling to ensure that all of the effects were caused by PDT only, and the temperature of the tumor area during irradiation was monitored using the Xenogen IVIS spectral imaging system (PerkinElmer, USA) (Figure S11, Supporting Information). The tumor sizes and mouse weights were measured every 3 days for 15 days after treatment, and tumor volumes were calculated according to the following formula: 1/2×a2b (where a is the short axis and b is the long axis of the tumor). Mice were sacrificed under anesthesia on day 15, and the xenograft tumors were weighed and analyzed.
After the xenograft tumors were harvested and fixed with 10% formalin for histopathological studies, the tissues were dehydrated in gradient ethanol and xylene, embedded in paraffin, sliced into sections, and stained with hematoxylin–eosin (H&E). The expression of PCNA, KI67, TRPV1, Gpx4, and HIF-1α in xenograft tumor tissues was evaluated by immunohistochemistry (IHC). The specific IHC procedures were reported previously and tumor sections were blocked and immunostained with the aforementioned antibodies (1:200). Finally, images were acquired using a microscope, and relative protein expression was evaluated by counting the number of positive cells from five randomly selected fields in the residual viable tumor tissue among the necrotic areas under a light microscope at a magnification of 200×. ImagePro Plus was used to analyze the aforementioned IHC images to obtain integrated optical density (IOD) data. After paraffin-embedded tissue sections were prepared, TUNEL stain was added for 20 min of coincubation followed by staining with DAPI.
Biosafety Assessment of Synergistic Treatment
To assess the biosafety of different therapies, blood samples were collected from the mice in different groups after sacrifice and sent for blood index (routine blood, biochemistry) analyses. Moreover, the hearts, livers, spleens, lungs, and kidneys of mice were harvested and fixed with 10% formalin for histopathological studies.
Statistical Analysis
All data were expressed as the mean ± SD and were analyzed with SPSS 22.0 software. Student's t-test and one-way ANOVA were employed to evaluate the statistical analysis. Significance levels of *p < 0.05, **p < 0.01, and ***p < 0.001 indicate statistically significant differences between different groups.
Acknowledgements
Y.W. and X.Z. contributed equally to this work. This work was supported by grants from the National Natural Science Foundation of China (81871611 and 82303712), the Finance Science and Technology Program of Sichuan Province (2022YFS0602), Hainan Province Science and Technology Special Fund (ZDKJ202004 and ZDKJ2021038), the Foundation of Sichuan Provincial People's Hospital (2022QN43, YG2301, and 2023HX014), China Postdoctoral Science Foundation (2023M740520), the Natural Science Foundation of Chongqing (CSTB2022NSCQ-MSX0103), and the Special Financial Aid to the Post doctor Research Project of Chongqing (2022CQBSHTB3079). All animal care and experimental procedures were approved by the National Regulation of China for Care and Use of Laboratory Animals and approved by the Institutional Animal Care and Use Committee of Sichuan Province People's Hospital.
Conflict of Interest
The authors declare no conflict of interest.
Open Research
Data Availability Statement
The data that support the findings of this study are available from the corresponding author upon reasonable request.


