Synthesis of Free-Standing Tin Phosphide/Phosphate Carbon Composite Nanofibers as Anodes for Lithium-Ion Batteries with Improved Low-Temperature Performance
Abstract
Free-standing tin phosphide/phosphate carbon composite nanofiber mats of unique nanostructure have been successfully synthesized by electrospinning and partially reducing the phosphate-containing precursors. An unusual effect of the Sn:P molar ratio in the precursor solution on the structure and physical-electrochemical properties of the material is observed. Physical characterizations, including X-Ray diffraction (XRD), Raman spectroscopy, X-Ray photoelectron spectroscopy (XPS), scanning electron microscopy (SEM), and transmission electron microscopy (TEM), confirm the formation of tin phosphide/phosphate nanoparticles of P-rich inner SnxP layer and Sn-rich outer layer uniformly distributed within carbon nanofiber matrix when the Sn:P=1:1. The prepared material is tested as an anode material for lithium-ion batteries and it retains 1141 mAh g−1 charge capacity after 300 cycles at a current density of 250 mA g−1 with almost 100% Coulombic efficiency at room temperature. Furthermore, it demonstrates six times higher capacity (846 mAh g−1) at 0 °C compared to a commercial graphite anode and stable cyclability at −20 °C and 50 mA g−1. Post-mortem ex situ XRD and SEM analyses confirm the structural stability of the designed material and the formation of a uniform stable solid electrolyte interphase layer even after 100 cycles at 50 mA g−1.
1 Introduction
Graphite anode is admitted as one of the critical limiting factors for applying lithium-ion batteries (LIBs) in low-temperature (LT: 0 °C and below) environments.[1, 2] As an alternative, tin compounds, such as tin oxide (SnO2), exhibit much better LT performance owing to the unique allotropic changes of tin facilitating increased reversibility of lithiation-delithiation reactions at low temperatures.[3] Tin phosphide (SnxP) has higher electrical conductivity, showing relatively good metallic features compared to SnO2, which potentially could facilitate its LT performance.[4] Moreover, it possesses a lower activation barrier for the formation of lithium phosphide (Li3P) compared to lithium oxide (Li2O), and the electronic conductivity of the formed Li3P (≈1 × 10⁻⁴ S cm−1) is much higher than that of Li2O (≈5 × 10⁻⁸ S cm−1) further accelerating the kinetics of electrochemical reactions at room temperature.[5, 6] However, to the best of our knowledge, the LT performance of SnxP as an anode for LIBs has not been reported so far.
The theoretical capacities at room temperatures for different compositions of SnxP are as follows: Sn – 994 mAh g−1; Sn4P3 – 1130 mAh g−1; SnP – 1340 mAh g−1; and SnP3 – 1616 mAh g−1.[6] On the other hand, achieving and maintaining these capacities are compromised by insufficient lithium-ion conductivity and high volume expansion. Furthermore, activation of the reversible electrochemical reactions takes some time accompanied by a rapid capacity decay in the initial tens or hundreds of cycles followed by its rise cycle by cycle.[7] Different approaches have been reported to address the above-mentioned drawbacks including downsizing of the particle size and carbon coating, mainly aiming at shortening the lithium-ionic path and buffering the volume expansion.[7-11] Combining binary compounds with polyanionic phosphates is another promising approach, as they can stabilize the structure and provide migration channels for “guest” ions, further improving the electrochemical performance.[12] Furthermore, tin phosphate (SnxPO4) itself showed improved LT performance compared to commercial graphite.[13] One of the reasons may be lithium phosphate (Li3PO4) formed after the lithiation of phosphates, which is believed to be a good conductor of lithium ions.[14] However, to the best of our knowledge, a combination of tin phosphides with phosphates has not been studied so far.
Among different morphologies for improved LT anode materials, free-standing carbon composite nanofibers showed promising properties owing to facilitated electron conduction, maintained the structural integrity of active materials, and enhanced charge-transfer efficiency.[15-17] On the other hand, there is no report on the LT performance of Sn-based nanofibers as anode materials for LIBs. Generally, there are only a few works on the synthesis of SnxP/C carbon composite nanofibers. Ran et al. synthesized Sn4P3@Porous carbon nanofiber as a self-supported anode for sodium-ion batteries.[18] Yadav et al. electrospun nanofibers of SnP0.94 nanoparticles encapsulated in a carbon matrix.[6] A capacity of 750 mAh g−1 was achieved at a current density of 100 mA g−1 for the composite containing 51 wt% carbon. However, in both cases, the composite was prepared by an additional phosphorization step of Sn-embedded carbon nanofibers obtained by electrospinning with heat treatment steps (stabilization and reduction).
Recently, the possibility of a direct synthesis of transition metal phosphides from corresponding phosphates using polyvinylpyrrolidone (PVP) polymer as a carbon source was observed and successfully utilized to synthesize cobalt phosphide/phosphate carbon (CoxP/Co3(PO4)2/C) composite nanofibers.[19] In this work, free-standing tin phosphide/phosphate carbon composite nanofiber mats of complex composition and unique microstructure were synthesized directly from the phosphate-containing precursor solutions by facile one-pot electrospinning with heat treatment and applied as alternative anode materials for LT LIBs for the first time. The effect of the Sn:P molar ratio on the physical and electrochemical properties of the prepared materials was investigated and compared with that of the P-free pure Sn sample at different temperatures. Furthermore, the activation mechanism of the designed electrodes at low temperatures was studied.
2 Results and Discussion
2.1 Synthesis of Free-Standing Tin Phosphide/Phosphate Carbon Composite Nanofiber Mats
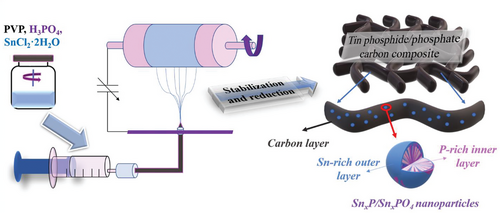
Free-standing tin phosphide/phosphate carbon composite nanofiber mats were synthesized by electrospinning with heat treatments as illustrated in Figure 1.
As can be seen from Figure 2a, the X-Ray diffraction (XRD) patterns of the sample, prepared from the solution without a P source, corresponds to a tetragonal Sn with a space group I41/amd. Adding P leads to a shift of Sn peaks to the higher angles, possibly implying the formation of P-doped Sn and SnxP.[11] At an Sn:P molar ratio of 1:1, additional small-intensity peaks of tetragonal SnP with a space group of I4mm appear at 27.65° and 33.04°. However, after further increment of the P content, all crystalline peaks disappear, confirming the formation of an amorphous structure. Increments of the H3PO4 content in the precursor solution to an Sn:P molar ratio of more than 1:1.3 lead to difficulties in preparing uniform fibers of good flexibility (Figure S1, Supporting Information). Since the 1:1 sample annealed at 600 °C also show an amorphous structure and SnP peaks disappear after annealing at 800 °C (Figure S2a, Supporting Information), 700 °C is admitted as an optimal annealing temperature.
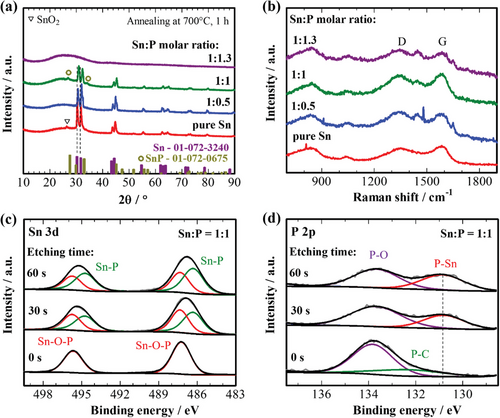
Figure 2b shows the Raman shifts of different samples. All samples possess typical D and G bands at 1347 and 1588 cm−1, respectively, implying the formation of graphitic carbon.[22] The highest graphitization degree of carbon is observed for pure Sn and 1:1 samples with the lowest ID/IG ratio (Table 1). Additional small-intensity peaks of phosphate appear at around 950 cm−1 on the spectra of P-containing samples when Sn:P molar ratio is equal to or higher than 1:1, implying the presence of residual SnxPO4. The absence of this peak in the 1:0.5 sample may indicate its complete reduction. Additional peaks between D and G bands at 1444 cm−1 in the spectra of P-containing samples represent -CH2- stretching common for P- and/or Sn-containing compounds.[23, 24] Such compounds could be formed during the high-temperature evaporation of P and Sn, as the corresponding peak disappears in the sample annealed at 600 °C and intensifies at 800 °C (Figure S2b, Supporting Information). According to the CHNS analysis results, the carbon content increases with the addition and increment of the P content but decreases back when the ratio reaches 1:1.3, varying from 48.56 to 56.83 wt% (Table 1). It could be attributed to the decomposition features of the H3PO4-reach precursor fibers during annealing, as H3PO4 has a catalytic effect on the decomposition and carbonization of PVP.
| Sn:P molar ratio | Raman ID/IG | Carbon content [wt%] | Possible composition |
|---|---|---|---|
| Pure Sn | 0.96 | 48.56 | Sn/C |
| 1:0.5 | 1.02 | 52.91 | Sn-P/SnxP/C |
| 1:1 | 0.98 | 56.83 | Sn-P/SnxP/SnxPO4/C |
| 1:1.3 | 1.02 | 50.41 | SnxP/SnxPO4/C |
Figure S3a, Supporting Information presents the Sn 3d X-Ray photoelectron spectroscopy (XPS) spectra of various samples derived from electrospinning solutions containing different Sn:P molar ratios. In the pure Sn sample, a distinct peak corresponding to metallic tin appears at ≈485 eV. However, upon introducing a P source, this metallic tin peak becomes indiscernible. The absence of metallic tin signals in the XPS spectra of P-containing samples provides further evidence for the formation of P-doped Sn (denoted as Sn-P) and SnxP compounds. Moreover, a shift towards higher binding energies in the prominent peak originating from the surface oxidation layer (≈496 eV) confirms alterations in the surface chemistry. Additionally, the intensity of the P–O band arising from the surface oxidation layer, along with residual SnxPO4, increases as the P content rises (Figure S3b, Supporting Information).
To reconfirm the formation of the SnxP and the presence of SnxPO4 in the 1:1 sample, an XPS depth study was performed, and the results are shown in Figure 2c,d. On the Sn 3d XPS spectra, a shift from 495.6 and 487.3 to 495.1 and 486.8 eV is observed after surface etching due to the appearance of the SnP peak and its intensification.[11] The formation of the SnP is more obvious from the phosphide peak that appeared at 130.1 eV on the P 2p XPS spectra in Figure 2d. The presence of a P–O bond at 133.8 eV even after etching confirms the residue of some SnxPO4 phase. An additional peak of the P–C bond is observed before etching at 132.5 eV, reconfirming the formation of P-doped carbon during the evaporation of phosphorus upon high-temperature annealing.[19] The fact of phosphorus evaporation is clear from the EDS mapping and elemental composition of the sample surface after annealing at different temperatures presented in Figure S4 and Table S1, Supporting Information, respectively. From these results, the formation of tin phosphide/phosphate carbon composites with a gradient concentration of phosphorus could be confirmed with a P-rich inner SnxP layer and a Sn-rich outer layer (Figure 1). Such a structure is expected to possess improved electrochemical properties, as a combination of a small amount of Sn with SnxP has been proven as an effective approach to stabilize the cycle performance of SnxP.[25] Notably, no peak of P-doped carbon is observed in the 1:1.3 sample in Figure S3b, Supporting Information, implying restricted evaporation of phosphorus upon increasing H3PO4 content in the precursor solution. Based on these results, the effect of the Sn:P molar ratio on the possible compositions of the samples can be reconfirmed and summarized in Table 1.
The morphology of the materials was observed by scanning electron microscopy (SEM). All samples possess a uniform fibrous structure (Figure 3a). Pure Sn nanoparticles of about 50 nm are mainly decorated on the surface of carbon nanofibers in the P-free sample. However, such nanoparticles disappear after introducing H3PO4 to the precursor solution, suggesting their encapsulation within carbon nanofibers. This fact is reconfirmed by the transmission electron microscopy (TEM) images in Figure 3b. Aggregates of nanoparticles of about 20 nm are encapsulated in the carbon nanofibers when Sn:P molar ratio is equal to 1:0.5. Increasing the P content leads to the formation of finer nanoparticles of about 5–10 nm with a more uniform distribution within the fiber. Furthermore, nanoparticles in the prepared composite have enough room within the carbon fiber matrix for mitigating the volume expansion upon lithiation, keeping the structural integrity, and expanding the cyclic stability. Too fine nanoparticles in the case of the 1:1.3 sample could be a possible reason for the absence of crystalline peaks in its XRD patterns in Figure 2.
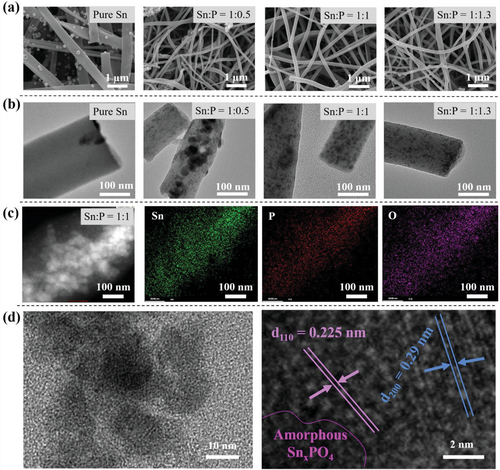
Figure 3c shows energy-dispersive spectroscopy (TEM-EDS) elemental mapping in a single fiber of the 1:1 sample. Sn mapping overlaps well with P and O mappings, reconfirming the formation of tin phosphide/phosphate within the carbon nanofiber matrix. From high-resolution TEM images in Figure 3d, the encapsulation of nanoparticles of different crystallinity in the amorphous carbon matrix can be observed. The dark-colored amorphous phase could be attributed to SnxPO4, while different interplanar spacings of 0.225 and 0.29 nm imply the (110) plane of SnxP and (200) plane of P-doped Sn, respectively.[10, 26]
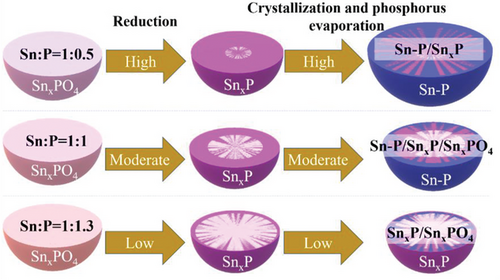
Figure 4 illustrates the possible effect mechanism of the Sn:P molar ratio on the composition and particle size of samples. The formation of the finer nanoparticles with an increase of the H3PO4 content could be attributed to the formation of a strong phosphate carcass that interacted with functional groups of PVP and formed isolated nucleation sites for the restricted growth of particles.[27, 28] Lack of phosphate anions in the precursor structure, on the other hand, allows free diffusion of ions, growth of bigger particles, and phosphorus evaporation.
2.2 Electrochemical Properties of Free-Standing Tin Phosphide/Phosphate Carbon Composite Nanofiber Mats at Room Temperature
Figure 5a demonstrates cyclic voltammetry (CV) curves of the samples prepared from electrospinning solutions with different Sn:P molar ratio at a scan rate of 0.1 mV s−1. The CV curves of the 1:1 and 1:1.3 P-containing samples are typical for the SnxP and SnxP/C composites (Figure S5b,c, Supporting Information).[29] Additional broad peaks at higher potential regions could be responsible for the reversible lithiation of SnxPO4 with the further formation of Li3PO4 and Sn (1).[30] Wide peaks that appear between 1.1 and 0.35 V during the cathodic scan indicate a multi-step reaction that involves Li+ intercalation into SnP and conversion of the intercalation products to Sn and Li3P phases (2).[7] As observed in the cathodic scan, for the pure Sn sample three small peaks located below 0.5 V can be attributed to the alloying reaction between lithium and tin, forming LixSn alloys (3), while a peak located at 0.8 V might be a sign of a solid electrolyte interphase (SEI) formation and which disappears in the consequent cycles (Figure S5a, Supporting Information).[31] On the other hand, the shape of the CV curves of the 1:0.5 sample looks more like a mixture of that of SnxP and free Sn (Figure S5d, Supporting Information) with a lack of SnxPO4, which could cause a smaller shift of Sn peaks on its XRD pattern and smaller intensity of phosphate peak on the Raman spectrum in Figure 2. During the first anodic scan of the pure Sn sample, four oxidation peaks between 0.4 and 1.0 V are assigned to the delithiation process of LixSn alloys that are reversible (4).[32] The anodic peaks at 0.5, 0.6, and 1.21 V on the CV curves of the P-containing samples suggest a stepwise delithiation process of LixSn, Li3P, and Li3PO4 phases with conversion to tin phosphide/phosphate (5) and (6).
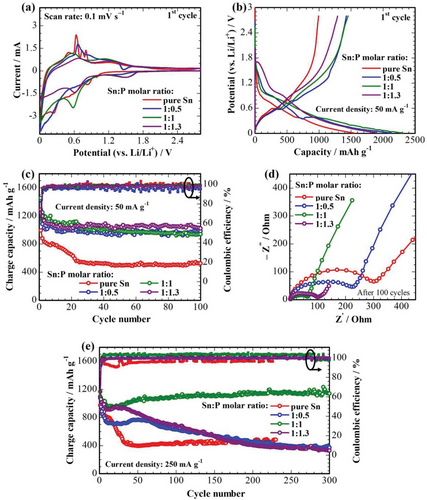
The capacity of the tin phosphide/phosphate carbon composite anodes strongly depends on their composition, morphology, and microstructure. The difference in charge-discharge curves in Figure 5b also confirms the changes in the composition of the electrodes compared to pure Sn, although changes in microstructure in Figure 3b could be another reason. The highest initial discharge and charge capacities of 2313 and 1453 mAh g−1, respectively, have been achieved at 50 mA g−1 for the 1:1 sample. In contrast, a pure Sn sample has only 992 mAh g−1 reversible capacity, which is very close to its theoretical value. Furthermore, it has poor cyclability with a rapid capacity degradation in the initial 20 cycles, retaining only 524 mAh g−1 capacity after 100 cycles (Figure 5c). It could be because of a significant volume expansion and detachment of Sn particles from the surface of carbon fibers. Introducing P leads to higher reversible capacities and more stable cycle performance than for pure Sn samples. All three P-containing samples have retained almost similar charge capacities of about 940 mAh g−1 after 100 cycles at 50 mA g−1 with 100% Coulombic efficiency.
Figure 5d shows the Nyquist plots of samples after 100 cycles that consist of two semicircles at low-to-medium frequency regions implying resistances coming from the SEI (RSEI or Rsurface) and charge transfer (Rct), and an oblique straight line at a high-frequency region corresponding to the Warburg impedance (W) (Figure S6, Supporting Information). As it can be seen from Table 2, the pure Sn sample possesses the highest Rct, probably because of the loss of good contact between the Sn nanoparticles and carbon fibers upon the volume expansion during lithiation. Introducing P and increasing its content reduce the Rct significantly. Despite the similarities in the cycle performance and retained capacity of P-containing samples, the 1:1 sample exhibited the lowest overall resistance.
| Sn:P molar ratio | Rs [Ω] | RSEI [Ω] | Rct [Ω] |
|---|---|---|---|
| Pure Sn | 2.96 | 34.81 | 210.4 |
| 1:0.5 | 4.66 | 51.2 | 124.0 |
| 1:1 | 5.76 | 31.1 | 14.41 |
| 1:1.3 | 4.59 | 43.33 | 44.43 |
Figure 5e shows the cycle performance of the samples cycled at a current density of 250 mA g−1 at room temperature. Despite a small capacity decay within the initial 20 cycles, the sample of 1:1 ratio shows the best electrochemical performance with further cycle-by-cycle increasing capacities and stabilization at 1141 mAh g−1 at the 300th cycle. Such a trend is typical for the SnxP anode and can be explained by the activation of the electrode.[7] On the other hand, the samples of 1:0.5 and 1:1.3 ratios have much lower stability, probably originating from higher resistances that compromise the fast transfer of electrons and lithium ions.
The stability of the prepared samples was checked by post-mortem ex situ characterizations after 100 cycles as an anode for lithium-ion batteries at a current density of 50 mA g−1 at room temperature. Figure S7a, Supporting Information shows the XRD patterns of the samples prepared from electrospinning solutions with different Sn:P molar ratios after the 100th charge. The crystallinity of samples has almost not changed (except for the 1:1.05 sample), indicating their good structural stability. The absence of 50-nm nanoparticles (observed in Figure 3a) on the surface of deformed nanofibers of a pure Sn sample in Figure S7b, Supporting Information confirms their detachment during cycling which could be responsible for its rapid capacity decay. The appearance of additional nanoparticles of smaller sizes may indicate the expansion of partially encapsulated particles. Even though, well-encapsulated nanoparticles can still be observed within the nanofiber matrices of all samples in Figure S7c, Supporting Information. On the other hand, unlike other P-containing samples, preservation of the original fibrous morphology and formation of a uniform SEI layer on the surface of the 1:1 sample can be observed. These results confirm the structural stability of the designed materials and the formation of a uniform stable SEI layer facilitating fast charge transfer even after 100 cycles. The improved performance of the 1:1 sample compared to other samples can be attributed to the synergistic effect of P-doped Sn, SnxP, and SnxPO4, and the uniform distribution of fine nanoparticles of sufficient crystallinity within the carbon fiber matrix.
2.3 Low-Temperature Performance of Free-Standing Tin Phosphide/Phosphate Carbon Composite Nanofiber Mats
The electrochemical properties of the free-standing tin phosphide/phosphate carbon composite nanofiber mats, prepared from electrospinning solutions with different Sn:P ratios, were further investigated at 0 and −20 °C. Figure 6a,b show the initial potential profiles at 25 mA g−1 at 0 and −20 °C, respectively. All potential plateaus of the samples at these temperatures resemble the profiles obtained at room temperature with a small shift in potential, which might be ascribed to a high overpotential due to the slower diffusion of ions at lower temperatures. Despite lowering the operating temperature to 0 °C, all samples have high initial discharge and charge capacities of above 1500 and 950 mAh g−1, respectively. The highest reversible capacity of 1200 mAh g−1 is achieved for the sample with a ratio of 1:1.
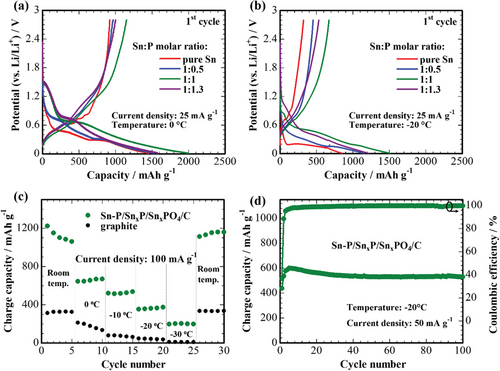
The temperature-capability of the 1:1 sample at 100 mA g−1 is shown in Figure 6c in comparison to the commercial graphite anode. The developed electrode maintains about 200 mAh g−1 capacity even at −30 °C, while commercial graphite completely loses its lithium storage capability at −20 °C. The decreased capacities result from the sluggish kinetics of the electrodes and the contribution from the electrolyte at low temperatures, which hinders the fast lithium-ion diffusion. However, the fact that the capacity values of the developed electrode largely exceed those for graphite anode at low temperatures, allows us to assume that the approach described in this work opens the perspectives to target the LT performance issues of the electrode materials for LIBs. Furthermore, an intriguing phenomenon of an inverse increase in capacity at subzero temperatures is observed for the developed material. This phenomenon is not uncommon for tin phosphides, even at room temperature, and is attributed to the gradual activation of the electrode with each subsequent cycle.[7] The observation of such a trend at subzero temperatures provides further evidence for the promotion of electrode activation and the reversibility of electrochemical reactions facilitated by low temperatures. It is speculated that the underlying mechanism behind this behavior could be related to allotropic changes of tin, resulting in the formation of α-Sn that enhances the ionic conductivity within the material.[3]
Figure 6d shows the cycle performance of the developed electrodes at −20 °C and 50 mA g−1. After the increase of the capacity in the initial five cycles, the sample shows stable cycle performance up to 100 cycles retaining 580 mAh g−1 capacity with about 100% Coulombic efficiency. The inverse increase of the capacity in the initial five cycles could probably be attributed to the activation of the electrode with gradual stabilization of the SEI layer at low temperatures.
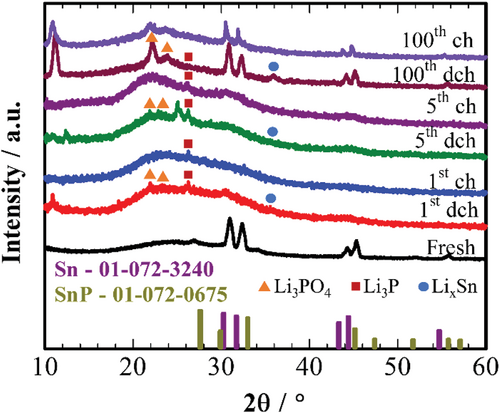
Ex situ surface analysis was conducted after charge–discharge states of different cycles at 50 mA g−1 at −20 °C to find out the nature of the activation processes in the initial five cycles. Cycled cells were disassembled in the glove box, the electrodes were washed with DMC solvent and dried at 60 °C in a vacuum. Figure 7 shows ex situ XRD patterns of developed electrodes after full discharge and charge at different cycles at −20 °C. The reversible formation of Li3PO4 peaks is observed, suggesting that electrochemical reactions on the electrode surface are mainly dominated by lithiation of Sn3(PO4)2 (1).[30] Although the irreversible formation of Li3P is observed in the initial five cycles,[33] the surface of the electrode seems to be Li3P-free after the 100th charge. It may indicate the importance of Li3P formation on the further activation of the electrode after five cycles. Sn peaks are present on all patterns regardless of charge-discharge state and cycle number, indicating hindered kinetics of the alloying reaction at low temperatures, although the intensity of LixSn increases by the 100th discharge.
To clarify the processes that occurred during charging, dQ/dV curves and ex situ XPS spectra after the first and fifth charges were compared. Figure 8a shows charge dQ/dV curves of developed electrodes cycled at 50 mA g−1 at −20 °C. The number and positions of oxidation-reduction peaks change drastically with the change in the temperature, reconfirming incomplete electrochemical reactions. Starting point of the charge peaks gradually shift to a lower potential region, suggesting a decrease in the overpotential and activation of additional electrochemical reactions and/or their increased reversibility.
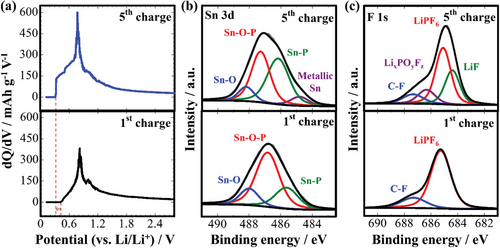
Ex situ depth XPS analysis was further conducted to better understand the activation mechanisms of the developed electrode at low temperatures. The surfaces of the electrodes were etched for 60 s to eliminate the oxidation layer. The SnxP peak in Sn 3d XPS spectra in Figure 8b intensifies after five cycles, confirming the increased reversibility of the electrochemical reactions. A shift of SnxP and SnxPO4 peaks to higher binding energies suggests an increased oxidation state of tin.[26] The appearance of LiF of high ionic conductivity in the F 1s XPS spectrum (Figure 8c) after five cycles can imply stabilization of the SEI layer, which also facilitates electrode activation.
From these results, increased reversibility of the electrochemical reactions with the formation of LiF-rich SEI layer after five cycles at −20 °C without prior room-temperature or low-current-density activation and using commercial electrolyte solution without any additives can be confirmed. These findings contribute to our understanding of the intricate interplay between temperature, material properties, and electrochemical behavior, potentially paving the way for improved energy storage systems in extreme environments.
3 Conclusion
Free-standing tin phosphide/phosphate carbon composite nanofiber mats of different compositions were successfully synthesized via electrospinning with heat treatments from phosphate-containing precursor solutions with different Sn:P molar ratios. Effect of the composition on the physical and electrochemical properties of the composites as anodes for lithium-ion batteries was studied using various analytical techniques. The highest initial discharge and charge capacities of 2313 and 1453 mAh g−1 respectively, were achieved at 50 mA g−1 for the 1:1 sample at room temperature. Furthermore, this sample showed a stable cycling performance at low temperatures, retaining 580 mAh g−1 charge capacity after 100 cycles at −20 °C using commercial electrolytes without any additives. Post-mortem characterizations confirmed the structural stability of the designed materials and the formation of a uniform stable SEI layer facilitating fast charge transfer which is beneficial for improving the LT performance of LIBs.
4 Experimental Section
Synthesis of Materials
First, the electrospinning solution was prepared by mixing polymer solution (0.645 g of PVP dissolved in 7.5 mL of ethanol) with precursor solution (different amounts of tin (II) chloride dihydrate [SnCl2⋅2H2O] and phosphoric acid [H3PO4, 85%] dissolved in 4.5 mL of ethanol:water [1:2 vol.] mixture). The molar ratio of Sn:P was varied from 1:0.5 to 1:1.3, keeping the mass of the SnCl2⋅2H2O constant. A solution with pure SnCl2⋅2H2O without any P source (denoted as pure Sn) in the same solvent was also prepared for comparison purposes. Concentrated nitric acid [HNO3, 70%]was added to the precursor solution in H3PO4:HNO3 = 1:1 volume ratio to avoid gelation with the polymer solution and ensure homogeneity upon mixing. The mixture was magnetically stirred at 600 rpm overnight.
Next, the prepared suspension was electrospun on a NE300 electrospinning machine (Inovenso) at 20–22 kV with a flow rate of 0.8 mL h−1, collected on a drum collector rotating at 100 rpm, and placed 10 cm away from the tip of the needle. Uniform fiber mats were dried at 150 °C for 12 h, stabilized at 280 °C for 4 h in the air oven, and further annealed at 700 °C for 1 h in the flowing Ar + H2 (4%) atmosphere.
Physical Characterization
The effect of the Sn:P molar ratio in the precursor solution on the crystal structure of the prepared materials was studied by XRD (Miniflex and SmartLab, both Rigaku). The carbon structure was analyzed by Raman (LabRAM, Horiba) with a 633 nm excitation laser. The carbon content in the composites was determined by CHNS analysis (CHNS-O, UNICUBE, Elementar). XPS (NEXSA, Thermo Scientific) with a monochromatic Al Kα source was used to analyze the molecular structure. XPS depth profiles were taken by etching the sample surface with Ar+ ion (at an ion gun current of 10 ± 3 µA, energy of 2000 eV, and raster width of 1 mm) for 30 and 60 s. Charge correction was performed using C 1s spectrum at 284.7 eV as reference. The morphology of the materials was checked by field-emission SEM (FE-SEM, Crossbeam 540, Zeiss) at 5 kV. The microstructure of the prepared samples was studied by TEM (JEM-1400 Plus, JEOL) at 120 kV, FE-TEM, and EDS (Tecnai F30 S-Twin) at 300 kV.
Electrochemical Characterization
The electrochemical properties of the prepared samples were studied in CR2032 coin-type half-cells with lithium metal counter/reference electrodes assembled in an argon-filled glovebox. The prepared free-standing mats were directly used as electrode materials without modification. The masses of 1 cm2 pieces were about 1 mg. Celgard@2400 polypropylene film was used as a separator. 1 M lithium hexafluorophosphate (LiPF6) dissolved in a mixture of solvents ethylene carbonate (EC), dimethyl carbonate (DMC), and diethyl carbonate (DEC) in a volume ratio of 1:1:1 was used as electrolyte. Assembled cells were cycled in a potential range of 0.01–2.8 V versus Li/Li+ at a current density of 50 or 250 mA g−1 at different temperatures using a multichannel battery tester (BTS4000, Neware). Fresh cells without any prior activation were used for comparing initial capacities at low temperatures at 25 mA g−1. The current densities were calculated based on the mass of the whole composite, including carbon, and capacities were calculated based on the mass of tin phosphide/phosphate, since depending on the heat treatment parameters, carbon obtained from electrospun pure PVP may be inactive [20] or show extremely low reversible capacity.[21]
CV tests were performed in a potential range of 0.01–2.8 V versus Li/Li+ at a scan rate of 0.1 mV s−1. Electrochemical impedance spectroscopy (EIS) measurements were conducted in a frequency range of 100 kHz–0.01 Hz at an AC amplitude of 5 mV using VMP-3 potentiostat/galvanostat (BioLogic Instruments).
Ex situ physical characterizations of the electrode samples were performed from the cells disassembled after different charge-discharge cycles at 50 mA g−1. Before ex situ analyses, the samples were washed with DMC solvent and dried at 60 °C overnight in an Ar atmosphere.
Acknowledgements
This research was funded by the Research Targeted Program #51763/ПЦФ-МЦРОАП РК−19 from the Ministry of Digital Development, Innovations and Aerospace Industry of the Republic of Kazakhstan. The authors thank A. Tuigynbek, L. Khamkhash, N. Daniyeva, and A. Slamova (Core Facilities, Nazarbayev University) for assistance in conducting physical characterizations of samples. The authors are grateful to Prof. S.S. Kim, O. Mukhan (Chungnam National University), Dr. N. Umirov, and Dr. A. Konarov (Nazarbayev University) for TEM-EDS and HR-TEM analyses.
Conflict of Interest
The authors declare no conflict of interest.
Open Research
Data Availability Statement
The data that support the findings of this study are available from the corresponding author upon reasonable request.


