A changing river: Long-term changes of sinuosity and land cover in the Navasota River Watershed, Texas
Abstract
The Navasota River Basin, itself a tributary of the Brazos River in Texas, is a dynamic watershed undergoing many natural and anthropogenic changes. Local stakeholder involvement in this watershed is quite high, and many landowners in the southern portion of the watershed have concerns regarding the increasing frequency and duration of flooding on private property adjacent to the river, often attributing these impacts to the construction of the Lake Limestone dam. In this study, we examine historical flow data, channel morphology, land use/land cover, and precipitation. Our findings indicate that while there appears to be increasing flow in the northern portion of the watershed, temporal data gaps near the watershed outfall prevent the indication of such a trend in the southern portion of the watershed. Nevertheless, other natural and anthropogenic factors are evident in the watershed that may have a significant influence on downstream flooding. Overall river sinuosity (meandering) declined over the study period, with some river segments encountering significant straightening. Total river length declined by 4.3 km from 1972 to 2020. The number and length of offtake channels also decreased substantially during this period. Land use/land cover use shifted dramatically, with a 39.2% increase in impervious cover and a 12.5% decrease in herbaceous cover since 1972. Finally, yearly precipitation increased, with the change point occurring in 1972. Our findings suggest that the shortening and straightening of the river has reduced its volumetric capacity over time. Coupled with increasing impervious surface cover and precipitation, more water is being delivered downstream at a rate exceeding the watershed's ability to discharge it, thereby contributing to flooding issues expressed by stakeholders. We recommend that bathymetric data and supplemental flow monitoring and modeling within the watershed is needed to fully understand how anthropogenic and natural forces may further affect streamflow in the future.
1 INTRODUCTION
Covering only 0.6% of all of Earth's nonglaciated land area (Allen & Pavelsky, 2018), river systems and their associated ecosystem services, have been a key component of human civilization for millennia (Garcia, 2023; Guillerme, 1988; Newson, 2008; Wang & He, 2022). Rivers help shape the temporal and spatial distributions of ecosystems, economies, and societies (Wang & He, 2022; Wang et al., 2019). However, anthropogenic modifications of river systems and the encompassing watersheds have been attributed to a myriad of unintended consequences such as loss of wetlands and other critical habitats, reductions in water quality, reshaping erosion and sedimentation rates, and altering flow regimes (Brody et al., 2014; Day, 2010; Gregory et al., 2019; Lintern et al., 2018; Xu et al., 2011).
Two key components affecting river flow dynamics include sinuosity (or meandering) and land use, especially impervious surface cover (Al-Husban, 2018; Arnold & Gibbons, 1996; Donovan et al., 2021; White & Greer, 2002). A meandering river can store more water volume locally, reducing velocity, while a straighter river has less storage capacity and higher velocities, which can cause severe flooding further downstream (Hillman, 1936; Nilsson et al., 2018; Shankman & Pugh, 1992; Shankman & Samson, 1991). Likewise, watersheds that are undeveloped have greater capacity to filter and trap runoff than those that are urbanized (Arnold & Gibbons, 1996; Day, 2010; Kim et al., 2016; Line & White, 2007). Just a small increase in impervious surface can increase runoff several-fold and shorten the lag time between rainfall and peak flows (Brezonik & Stadelmann, 2002; Hsu et al., 2000; White & Greer, 2002).
Remote sensing and Geographical Information Systems (GIS) have been deployed extensively to study land use change and water resources (Al-Husban, 2018; Allen & Pavelsky, 2018; Berg, Popescu, et al., 2016; Berg, Wilcox, et al., 2016; Donovan et al., 2021; Ibitoye, 2021; Rhodes et al., 2021). The launch of the Landsat satellite program in 1972 was a major milestone and marked a new generation of earth observation (Booth & Tueller, 2003; Gorelick et al., 2017; Markham et al., 2004; Rhodes et al., 2022). One obvious downside to the satellite era is that the earliest imagery is at a coarse resolution and the temporal history is still rather limited. However, historical aerial photography began to proliferate in government and private collections following World War I, providing a valuable resource for monitoring land use change and natural resources (Lillesand et al., 2015; Rhodes et al., 2022). Though limited in spectral bandwidth, these data sets serve as a crucial bridge between the pre- and postsatellite era.
By observing historical aerial photography, land use changes can easily be seen throughout the lower Navasota River basin in Texas. The watershed has also experienced many other natural and anthropogenic changes within the past century, such as rapid urban growth, strip mining, and the construction of reservoirs and ponds, most notable of which is Lake Limestone in 1978 (Brody et al., 2022; Gregory et al., 2017; TWDB, 2023). Local stakeholder engagement within the watershed is strong, as evidenced by the development of a Watershed Protection Plan (WPP) in 2017 to address water quality concerns (namely Escherichia coli contamination) throughout the watershed (Gregory et al., 2017). More recently, there have been concerns raised by stakeholders that flooding in the lower portion of the Navasota River basin has increased in recent decades, with many suggesting that the dam upstream at Lake Limestone could be linked to these changes (Falls, 2021; Krauss, 2021). Considering these concerns, we set out to gain a better understanding of the state of the watershed from before dam construction, to the present. Therefore, in this paper we explore changes in (i) river sinuosity, (ii) land use/land cover, (iii) flow, and (iv) precipitation in the Navasota River basin below Lake Limestone in eastern Texas.
2 MATERIALS AND METHODS
2.1 Site description
The Navasota River watershed below Lake Limestone (BLL) covers 4073 km2 in eastern Texas (Figure 1). The Navasota River channel BLL flows approximately 204 km from the dam at Lake Limestone to its confluence with the 118,000 km2 Brazos River basin. The southern portion of the Navasota River BLL along the eastern border of Brazos County is marked by marshy woodland, pastures, and numerous offtake channels. The Navasota watershed BLL is predominantly rural but does include a rapidly urbanizing area in the southwestern portion of the watershed that is home to a large public university. Soils throughout the watershed are predominantly clayey and are classified as Hydrologic Soil Group D, indicating that the infiltration rates are very slow. (Gregory et al., 2017; NRCS, 2019). Land use throughout the watershed is typically pasture/rangeland, wooded, and some farming near the confluence with the Brazos River. A lignite coal strip mine operated in the lower portion of the watershed from 1982 to 1996 and was reclaimed as a grassland following decommission. An additional strip mine is currently under operation in the northwestern portion of the watershed.
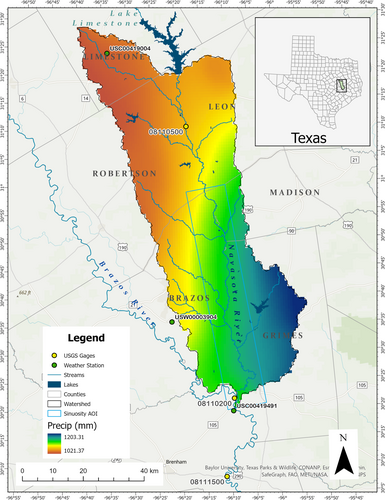
Lake Limestone was formed by the impoundment of the northern portion of the Navasota River basin by the Brazos River Authority in 1978, encompassing a drainage area of 1746 km2 (Solis et al., 2014). Construction of the earthen dam began in July of 1975, with the deliberate impoundment of water commencing on October 16, 1978 (Solis et al., 2014). The dam was completed in early 1979 (Solis et al., 2014). Ownership and operation of Lake Limestone resides with the Brazos River Authority, and is managed as a water supply reservoir for industrial and municipal customers (Solis et al., 2014). Since the primary purpose of the lake is to maintain a consistent water supply, rather than for flood control, the reservoir level must be maintained to fulfill customer contracts. This leaves little capacity to absorb high runoff events, resulting in discharging excess water through the dam gates downstream.
2.2 Image acquisition
Historical aerial photography (Table 1) was acquired from the United States Department of Agriculture's (USDA) Aerial Photography Field Office (APFO) in Salt Lake City, Utah for the years 1972, 1981, 1989, and 1995 (USDA APFO, 2016). 2008 imagery from the Texas Orthoimagery Program (Texas TOP) and 2020 imagery from the USDA National Agriculture Imagery Program (NAIP) were acquired from the Texas Natural Resources Information System (StratMap, 2008; USDA NAIP, 2020). Image acquisitions for 1972, 1989, 1995, and 2008 only cover the lower Navasota River channel along the eastern boundary of Brazos County (Figure 1). Full watershed coverage was acquired for 1981 and 2020. All imagery was georeferenced to align with the 2020 imagery and resampled to a 1 m resolution.
| Year | Program | Acquired from | Type |
|---|---|---|---|
| 1972 | USDA FSA | USDA APFO | BW Film |
| 1981 | USDA NHAP | USDA APFO | CIR Film |
| 1989 | USDA NAPP | USDA APFO | CIR Film |
| 1995 | USDA NAPP | USDA APFO | CIR Film |
| 2008 | Texas TOP | TNRIS | CIR Digital |
| 2020 | USDA NAIP | TNRIS | CIR Digital |
- Note: Data included black and white (BW) and color infrared (CIR) film/digital media and were acquired from repositories managed by the USDA Aerial Photography Field Office (APFO), and the Texas Natural Resources Information System (TNRIS).
2.3 River sinuosity
The main channel of the Navasota River, along with any offtake channels that diverted flow away from and eventually back to the main stem, were hand digitized as a polygon in ArcGIS Pro (ESRI, 2023; Smith et al., 2020) for the lower portion of the watershed where stakeholders have indicated that flooding is a problem (Figure 1, blue rectangle). Best judgment was used when digitizing to create polygons that followed bankfull boundaries. Polygons were then processed to remove errors in geometry using a workflow consisting of the following ArcGIS Pro tools: Repair Geometry, Repair Self Intersection, Remove Overlap, and Smooth (ESRI, 2023). Finally, the Polygon to Centerline tool was used to create the river centerlines for each year (ESRI, 2023).
2.4 Flow and precipitation
Long-term streamflow gage data for the Navasota River is only available in the upper portion of the study area. However, there are United States Geological Survey (USGS) gages on the Brazos River 4.2 km upstream (USGS gage 08110200), and 51.7 km downstream (USGS gage 08111500) of the confluence with the Navasota River (Figure 1) with varying data availability ranging from 1938 to present (excluding October 1983 thru February 2021) and 1965 to present, respectively (USGS, 2023). Data for these two gages were downloaded from the USGS National Water Information System (USGS, 2023). Estimated flow contribution into the Brazos River from the Navasota River (Navasota outfall estimate) for the years with concurring data from both gages was taken by subtracting the upstream gage value from the downstream gage value. Data from a gage in the upper portion of the Navasota River BLL watershed near the city of Easterly, Texas (USGS gage 08110500, Figure 1) with streamflow data availability from 1924 to present was also downloaded, as it is the only long-term, continuous flow data set in the watershed (USGS, 2023).
Finally, precipitation data were collected from the US National Oceanic and Atmospheric Administration (NOAA) Climate Data Online portal (NOAA, 2023) for weather stations located near the upper, middle, and lower portions of the watershed (Figure 1, Table 2). The uppermost station (USC00419004) is located near the city of Thornton with data availability from January 1944 to January 2018. The more centrally positioned station (USW00003904) is located at Easterwood Airport in the city of College Station. Data was acquired from August 1951 to December 2022. Lastly, the southernmost station (USC00419491) is located near the Navasota—Brazos confluence in Washington-on-the-Brazos State Park. Data for this station was acquired for April 1915 to December 2022. Both the mid- and lowermost stations are just outside of the watershed but are the closest sources of long-term daily data for this area.
| Data set | Predam | Postdam |
|---|---|---|
| Navasota outfall estimate | November 2, 1965 to October 15, 1978 | October 16, 1978 to September 30, 1983 |
| Easterly flow gage (08110500) | March 27, 1924 to October 15, 1978 | October 16, 1978 to December 31, 2022 |
| Thornton precipitation | January 4, 1944 to October 15, 1978 | October 16, 1978 to January 31, 2018 |
| Easterwood airport precipitation | August 1, 1951 to October 15, 1978 | October 16, 1978 to December 31, 2022 |
| Washington-on-the-Brazos State Park Precipitation | July 1, 1952 to October 15, 1978 | October 16, 1978 to December 31, 2022 |
- Note: Impoundment of water in Lake Limestone officially began on October 16, 1978.
To test for possible changes in streamflow due to dam construction, predam and postdam data were compared to determine if there were any differences in total watershed flow (Navasota outfall estimate) or upper watershed flow (USGS gage 08110500). All flow and precipitation data were divided into pre- and postdam data sets (Table 2) based upon the closing of the Lake Limestone dam gates on October 16, 1978 (Solis et al., 2014).
Differences between the pre- and postdam data sets were analyzed first by performing a Mann-Kendall test on the combined data to establish if there was a trend in the data, and whether that trend was increasing or decreasing (Helsel et al., 2020) using the Python pymannkendall package (Hussain & Mahmud, 2019). Next, the Mann–Whitney test was conducted on the pre- and postdam data sets to determine if they were significantly different using the mannwhitneyu function from the scipy Python library (Virtanen et al., 2020). Finally, the Pettitt change point test was performed on the full data set using the pyhomogeneity Python library (Hussain et al., 2023) to determine if there was a change point in the data that might correlate with the construction of the dam, or perhaps related to some unknown cause.
2.5 Land cover
Land cover for the lower Navasota River basin was derived from 1981 to 2020 aerial imagery using the Example Based Feature Extraction tool in ENVI 5.6 (NV5 Geospatial, 2022). This is an object-oriented supervised classification utilizing the support vector machine (SVM) learning algorithm that bases its classification on objects rather than individual pixels and has been shown to be a much more robust process with higher classification accuracy than pixel-based methods (Rhodes et al., 2021). In object-oriented classification, the aerial imagery is first segmented into objects built upon common spectral, textural, and spatial attributes (Baatz, 1999; Laliberte et al., 2004; Thomas et al., 2003). Class training data is then selected by the user to train the classification algorithm.
We classified Navasota watershed BLL imagery as woody vegetation (trees and shrubs), herbaceous/cropland vegetation, water, and impervious surface (roads, buildings, oil and gas extraction pads, exposed caliche soils). After initial classification, the rasters were cleaned up to remove salt-and-pepper effects by using the Majority Filter, Region Group, Set Null, and Nibble tools in ArcGIS Pro (ESRI, 2023). Due to the size of the watershed, we chose to measure classification accuracy based upon a stratified random sampling of 500 points (125 points per class) for each year of imagery (Congalton, 2001; Lillesand et al., 2015). Producer's and user's accuracy, as well as the Kappa Statistic (Stehman, 1996) were used to quantify classification accuracy.
3 RESULTS
3.1 River channel morphology
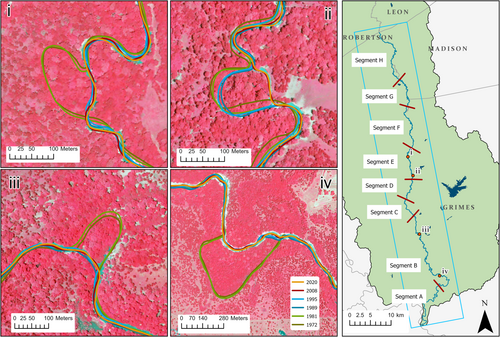
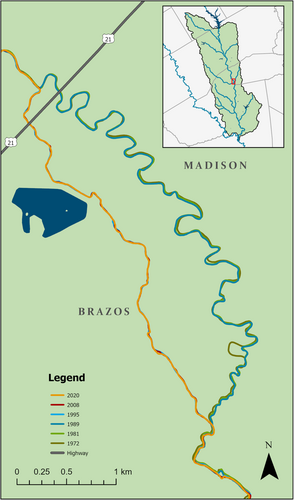
The lower Navasota River channel has undergone numerous changes in the past 50 years. Most notably is the shortening of the main channel by 4.3 km since 1972 (Table 3). This is caused by the formation of numerous oxbows (Figure 2), and by channel shifting (Figure 3). The single greatest contributor to the shortening of the river is the westward shift of the main channel just below US Highway 21 (Figure 3). While both channels are present in 1972, it was quite clear from the imagery that the eastern channel was perennial, and that the western channel was ephemeral. Sometime between the 1989 and 1995 imagery dates, the western channel became the perennial channel, and the eastern channel had begun to silt in. During this period in the early 1990s, there were numerous high flow events, including a 4-day high flow episode in December 1991, where flows exceeded 1600 m3/s (Figure 5b). This shift in the perennial channel resulted in a reduction in length of 4.64 km (Segment G, Table 3), reducing the sinuosity of Segment G from 2.13 to 1.49. However, due to stable or slightly increasing sinuosity in other sections as a result of channel migration, the overall total sinuosity of the lower Navasota River remained unaffected, starting out in 1972 at an SI of 1.89, and ending in 2020 at 1.83 (Table 3).
| Segment | ||||||||||
|---|---|---|---|---|---|---|---|---|---|---|
| Entire | A | B | C | D | E | F | G | H | ||
| 1972 | Valley length (km) | 71.75 | 10.69 | 17.91 | 4.30 | 5.08 | 7.64 | 10.05 | 6.70 | 12.46 |
| River length (km) | 135.69 | 18.25 | 37.62 | 6.75 | 8.39 | 12.06 | 17.38 | 14.15 | 21.10 | |
| Sinuosity Index | 1.89 | 1.71 | 2.10 | 1.57 | 1.65 | 1.58 | 1.73 | 2.11 | 1.69 | |
| 1981 | Valley length (km) | 71.78 | 10.70 | 17.90 | 4.30 | 5.08 | 7.64 | 10.04 | 6.70 | 12.46 |
| River length (km) | 135.75 | 18.46 | 37.50 | 6.70 | 8.44 | 12.10 | 17.37 | 14.07 | 21.12 | |
| Sinuosity Index | 1.89 | 1.72 | 2.10 | 1.56 | 1.66 | 1.58 | 1.73 | 2.10 | 1.69 | |
| 1989 | Valley length (km) | 71.76 | 10.70 | 17.90 | 4.29 | 5.09 | 7.64 | 10.04 | 6.70 | 12.46 |
| River length (km) | 134.79 | 18.55 | 36.37 | 6.77 | 8.25 | 11.94 | 17.38 | 14.29 | 21.24 | |
| Sinuosity Index | 1.88 | 1.73 | 2.03 | 1.58 | 1.62 | 1.56 | 1.73 | 2.13 | 1.70 | |
| 1995 | Valley length (km) | 71.85 | 10.76 | 17.90 | 4.30 | 5.08 | 7.64 | 10.04 | 6.48 | 12.65 |
| River length (km) | 130.08 | 18.66 | 36.34 | 6.75 | 8.15 | 11.86 | 17.42 | 9.65 | 21.27 | |
| Sinuosity Index | 1.81 | 1.73 | 2.03 | 1.57 | 1.60 | 1.55 | 1.73 | 1.49 | 1.68 | |
| 2008 | Valley length (km) | 71.83 | 10.75 | 17.90 | 4.29 | 5.08 | 7.64 | 10.04 | 6.48 | 12.64 |
| River length (km) | 130.84 | 18.86 | 36.74 | 6.76 | 8.27 | 11.99 | 17.67 | 8.95 | 21.60 | |
| Sinuosity Index | 1.82 | 1.76 | 2.05 | 1.57 | 1.63 | 1.57 | 1.76 | 1.38 | 1.71 | |
| 2020 | Valley length (km) | 71.82 | 10.73 | 17.90 | 4.30 | 5.08 | 7.64 | 10.04 | 6.48 | 12.64 |
| River length (km) | 131.39 | 19.02 | 36.71 | 6.77 | 8.27 | 12.11 | 17.80 | 9.05 | 21.66 | |
| Sinuosity Index | 1.83 | 1.77 | 2.05 | 1.57 | 1.63 | 1.58 | 1.77 | 1.40 | 1.71 | |
- Note: River segments were delineated based upon road intersections within the watershed. Drifting of the river centerline in relation to the road between years causes slight variations in total valley length.
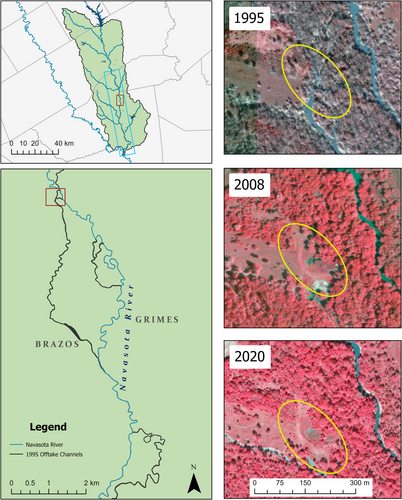
The number of offtake channels that diverted flow away and later returned the flow back to the main channel increased from 1972 through 1995, which subsequently increased the total offtake channel length (Table 4). By 2008, the number of offtake channels dropped drastically from 24 to 9 (a reduction of 33.33 km of channel). Of particular note was the construction of an earthen berm that impeded flow to 7.1 km of offtake channels (Figure 4; Table 4).
| Year | Offtake count | Offtake channel length (km) |
|---|---|---|
| 1972 | 18 | 50.29 |
| 1981 | 19 | 56.51 |
| 1989 | 21 | 52.53 |
| 1995 | 24 | 57.60 |
| 2008 | 9 | 24.27 |
| 2020 | 8 | 23.96 |
- Note: Offtake count is the total number of offtake channels that returned flow back to the main channel. Offtake channel length (km) is the sum distance of all offtake channels in a given year.
3.2 Flow and precipitation
Estimated flow values for the Navasota River confluence with the Brazos River are shown in Figure 5a. The Mann-Kendall test did not find a trend in the overall data set (p = 0.75). Likewise, the Mann–Whitney U test did not find a significant difference in estimated flows between the pre- and postdam periods (p = 0.60). Since no difference exists in the data, the Pettitt test was not conducted for this data set.
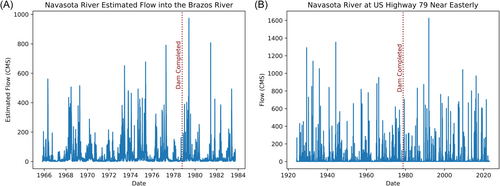
Actual streamflow at USGS gage 08110500 in the northern portion of the watershed near Easterly is shown in Figure 5b. The Mann-Kendall trend test found there to be an increasing trend (p ≤ 0.01) and the Mann–Whitney U test found pre- and postdam flows to be statistically different (p ≤ 0.01). Findings from the Pettitt test suggest that the change point in the data set occurred in 1972.
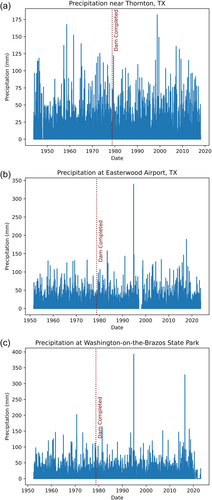
Pre- and postdam precipitation data are shown in Figure 6. Mann-Kendall testing revealed increasing precipitation occurring over the data period for each station (p ≤ 0.02). Mann–Whitney U tests further validated this trend by showing that pre- and postdam precipitation was significantly different in the watershed (p ≤ 0.01). Pettitt testing revealed change points in the data occurring in 1990, 1984, and 1972 for Thornton, Easterwood Airport, and Washington-on-the-Brazos State Park, respectively.
3.3 Land use/land cover
Image classification accuracy for both 1981 and 2020 were quite high (Tables 5 and 6). Overall classification accuracy for 1981 was 89.4%, while 2020 was 93.8%. The KAPPA statistic was high at 0.859 and 0.917 for 1981 and 2020, respectively (Tables 5 and 6). Producer's accuracy was greater than 83% for all classes in both years (Tables 5 and 6). User's accuracy was greater than 89% for all classes except for herbaceous cover in both 1981 (75.80%) and 2020 (83.56%).
| Actual | ||||||
|---|---|---|---|---|---|---|
| Herbaceous | Impervious | Water | Woody | Total | ||
| Predicted | Herbaceous | 119 | 18 | 12 | 8 | 157 |
| Impervious | 1 | 104 | 0 | 0 | 105 | |
| Water | 0 | 0 | 107 | 0 | 107 | |
| Woody | 5 | 3 | 6 | 117 | 131 | |
| Total | 125 | 125 | 125 | 125 | 500 | |
| Prod Acc | 95.20 | 83.20 | 85.60 | 93.60 | ||
| User Acc | 75.80 | 99.05 | 100.00 | 89.31 | ||
| Overall Acc | 89.4 | |||||
| KAPPA | 0.859 | |||||
| Actual | ||||||
|---|---|---|---|---|---|---|
| Herbaceous | Impervious | Water | Woody | Total | ||
| Predicted | Herbaceous | 122 | 16 | 1 | 7 | 146 |
| Impervious | 0 | 105 | 0 | 0 | 105 | |
| Water | 0 | 2 | 124 | 0 | 126 | |
| Woody | 3 | 2 | 0 | 118 | 123 | |
| Total | 125 | 125 | 125 | 125 | 500 | |
| Prod Acc | 97.60 | 84.00 | 99.20 | 94.40 | ||
| User Acc | 83.56 | 100.00 | 98.41 | 95.93 | ||
| Overall Acc | 93.8 | |||||
| KAPPA | 0.917 | |||||
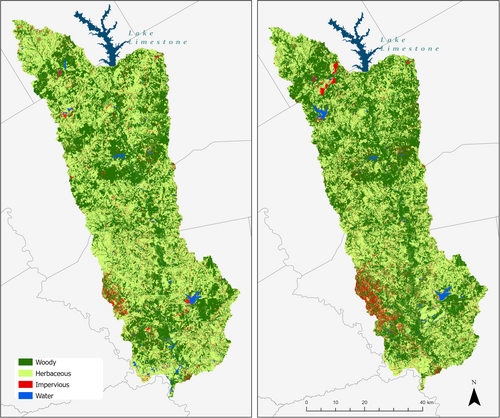
In 1981, herbaceous cover was the largest land use in the watershed at 52.72% of total land cover, followed by woody cover at 42.4% (Table 7). Impervious surface and water made up 3.6% and 1.29%, respectively. In 2020, impervious surface, woody, and water land cover types all increased at the expense of herbaceous cover, which dropped by 12.52% (Table 7). Impervious cover had the greatest land cover increase of 39.2%, followed by water (21.45%) and woody (11.59%).
| 1981 | 2020 | Overall change | ||||
|---|---|---|---|---|---|---|
| km2 | % cover | km2 | % cover | km2 | % change | |
| Impervious | 146.53 | 3.60 | 203.97 | 5.01 | 57.44 | 39.20 |
| Woody | 1727.09 | 42.40 | 1927.28 | 47.31 | 200.19 | 11.59 |
| Water | 52.45 | 1.29 | 63.71 | 1.56 | 11.25 | 21.45 |
| Herbaceous | 2147.42 | 52.72 | 1878.54 | 46.12 | −268.89 | −12.52 |
4 DISCUSSION
While flow in the upper portion of the watershed appears to have increased over time, we were not able to definitively measure changes in flow estimates for the Navasota outfall due to the short availability of postdam data ending in 1983. Increasing precipitation, as well as reductions in stream length, offtake number and length, and sinuosity could be confounding factors at play here, having profound effects on the storage and movement of water downstream. River sediment is crucial to the development of river meanders (Constantine et al., 2014). Damming of rivers traps sediment behind the dam, which can deprive the downstream watershed of critical sediment loads needed to build up sand bars and maintain channel sinuosity (Ligon et al., 1995). This, in turn, can lead to a deeper, narrower (and straighter) channel (Ligon et al., 1995). A prolonged lack of sediment, coupled with extreme flow events in excess of 1600 CMS in 1991 could have been the tipping point to straightening of the river between 1989 and 1995, though due to the temporal data gaps, it is hard to say exactly when that transition took place. Straighter rivers have less overall storage capacity and move water faster downstream, potentially overwhelming the downstream system, leading to flooding. Additionally, straighter channels are at increased risk of erosion, which can further decrease downstream capacity by reducing the cross-sectional area through increased channel aggradation. Shields et al. (2000) noted that while the greatest effects on river channels are immediately below the dam, they were able to document river bed degradation and lessened meandering hundreds of kilometers downstream of a dam in an alluvial system. Such morphological changes in the Navasota River BLL may possibly have been accentuated by the placement of the dam. Offtake channels, particularly longer ones, may help to alleviate the channel's reduced storage capacity by diverting streamflow away from the main channel, temporarily easing the burden on the main channel. Damming of offtake channels forces the flow to remain in the main channel, thereby exacerbating the chance of flooding, and potentially eroding bank stability, as the river begins to adjust.
Image classification accuracy for this project was well above the often-cited benchmarks of 85% for overall accuracy and 70% for in-class accuracy (Thomlinson et al., 1999; Wulder et al., 2006). However, these are mostly a rule-of-thumb, and not necessarily universally applicable to all remote sensing applications (Foody, 2008; Stehman & Foody, 2019). Nevertheless, the object-based feature extraction performed extremely well in this case.
Changes in landscape cover in the watershed from 1981 to 2020 were quite insightful. Profound increases in impervious cover occurred throughout the watershed but was mostly concentrated in the southwestern portion around the growing metropolitan area of Bryan and College Station (Figure 7). This large shift in impervious cover is likely a contributing factor to increased runoff in the lower portion of the watershed (Brezonik & Stadelmann, 2002; Hsu et al., 2000; White & Greer, 2002), where flooding has become a concern among local stakeholders. Numerous studies have demonstrated that even modest increases in impervious cover, can lead to several-fold increases in total runoff (Arnold & Gibbons, 1996; White & Greer, 2002), increasing the peak discharge rate (Brezonik & Stadelmann, 2002; Rose & Peters, 2001), and greatly shortening the time between precipitation events and runoff (Hirsch et al., 1990).
Reductions in herbaceous cover can be concerning both in terms of water quality and quantity, as grassland serves to filter sediment and contaminants from runoff, thus contributing to improved surface water quality (Larsen et al., 1994; Smith et al., 1992; Wagner et al., 2023). Grassland vegetation also serves to slow down overland flow of water, allowing more to infiltrate into the soil (DeVilleneuve et al., 2023; Fraser & Stone, 2016; Wagner et al., 2023; Zhou et al., 2008). Woody plant cover expansion, which increased by nearly 12% over this time period, is a growing worldwide phenomenon that has often been correlated with growing human population densities and land ownership fragmentation (Archer et al., 1995; Van Auken, 2000; Berg et al., 2015). Woody plant encroachment onto rangelands has been shown to affect streamflow by reducing runoff and increasing evapotranspiration (Huxman et al., 2005; Qiao et al., 2017). Woody vegetation may intercept up to 54% of rainfall in their canopies, storing it on their leaves, where it is at greater risk of evaporation (Thurow et al., 1987). As a result, woody plants and underbrush may slow down or prevent overland flow from reaching waterways, thus alleviating flooding extent; however, in lowland floodplains, this may be an impediment to draining of standing water (Brody et al., 2014; McCulloch & Robinson, 1993). Increasing of woody cover also ultimately leads to increasing woody debris in streams, creating log jams that may further alter streamflow and morphology (Sear et al., 2010; Shields & Gippel, 1995). Large woody debris can be an important component in the development of lowland braided floodplains (Sear et al., 2010), providing many local ecological benefits (Livers & Wohl, 2021). However, these logjams could lead to unwanted flooding.
The increasing of surface water coverage (mostly private ponds) during this period, is further testament to land fragmentation and the necessity to provide water for livestock on smaller estates, as well as aesthetic/recreational opportunities for “lifestyle” (nonagriculturally producing) landowners (Berg, Popescu, et al., 2016; Berg et al., 2015; Sorice et al., 2014). Since land ownership in Texas is primarily privately held (Smith et al., 2019), fully understanding the volume of water being detained throughout the watershed is a truly difficult proposition.
5 CONCLUSION
Based upon our observations, the Navasota River below Lake Limestone is a dynamic watershed undergoing sweeping changes in fluvial geomorphology and land use/land cover over the last 50 years. Stakeholder concerns about more frequent and prolonged flooding in the lower reaches of the watershed being caused solely by the damming of Lake Limestone appears to be partly attributable to several other natural and anthropogenic factors. While streamflow at the Easterly, TX gage (08110500) did show an increase in flow, the Pettitt test suggests that the change point was in 1972, 6 years before impoundment by the dam, and 3 years before dam construction began. Streamflow estimates at the outfall of the watershed suggested that there was not a significant change in total streamflow. However, due to an incomplete data set, we are only able to examine the outfall through 1983, a mere 5 years postdam impoundment.
One possible explanation for increased flooding in the lower portion of the watershed is that amplified runoff, spurred by a shifting climatic regime, compounded by a rise in impervious surfaces, and hastened by the shortening of the main river channel and the reduction of offtake channels all make for a perfect storm of composite factors. So, while even though woody cover and surface water impoundments have increased markedly throughout the watershed, the potential reductions in runoff afforded by those land cover changes are more than canceled out by the concentration of impervious surface, stream morphological changes, and increasing precipitation.
This research underscores the importance of these anthropogenic and natural processes, and how our own biases and perceptions may lead to conclusions that are sometimes incomplete. Future research in this watershed must focus on developing more on-the-ground analyses of channel volume, bank stability, channel debris, and sedimentation. Modeling of historical storm events and flood surges and comparing them against the Landsat satellite record may provide additional insight to the frequency and duration of flooding events. To quote Plato: “No [one] can step in the same river twice, for the second time it's not the same river, and [they're] not the same [person]” (Peterson et al., 2013). Rivers are not stationary fixtures in an environment. They are a force of constant change, a representation of climatic, topographic, biological, and anthropogenic influences acting within the watershed. Exploring changing land use, such as increasing urbanization, and changing climatic conditions are critical to understanding the scope and impact of future flooding events.
ACKNOWLEDGMENTS
The authors wish to thank the Institute for a Disaster Resilient Texas, Katharine Teleki, and Esha Clearfield for assisting with grant administration and project management, and to the anonymous reviewers for donating their time to improve this manuscript. This research was funded by the Texas A&M University System Chancellor's Office. The funders had no role in the design of the study; in the collection, analyses, or interpretation of data; in the writing of the manuscript; or in the decision to publish the results.
ETHICS STATEMENT
None declared.
Open Research
DATA AVAILABILITY STATEMENT
The data that support the findings of this study are available from the corresponding author upon reasonable request.


