Study of hydrothermal characteristics of large-scale water conveyance trunk canals in seasonally frozen ground regions under the influence of different initial water contents
Abstract
In seasonal frozen soil, freezing and thawing can change the physical and mechanical properties and affect slope stability. There are complex moisture conditions in the main water transfer canal. A study of the hydrothermal evolution of canals with different initial water contents under the action of freezing and thawing is of great importance for the prevention and control of canal slope slides. Hydrothermal coupling models are the key to revealing the canal's hydrothermal evolution. As some of the modeling parameters in the current hydrothermal coupling model are based on empirical values, particularly those in the van Genuchten equation, which are not necessarily related to soil properties, they are not suitable for analyzing the hydrothermal evolution of canals. This paper determines the soil-water characteristic curve from the cumulative curve of particle gradation in the subsoil, and then determines the hydraulic parameters of the subsoil using the VG model, which then corrects the hydrothermal coupling model. The method of modifying the hydrothermal coupling model is original, which makes the model more realistically reflect drainage soil characteristics. During freezing and thawing of channel slopes with different initial water contents (21%, 25%, 29%, 33%, 37%, and 41%), temperature field, water field, and ice content distributions were investigated. Using the V-G model, the optimal parameters for canal subsoil were a = 0.06, n = 1.2, and m = 0.17, and temperature distribution trends between canals with different water contents were basically similar. Water will accumulate at the bottom as the liquid water content increases at the canal boundary.
1 INTRODUCTION
It is known that frozen soil is a special type of soil since it contains ice cement and is defined as soil with a temperature below 0°C (Xu et al., 2001). It is composed of granular skeletons of the soil, void gases, water, and other components of the multiphase system. In accordance with the amount of time spent on frozen soil, it can be divided into two types: permafrost and seasonal frozen soil. The soil that has been frozen for a longer period of time than 2 years is referred to as permafrost, and the soil that freezes during the winter months, then thaws in the summer months is referred to as seasonal frozen soil. About 70% of the global land area is covered by frozen soil, of which 14% is the permafrost and 56% is the seasonal frozen soil. There is a substantial amount of permafrost in China, with about 21.5% of the land area being permafrost, and about 53.5% being seasonal frozen soil (Xu et al., 2001). Heilongjiang Province is a typical seasonally frozen ground regions, but it is also one of the main grain-producing regions in China, the status of the grains as “ballast” is becoming increasingly apparent, and the importance of large-scale water transfer projects to irrigation farmland is becoming increasingly apparent (Gao et al., 2021; Hai et al., 2023; Ling et al., 2009; Wang, Meng, et al., 2018; Wang, Wang, et al., 2018). The Heilongjiang Province has been involved in the construction of many canal projects to accomplish this goal. Such projects include the northern part of the project, the central part of the project, the southern part of the project. As part of the first phase of the Qinglongshan Irrigation District, which irrigates a total area of more than 10,000 hectares, a 15,000 km embankment project has been built. There have been instances of large-scale freeze-thaw landslides on the slopes of the canal projects as a result of freezing and thawing in the cold zone and the complex water environment around the canals (Li et al., 2014, 2015; Wang et al., 2024).
As the canal is being frozen and thawed, the water content will become increasingly complex, and the water content is the key factor that will promote the freezing and expansion of the base soil of the canal during freezing and thawing. There are two types of water in the canal base soil: its own water and foreign water. The foreign water is affected by the rainfall, snowfall, and water table, and the degree of groundwater recharge directly affects the freezing and expansion of the canal base. As well as influencing the degree to which groundwater is recharged, the initial water content affects the degree to which the groundwater freezes and thaws to a great extent, making the study of how the initial water content influences the hydrothermal characteristics of the canal of the law of significance. It is the soil under the canal that is directly responsible for the freeze-thaw hazards found in canals. At the point when soil freezes, a temperature gradient is formed between the cold end of the soil and the warm end of the soil as the outside temperature decreases (Pei et al., 2017; Wang et al., 2022; Wen et al., 2015; Zhang et al., 2020; Zhang, Zhang, et al., 2017). It is important to note that the soil temperature continues to fall, and when it becomes colder than the freezing temperature of the water within the soil, part of the liquid water undergoes a phase change and freezes into ice, and the freezing front moves continuously forward from the cold end to the warm end of the soil. When the temperature gradient is applied to the soil, the unfrozen water will migrate, and the water will carry heat along the way as it migrates toward the freezing front, which will result in a significant change in the thermal parameters of the soil, and all of this will have a profound influence on the temperature field as a consequence (Chang et al., 2023; Fu et al., 2018; Hao et al., 2023; Tianhua & Miao, 2021; Wang, Meng, et al., 2018; Xu et al., 2022; Zhang, Pei, et al., 2017). A large temperature gradient affects the freezing and migration rates of water. As a result, if the temperature gradient is large, the water migration is fast, and therefore, the temperature field and the water field have a coupling relationship that affects each other (Guo et al., 2023; Lai et al., 2017; Liu et al., 2020; Wang et al., 2018; Yan et al., 2023). To gain a better understanding of the process of water-heat migration in frozen soil, many researchers have explored and proposed a number of coupled models for studying the movement of water and heat in frozen soil (Bai et al., 2018, 2022; Li et al., 2023; Pei et al., 2014; Sun et al., 2023). Water migration in unsaturated soils is analogous to water migration in partially frozen soils according to Harlan (1973), in which the soil-water potential is regarded as the primary driver of the migration, and a coupled equation for heat and water migration is proposed in completely frozen soils. Based on Harlan's model, Taylor and Luthin (1978) proposed a coupled equation to explain the flow of water and heat through completely frozen soils. Similarly, Sheppard et al. (1978), Jansson and Halldin (1979), and Fukuda et al. (1980) have also developed similar hydrothermal coupling models based on Harlan's model. Among the three-field coupled models developed by Zhou and Li (2012), the pore ratio of the ice lenticular body must be greater than the separation pore ratio to form ice lenticular bodies. Lai et al. (2014) conducted unilateral freezing experiments on saturated soil in an open system with unpressurized recharge, analyzed the effects of temperature gradient, overburden pressure, and cooling temperature on water migration and freezing, and proposed a coupled hydro-thermal model with temperature, porosity, and drainage as variables. Bai, Lai, et al. (2020) developed the effective strain ratio to establish a relationship between the freeze-up strains of unsaturated soils and their temperature and water fields, and proposed a simplified criterion that would help determine the effective strain ratio. Based on Richard's equation, Bai (2016) calculated the hydraulic conductivity coefficient in Harlan's model, established a new water-heat coupling model, and calculated the process of water-heat migration from a frozen soil roadbed over a period of time. According to Li et al. (2021), a coupled integrated model has been developed that describes temperature change and liquid water and water vapor redistribution in unsaturated frozen soil freezing due to thermodynamics and continuum medium mechanics. According to Lu et al. (2019), 250 published laboratory data and nearly 5 years of field observations were used to evaluate five widely used models of unfrozen water content.
A great deal of research has been carried out on coupled modeling of hydrothermal transport and has resulted in many rich results for many researchers. While the current coupled hydrothermal models are largely based on empirical values, some of the modeling parameters are mostly derived from empirical data. The parameters of the van Genuchten equation have, in particular, not been correlated with the properties of the soil. A model of the hydrothermal evolution of canals can be used to analyze the evolution of canals, but there are limitations to it as well as a need to find out a way to apply the model to an analysis that can truly reflect the evolution of canals based on the hydrothermal process. We have developed a new theory based on the Harlan model and Darcy's law, where the cumulative curve of the particle gradation in the soil and the curve of the soil-water characteristics are very similar in this paper. It is possible to determine the soil-water characteristic curve by using the cumulative curve of particles in the subsoil to determine the particle grade. As the soil-water characteristic curve is fitted to the VG model, the hydraulic characteristics of the subsoil are determined, then a modification is made to the existing hydrothermal coupling model. As part of the canal engineering process in the seasonally frozen ground regions, numerical calculations were also conducted in conjunction with the engineering of the canal to determine how the temperature field, water field, and ice content distribution laws were determined during the freezing and thawing process on the slopes of the canal with different water contents at the start of the freezing and thawing process in the seasonally frozen ground regions (21%, 25%, 29%, 33%, 37%, and 41%) during the freezing and thawing process. An innovation to this part of the study is based on the previous theoretical work, which was able to analyze the multifield interaction mechanism and dynamic coupling process of canal slopes during a freeze-thaw cycle. As a result, it is expected to serve as a reference tool for the prevention of frost damage and canal engineering design.
2 HYDROTHERMAL COUPLING MODEL FOR FROZEN SOIL
2.1 Model assumptions
- (1)
The soil particle size is uniform, continuous, and isotropic, and the size of the soil particle is continuous.
- (2)
In water migration, water is only in a liquid state and has no other state.
- (3)
Earth particles, water, and ice crystals are incompressible, ignoring the pressure thawing of ice particles.
- (4)
Water migration and air movement are in accordance with Darcy's law.
- (5)
Air within frozen soil is connected to the outside world.
- (6)
The effect of salts and mineral ions on water migration is not considered;
- (7)
The soil transfers heat through thermal conduction.
2.2 Calculation model of hydrothermal coupling field
A multifield coupling problem refers to a problem consisting of more than one physical field superimposed on each other, and it is increasingly used to solve such problems in engineering by using finite element analysis to simulate the interaction between multiple fields (Bai et al., 2021; Bai, Xu, et al., 2020; Li et al., 2019, 2024; Zhang, Zhang, et al., 2017). A coupled frozen soil water-heat model describes the spatial and temporal evolution laws of the temperature field and the water field during the freezing and thawing of soil using a set of differential equations. Basically, the model consists of three parts: the equations for the water field, the equation for the temperature field, and the equation for the linkage field. According to Fourier's law and the law of energy conservation, it is possible to establish the equation for the temperature field in accordance with the law of conservation of energy. A closed theoretical model of the frozen soil water-heat coupling can be formed by combining Darcy's law with the law of conservation of mass and giving the functional relationship between the ice content and the water content. Finally, the ice content and the temperature can be used together to construct a closed equation representing the water field.
2.3 Verification of the model
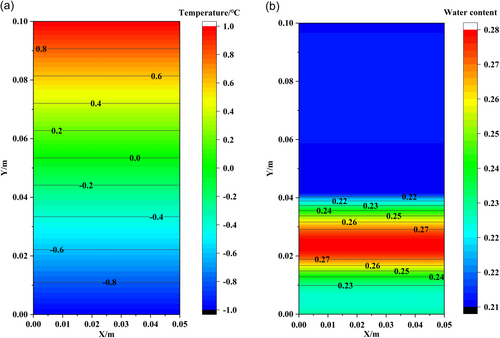
It is the purpose of this paper to examine the validity and reasonableness of the hydrothermal coupling model established above, by comparing the frozen soil column test with the numerical model under the same parameters as Xu et al. (2001), and comparing it with the experimental results of the freezing test under closed conditions. First, a two-dimensional planar soil column model is established (size: diameter of 10 cm, height of 10 cm). It is important to note that when determining the temperature field boundary for the top and bottom of the model, the same constant temperature boundary is used as that used in the test: the upper temperature is set at 1°C, while the lower temperature is set at −1°C, and both sides of the boundary are set as adiabatic boundaries, with the temperature at 1°C as the initial temperature. In connection with the boundary setting of the water field, it was determined that the boundary on each side of the moist field was set at zero flux since the test was a closed condition; the initial water content of the sample was 22.3%, and the calculation time was set to 120 h.
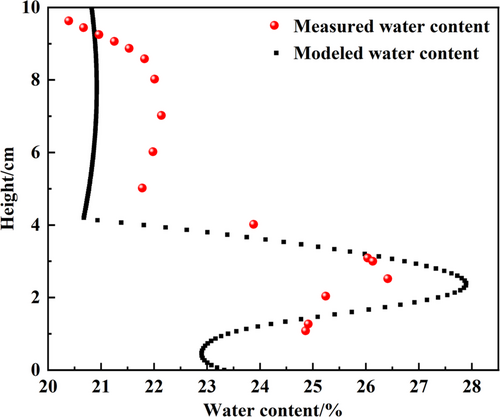
Figure 1 shows the two-dimensional cloud diagram showing the distribution of temperature and total water content along the height of the soil column after 120 h of experimentation. It was necessary to compare the data obtained from the numerical software with the data measured from the test to verify the feasibility of the model based on the data obtained from the numerical software. Figure 2 shows the variation rule of the measured and numerically simulated water content in the specimen along the height of the specimen after the one-way freezing test was performed. As can be seen from the figure, there is a gradual freezing of the whole soil body from the bottom to the top because of the cooling. Liquid water content in the freezing zone is significantly higher than that in the thawing zone, which is a result of the difference in temperature. There is a temperature gradient within the soil body, which creates a suction effect due to the presence of a gradient within the soil body. Due to the driving force of the unfrozen zone, the water from the unfrozen zone migrates towards the bottom frozen zone under the driving force. Furthermore, because of the blocking effect brought about by the ice itself, the unfrozen water, once migrating to the freezing zone, accumulates in large quantities near the freezing interface, which subsequently results in a peak of water content near the freezing peak surface, due to the blocking effect created by the ice itself. It can be concluded that the results of the simulation are largely consistent with those of the experiments, proving to be the validity of the established model of hydrothermal coupling.
2.4 A physical method for predicting soil-water characteristic curves based on particle grading curves
Arya et al. proposed a physical empirical model based on particle size distribution and dry soil density of soil as a way to calculate soil-water characteristic curve based on the similarity in shape between soil-water characteristic curve and the cumulative distribution curve of soil particles (Arya & Paris, 1981). To achieve this, there are a few specific steps that need to be followed.
This means that Vi if the volume of porous soil per unit of soil particle in class i is taken as the volume of porous soil per unit of soil particle in class i, ρp is the mass density of soil particles; Wi is the mass percent of soil particles in class i; and e is the relative porosity of the soil.
When soil is filled with water, there will be a water content in the soil of volume θi and class i.
- (1)
Assume that the soil particles of all levels are equivalent to spheres, and the equivalent radius is Ri.
- (2)
Assume that the voids of soil particles at all levels in the soil can be equated to the same cylindrical capillary structure, where the radius of the cylinder, ri, is related to Ri.
- (3)
Assume that there are certain voids between the soil grains at each level in the soil, which can be regarded as cylinders, and that the length of each cylinder is li. Each level of soil grains in the soil consists of ni equivalent grain sizes Ri.
The corresponding soil-water characteristic curves can be obtained from Equations (12) and (18).
3 ANALYTICAL MODEL OF WATER-HEAT COUPLING IN LARGE-SCALE WATER CONVEYANCE TRUNK CANALS
3.1 Physical parameter values
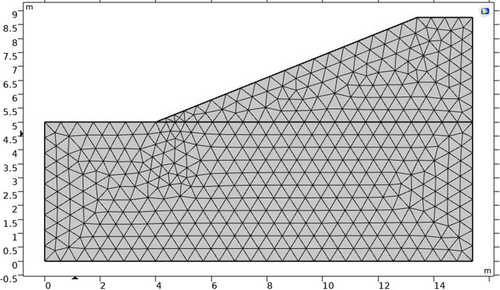
Taking the red flag trunk canal in the project of attracting tenderness in the northern part of Heilongjiang province as the research object, the height of the canal side slope is 3.76 m and the slope ratio is 1:3 according to the research objective. In the vicinity of the canal side slope, there is a high concentration of clay on the soil.
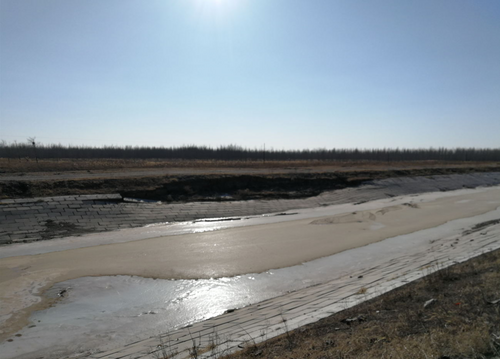
To avoid the influence of the boundary temperature on the model during the calculation process, 2 m of additional length is taken on each side in the length direction to avoid the influence of the boundary temperature on the model, and 5 m is expanded downward from the bottom in the height direction, as shown in Figure 3. A site plan of the canal slopes is shown in Figure 4.
It is possible to calculate the relationship between matrix suction and water content (volametric water content, saturation) by using the formula of Equations (12) and (18). To fit the soil-water characteristic curve, the V-G empirical formula was chosen by this paper and the optimal parameters for the V-G model were found to be a = 0.06, n = 1.2, and m = 0.17.
We used the literature (Wang, 2019; Xu et al., 2001) to determine the thermodynamic parameters of the soil samples for the calculation, and some of the hydrodynamic parameters were used to calculate the parameters using the literature (Wang, 2019; Xu et al., 2001). The values of these parameters are presented in Table 1 along with the corresponding values of the calculated parameters.
| Parameter | Value | Unit | Parameter | Value | Unit |
|---|---|---|---|---|---|
3.2 Boundary conditions and initial conditions
There is adiabatic boundary between the left and right sides of the model, so the water content of the canal will become more complex during the freezing and thawing process. In the calculation process in this paper, the water loss resulting from external rainfall, snowmelt, and evaporation is not taken into account. The water table is fairly high at the moment, and the water is replenished during the freezing process, so the water is continuously migrating to the freezing front as the water is replenished. As part of the simulation, the water boundary conditions for the canal side slopes are set to the initial water content at the lower surface, with the rest set to zero flux. It is set for the top surface of the canal, the side slopes, and the natural ground surface of the canal to be free boundary surfaces, while the boundary on both sides of the model is set as a horizontal fixed constraint, whereas the lower boundary is set to be a vertical fixed constraint. For the calculation and analysis of the model, it was assumed that the initial temperature of 1°C would be used, and that the initial water content of the canal would be 21%, 25%, 29%, 33%, 37%, and 41% respectively.
3.3 Model verification
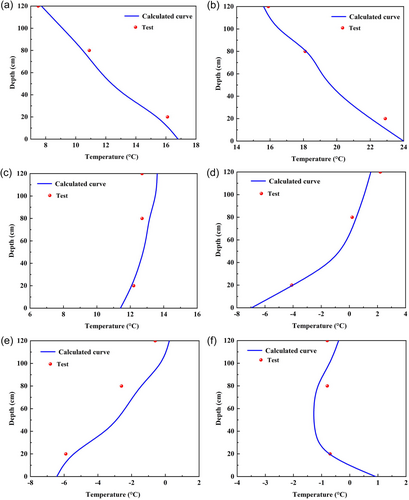
To verify the validity of the canal model, the calculated values were compared to the field monitoring results. As shown in Figure 5. The water field does not have complete measured information, and it is not yet possible to compare the calculated results with the measured results. With the help of the temperature field, the distribution pattern of the water field was indirectly verified. As a whole, the calculated results are very close to the measured results, indicating that the calculation method of the hydrothermal coupling theory can be applied to the calculations.
3.4 Analysis of hydrothermal evolution pattern of large-scale water conveyance trunk canals
3.4.1 The pattern of change in the temperature field
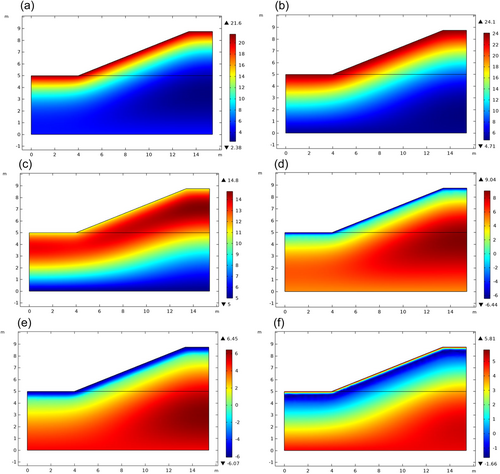
The starting loading time for this calculation starts from 2018 (which is set to be the initial state of the slope), and the changes in the temperature field of the canal slope over a period of 1 year are investigated. Figure 6 gives the distribution of the temperature field for 1 year when the initial water content of the canal is taken as 37%. In response to a gradual increase in the outside temperature, we can expect an increase in the upper surface of the side slope, the shallow layer of soil below 2.5 m of the side slope changes drastically, while the deeper layer is mainly affected by geothermal energy. As can be seen from the figure, the negative temperature began to appear on the 240th day, and after that the temperature continued to decrease, resulting in the soil at the canal's base gradually freezing and eventually reaching the freezing depth that is maximum when the temperature is at its utmost. A freeze-thaw cycle was triggered by a sustained rise in temperature, thawing of frozen soil, and thawing of frozen soil around the 360th day after it had been frozen for a sustained period of time. It is the deeper soil layer that has a high temperature and a gentle curve of change, is less affected by the air temperature than the surface layer, and has less fluctuations in temperature than the surface layer.
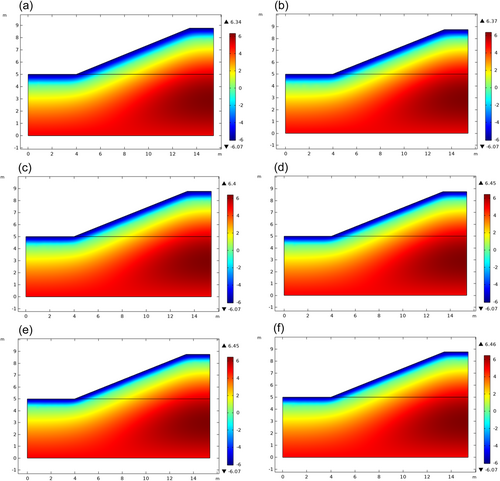
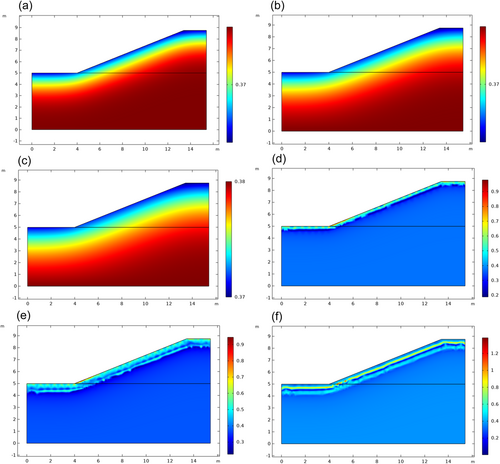
There is an important role for temperature in frost heave studies because it is the primary driving force for water to migrate within the soil and phase into ice, which is what results in frost heave. As the canal is injected with a water content of 21%, 25%, 29%, 33%, 37%, and 41%, Figure 7 shows the distribution of the temperature field for the 300th day. A number of water content canals display the same pattern of temperature distribution, and the temperature gradient of the surface layer of the canal is large, and as one progresses deeper in the canal, the temperature of the canal subsoil becomes less and less affected by the temperature. It is evident from the data that the temperature distribution trend of different water content canals is basically the same.
3.4.2 Patterns of change in the water field
We have studied the change of water content in the slopes of a canal over a period of 1 year. Figure 8 shows the distribution of the water in the slopes of the canal along with the change in the water content over a period of 1 year assuming that the initial water content of the canal slopes was 37%. This figure illustrates that as the temperature decreases, the freezing front moves downwards, causing the water content at the freezing front to increase and increase, as well as the water content in the frozen soil section to increase and increase, so that a suction force will be formed at the freezing front, which will result in the water in the unfrozen area moving to the freezing front as a result, which will result in an increase in the water content of the frozen area. A temperature gradient and a water potential gradient determine the movement of water upward in deeper unfrozen soils. During the ablation period, the frozen layer starts to thaw successively from the upper and lower parts, the temperature rises, the upper frozen soil begins to thaw, and the water is replenished to the groundwater as a result of thawing the upper frozen soil.
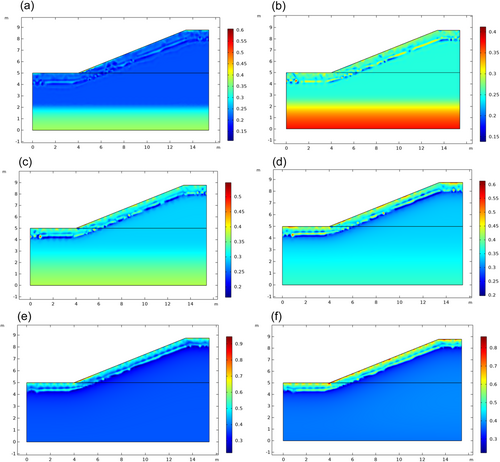
According to Figure 9, the distribution of the water field on the 300th day is shown when the canal takes the initial water content of 21%, 25%, 29%, 33%, 37%, and 41% at the beginning of the 300th day. With the increase of initial water content, it can be seen that when the boundary temperature rises to the soil thawing temperature, the water content at the canal boundary gradually increases, when the initial water content is increased. As the top layer of the frozen soil begins to thaw, the lower part of the soil remains in a frozen state, which means the water cannot seep or can only seep in a small amount, resulting in a large amount of water gathering on the surface of the canal. As the canal slope slopes down, different degrees of water accumulation will happen at the foot of the slope, which is mainly caused by the temperature difference between the slope and the surface at the bottom of the slope.
3.4.3 Canal ice content distribution
The change in ice content of the canal slopes over a period of 1 year was studied. Figure 10 shows the distribution of ice content in the canal after 1 year when 37% of water is used as the starting point. As a result of soil freezing and thawing, water and ice undergo mutual transformation, releasing and absorbing latent heat through phase change. There can be excessive ice content in the soil as a result of migration and phase change, causing it to freeze and thaw. Frozen soil ice content plays a crucial role in revealing the mechanisms of freeze-thaw damage to canal slopes in seasonally frozen ground regions, and few current studies have been reported, so this paper gives the distribution of ice content in the canal. As can be seen below, solid water does not exist in the soil in a large range below the canal base. In addition, different temperatures cause water to accumulate at the foot of slopes, which is largely due to the temperature difference between the slope and surface. At the foot of the slope, the freezing front stays longer due to the different freezing times, resulting in water migration being more pronounced, and the ice content being greater than other areas.
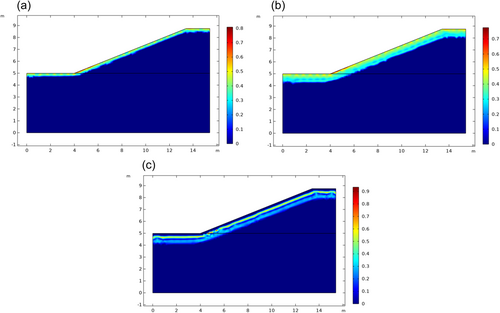
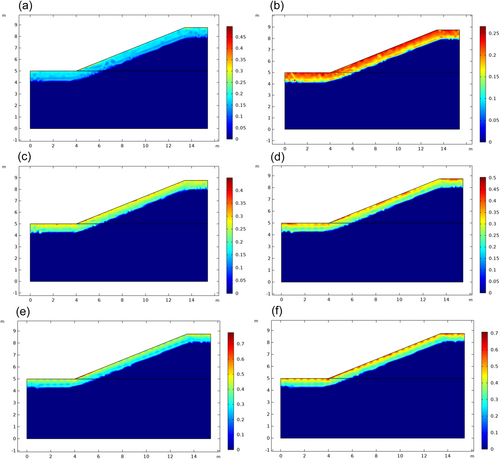
Figure 11 illustrates the distribution of the ice content on the 300th day after the canal takes in the initial water content of 21%, 25%, 29%, 33%, 37%, and 41%. With an increase in the initial water content, the water content at the canal boundary will gradually increase, as will the ice content at the canal boundary, which will also gradually increase as the water content at the canal boundary increases. At the end of the 300th day, it is still in the freezing stage of the canal slopes, and as time goes on, the cold energy within the soil continues to transfer over into ice lenses as it continues to transfer energy. A gradual increase in outside air temperature resulted in a gradual rebound of the slope's upper surface temperature, which then reached the freezing point and began thawing, leaving only a small portion of the internal existence of the ice lenticular body. Eventually, the ice lenticular body will vanish completely.
4 CONCLUSIONS
- (1)
To derive the soil-water characteristic curve, the cumulative particle gradation curve is used. A soil-water characteristic curve is fitted with the VG model to determine the hydraulic characteristics of the canal foundation soil, and then a modified hydrothermal coupling model is used. The V-G model's optimal parameters are a = 0.06, n = 1.2, m = 0.17.
- (2)
The temperature distribution trend of different water content canals is essentially the same as the main driving force for water migration and phase into ice in soil bodies. As the canal depth increases, the influence of the temperature on soil underlying the canal decreases.
- (3)
As the temperature decreases, the freezing front advances downward, and water in the lower unfrozen zone continuously migrates to the freezing front as a result of the temperature gradient and various soil water potentials. When the initial water content increases, the water content at the canal boundary increases. Depending on the difference in temperature between the slope and the surface, different degrees of water accumulation will occur at the foot of the canal slope.
- (4)
It shows the volumetric distribution of ice content generated by canal phase change. In the freezing stage, a partially frozen soil layer is formed in the shallow upper part of the canal slope, so the volumetric ice content gradually increases. Gradually increasing air temperature led to the gradual recovery of slope upper surface temperature, soil slope temperature reached freezing point and began thawing, only a small portion of the ice lenticular body was left, and eventually it disappeared.
ACKNOWLEDGMENTS
The authors are grateful for financial support from the Heilongjiang Provincial Key Research and Development Program Project (JD2023SJ46); Major Science and Technology Project of Ministry of Water Resources (SKS-2022095); Heilongjiang Provincial Research Institutes Scientific Research Business Fund Project (CZKYF2023-1-A009); General program of China Postdoctoral Fund (2021M690946).
ETHICS STATEMENT
None declared.
Open Research
DATA AVAILABILITY STATEMENT
All data generated or analysed during this study are included in this article.


