Occurrence characteristics of microplastics in Dongting Lake, China
Abstract
Lakes are critical sinks for terrigenous microplastics (MPs), yet understanding their ecological risks remains hindered by data uncertainties and the absence of local background values. In this study, an enhanced pollution load index (PLI) model integrating stochastic mathematical methods and species sensitivity distributions (SSD) was developed. The model was applied to assess and predict the ecological risk posed by MPs in the surface water and sediments of Dongting Lake, the second-largest freshwater lake in China. Results revealed average MP abundances of 4889 (range: 1667–9667) items/m3 in surface water and 7058 (range: 3935–10,736) items/kg in sediments within the Dongting Lake District. Small microplastics accounted for 90% of total MP particles, predominantly as polyethylene fragments. SSD-derived predicted no-effect concentrations values were determined as 8620 items/m³ for water and 7022 items/kg for sediments. While surface water exhibited low MP pollution risk and sediments were classified as unpolluted, both compartments showed signs of potential pollution escalation, suggesting non-negligible ecological risks. Through conditional fragmentation modeling, primary MP sources were identified as Yangtze River upstream inputs, atmospheric deposition, and soil erosion. In conclusion, the enhanced PLI model demonstrates effective ecological risk assessment and forecasting capabilities across environmental media, providing strategic insights for lake MP pollution mitigation.
1 INTRODUCTION
Microplastics (MPs), defined as plastics smaller than 5 mm (Moore, 2008), have raised growing concerns due to their toxicity, persistence, and accumulation (Cole et al., 2015; Diepens & Koelmans, 2018). Lakes, as aquatic systems with unique hydrodynamic conditions and ecological value, play crucial roles in flood retention, climate regulation, and agricultural irrigation (Pi et al., 2022). However, the relatively poor mobility and self-purification capacity of lakes render them potential long-term sinks for various pollutants, including MPs (Zhang et al., 2023). Existing literature has documented the widespread occurrence of MP pollution in global lakes, showing diverse abundance levels and characteristics (Nava et al., 2023). Despite numerous studies investigating MP levels and their impacts on biota and human health (Kolanthasamy et al., 2018; Wright & Kelly, 2017), the understanding of MP pollution in lakes remains incomplete, particularly concerning ecological risk assessment.
The pollution load index (PLI) is a widely used tool for assessing MP abundance in the environment (Lithner et al., 2011). However, the conventional PLI method lacks explicit selection criteria for background values and fails to account for uncertainties and spatiotemporal variations in aquatic environments induced by natural processes and anthropogenic activities. Given the projected increase in MP concentrations (Geyer et al., 2017), probabilistic assessment of pollution risk escalation becomes imperative for prioritizing mitigation strategies. The current PLI method demonstrates limited capacity in predicting MP pollution trajectories. In contrast, stochastic mathematical modeling has proven effective in environmental risk assessment and forecasting, particularly for pollutant dynamics (Y. Li et al., 2021).
The species sensitivity distribution (SSD) method, increasingly applied in ecological risk assessments of MPs, calculates predicted no-effect concentrations (PNEC) using ecotoxicity exposure data (Adam et al., 2019; Cui et al., 2024). MP morphotypes, particle sizes, polymer types, and native species exhibit significant variations across environmental contexts. A SSD-based ecological risk assessment by Tunali et al. (2023) incorporated morphological and typological MP discrepancies, while Nam et al. (2023) established mass-based HC5 thresholds through integration of nontraditional toxicity datasets. Constructing regionally representative SSD curves requires careful selection of toxicity data that accounts for locally specific MP characteristics.
Therefore, an enhanced PLI model was developed in this study, integrating the SSD and stochastic mathematical methods to quantify the randomness of incidental or unavoidable errors through probability density functions (PDFs). Our study focused on MP pollution in multiple environmental media in Dongting Lake, the second-largest freshwater lake in China. The objectives of this study were to: (1) characterize MP occurrence patterns in surface water and sediments; (2) establish SSD-based safe concentration thresholds for native species; (3) assess and predict MP pollution levels using stochastic modeling; and (4) identify MP sources through conditional fragmentation analysis.
2 MATERIALS AND METHODS
2.1 Study area and sample collection
Dongting Lake (28°30′–30°20′ N, 111°40′–113°10′ E) is a typical river-connected lake in the middle reaches of the Yangtze River. It comprises three sub-lakes: East Dongting Lake, West Dongting Lake, and South Dongting Lake, with an average surface area of 2.5 × 10³ km2. Primary anthropogenic activities in Dongting Lake include aquaculture, tourism, and shipping. The Lake plays a vital role in water resource regulation, flood mitigation, and ecological equilibrium maintenance within the Yangtze River Basin.
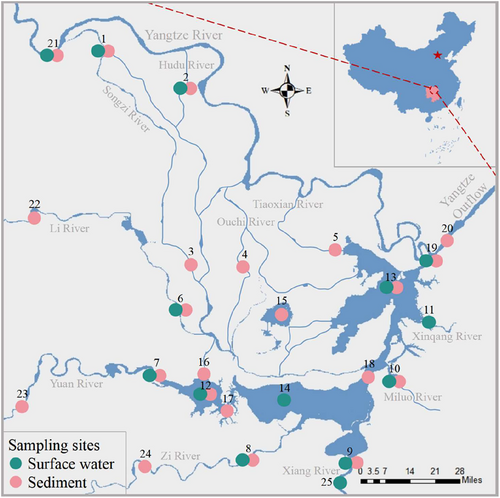
25 sampling sites were established in this study, including Yangtze River inflows and southern tributary inflows, lake areas, and Yangtze River outflow. These sampling sites are illustrated in Figure 1. Fourteen surface water samples and 22 sediment samples were collected from Dongting Lake in June 2021. Surface water samples (10 L) were collected using a 5 L stainless steel bucket and transferred to glass bottles. Sediment samples (20 g) were obtained using a Peterson grab sampler and placed in aluminum bags. Subsequently, all samples were transported to the laboratory, with sediments preserved at –20°C for further analysis.
2.2 Laboratory analysis
MP extraction from water and sediments followed the National Oceanic and Atmospheric Administration protocol (Masura et al., 2015) with modifications. Water samples were filtered through 10 μm metal filter membranes. The particles retained on the membranes were rinsed into beakers using Milli-Q water and treated with 20 mL 30% H2O2 at 60°C for 24 h. Additional 20 mL of 30% H2O2 was added if organic matter was still visible. After digestion, the residue was floated with NaCl (ρ = 1.2 g/cm3) for 24 h. Supernatants were collected and vacuum-filtered through 0.45-μm filter membranes, which were then stored in Petri dishes for drying and analysis.
Wet sediments, stored in aluminum bags, underwent freeze-drying using a lyophilizer (Beta 1-8 LD plus) to remove residual water. Approximately 20 g of sediment was first floated using ZnCl2 solution (ρ = 1.5 g/cm3). The supernatant was then treated with 20 mL of Fenton reagent for 6 h, followed by treatment with 60 mL of 30% H2O2. Subsequent procedures were the same as those used for water samples.
Sample analysis was conducted via quartering. Suspended particles in surface water were examined using a laser confocal microscope Raman spectrometer (DXR2xi). Sediment particles were microscopically identified (SC-III stereo microscope), followed by FT-IR analysis (Nicolet iN10MX). Spectral comparisons with instrument databases determined chemical compositions. MP dimensions were measured instrumentally, with size, morphology, and polymer type systematically recorded.
2.3 Quality assurance and quality control
Plastic materials were avoided during pretreatment to prevent potential secondary contamination. All sampling instruments and laboratory ware were thoroughly rinsed with Milli-Q water before use. The MP analysis was conducted in an ISO-7 certified ultraclean laboratory. Cotton lab coats and nitrile gloves were worn throughout all procedures. Samples and containers were shielded with aluminum foil or lids whenever possible. Field and laboratory blank tests were conducted in triplicate, following the same procedures as samples. No MPs were detected in blank samples, indicating negligible contamination.
2.4 Predicted No-effect concentrations
2.5 Pollution risk assessments
2.5.1 Conventional PLI method
2.5.2 Enhanced PLI method
2.6 Fragmentation and stability of MPs
2.7 Data analysis
Statistical analyses were conducted using SPSS 19, with significance determined at a p-value of <0.05. The SSD curve was developed using the SSD Toolbox. The conditional fragmentation model was fitted using SigmaPlot 14.0. Figures were plotted using ArcGIS 10.6 and Origin 2021.
3 RESULTS AND DISCUSSION
3.1 MPs occurrences in Dongting Lake basin
3.1.1 MPs in surface water
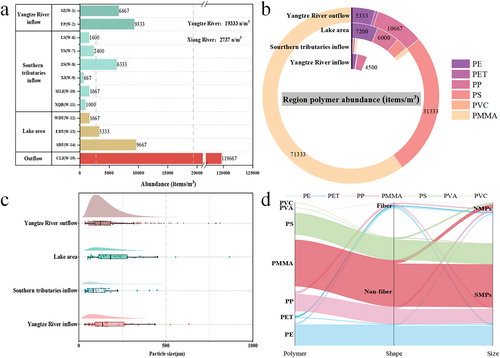
MP occurrences were investigated throughout the Dongting Lake basin. MPs were detected in all surface water samples with abundances ranging from 667 to 119,667 items/m3, while lake areas ranged from 1667 to 9667 items/m3 (Figure 2a). Spatially heterogeneous MP distributions reflected hydrodynamic influences, with East (3333 items/m³), West (1667 items/m³), and South Dongting Lake (9667 items/m³) exhibiting distinct patterns. The lake-wide average reached 4889 ± 3446 items/m³, lower than Yangtze River inputs (19,333 items/m3) and higher than Xiang River contributions (2737 items/m3). MP levels in freshwater were typically influenced by surrounding environmental conditions and sampling methods (Dusaucy et al., 2021). Compared with other studies on MPs in freshwater, the MP abundance in Dongting Lake was at a moderate level (Table 1), higher than previous study (Wang, Yuan, et al., 2018), and similar to some lakes and reservoirs in Beijing (Niu et al., 2024) and the Three Gorges Reservoir (Di & Wang, 2018). The highest MP abundance (119,667 items/m3) was detected in the outlet channel from Dongting Lake to the Yangtze River. On one hand, as China's largest inland port, MPs from residents, transportation, and industry in Chenglingji may enter the water body via various pathways. On the other hand, the narrowing of the water surface at the outlet may increase the abundance of MPs (Wang, Yuan, et al., 2018). For tributaries, the MP input from the Songzi and Hudu rivers (8000 ± 1333 items/m3) was higher than from southern tributaries (2278 ± 3028 items/m3) as primary MP sources.
| Study areas | Abundances of MPs | References | |
|---|---|---|---|
| Water (items/m3) | Sediment (items/kg) | ||
| Dongting Lake-1 | 4889 | 7058 | This study |
| Jiayan Reservoir | 27,534 | 6905 | Niu et al. (2022) |
| Minjiang river | 19,860 | 1391 | Yan et al. (2019) |
| Poyang Lake | 19,500 | 280 | Yuan et al. (2019) |
| Rivers in Chengdu | 15,880 | / | X. Li et al. (2021) |
| Taihu Lake | 14,600 | 122.8 | Su et al. (2016) |
| Fall Creek Dams | 10,000 | 200 | Watkins et al. (2019) |
| Danjiangkou Reservoir | 7205 | 1818 | Lin et al. (2021) |
| Wei River | 7185 | 840 | Ding et al. (2019) |
| Three Gorges Reservoir-1 | 6214 | / | Xu et al. (2022) |
| Lakes in Beijing | 4758 | / | Niu et al. (2024) |
| Three Gorges Reservoir-2 | 4703 | / | Di & Wang (2018) |
| Nanhu Lake | 4664 | / | Wen et al. (2022) |
| Lakes in Changsha | 4242 | / | Yin et al. (2019) |
| Dianchi Lake | 2902 | Deng et al. (2022) | |
| Pearl River | 2724 | 1669 | Lin et al. (2018) |
| Nakdong River | 2527 | 1970 | Eo et al. (2019) |
| Sha River | 1772 | 4776 | Zhang et al. (2022) |
| Dongting Lake-2 | 1191 | / | Wang, Yuan, et al. (2018) |
| Qing River | 1164 | / | Wei et al. (2022) |
| Lake in Yangtze River | 780 | 219 | Li et al. (2019) |
| Lhasa River | 692 | 188 | Jiang et al. (2019) |
| Wen-Rui Tang River | / | 32,947 | Wang, Su, et al. (2018) |
| Derwent | / | 3315 | Willis et al. (2017) |
| Lake Onego | 2189 | Zobkov et al. (2020) | |
| River Main | / | 1077 | Klein et al. (2015) |
| Rivers in Shanghai | / | 802 | Peng et al. (2018) |
| Yangtze River | 611 | Yang et al. (2023) | |
| Huangjinxia Reservoir | / | 558.1 | C. Li et al. (2020) |
| Poyang Lake | / | 280 | Yuan et al. (2019) |
The polymer abundances of MPs collected from surface water in Dongting Lake are shown in Figure 2b. Among the 562 MPs, seven types of synthetic polymers were identified. Polymer distributions exhibited significant spatial heterogeneity across lake regions. In inflows and lake areas, PE was the most common type (48%), followed by PP (33%), which are commonly used to make plastic bags and containers. Additionally, small amounts of PS, PMMA, PET, PVC, and PVA were observed. Conversely, PMMA (60%) and PS (26%) occupied the largest proportion of all identified particles in outflow, with smaller quantities of PP, PE, PET, and PVC. The differences in the predominant polymer types between outflow and lake areas indicated that local point-source pollution was the primary source of MPs at this sampling point, rather than inputs from upstream and lake areas.
The size distribution of MPs collected from the Dongting Lake surface water is shown in Figure 2c. Detected MPs were separated into small-sized MPs (SMPs, <300 μm) and normal-sized MPs (NMPs, >300 μm). The average size of MPs in the surface water was 167 ± 165 μm, with SMPs (89%) dominating all sampling sites. For surface water, the sizes of MPs varied across regions. The average sizes of MPs in Yangtze River inflows (249 ± 384 μm) and lake areas (231 ± 215 μm) were relatively close, exceeding southern tributary inputs (120 ± 96 μm) and Yangtze River outflow (161 ± 116 μm). These findings further indicated that the Yangtze River input was the primary contributor of MPs in Dongting Lake.
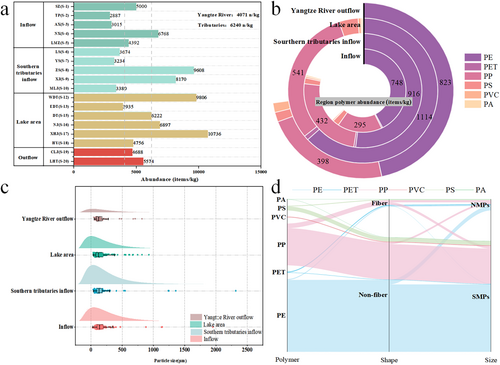
MPs were classified into fiber and non-fiber morphotypes. Non-fiber particles dominated both water and sediment samples (both above 90%). Distinct size distributions emerged between morphotypes (Figures 2d and 3d). Non-fibers averaged 152 ± 526 μm, with SMPs comprising up to 93%, while fibers averaged 564 ± 526 μm, with SMPs accounting for only 42%. PET was primarily composed of fibers (76%), with a relatively high proportion of NMPs (50%). In contrast, other polymers were mainly composed of non-fibers (95%), with NMPs accounting for only 9%. These differences in primary morphologies among various polymers result in variations in their particle size distributions.
3.1.2 MPs in sediments
MP occurrences were also examined in sediments in Dongting Lake. MPs were identified in all collected sediment samples with abundances varying between 2887 and 10,736 items/kg, and the abundance in lake areas ranged from 3935 to 10,736 items/kg (Figure 3a). Despite some spatial heterogeneity of MPs in sediments, their abundances were uniformly distributed across the entire lake region compared to surface water. The abundance of MPs in sediments in South Dongting Lake (10,736 items/kg) was higher than that in West Dongting Lake (8351 items/kg) and East Dongting Lake (4345 items/kg), consistent with the results from surface water. We have compared the abundance of MPs in sediments between Dongting Lake (7058 ± 2478 items/kg) and other freshwater regions (Table 1). Generally, variations in MP abundance in sediments from freshwater environments are smaller than in surface water (Yin et al., 2020). Except for the Wen-Rui Tang River, the MP abundance in Dongting Lake is relatively higher compared to previous studies, such as those in Jiayan Reservoir (6905 items/kg) and Danjiangkou Reservoir (1818 items/kg). MP inputs from the Yangtze River and southern tributaries were 4421 ± 1426 and 5613 ± 2717 items/kg, respectively, with an abundance of 5131 ± 443 items/kg for MPs in the Yangtze River outflow. The abundance of MPs in sediments within the lake region was also higher than that in inflows and outflow, indicating that sediments in Dongting Lake may serve as a potential sink.
The polymer distribution of MPs collected from Dongting Lake sediments is shown in Figure 3b. Six distinct polymers were detected among the 628 identified MPs, including PE (59.7%), PP (34.3%), PS (4%), PET (1.1%), PVC (0.6%), and PA (0.3%). Low-density PE (0.95 g/cm3) and PP (0.92 g/cm3) dominated over high-density MPs like PVC (1.37 g/cm3) and PET (1.38 g/cm3). This could be attributed to two factors. Firstly, given their extensive usage, PE and PP have greater chances to enter the environment. Secondly, biofouling and hydrodynamic processes facilitate MP settling from water columns (D. Li et al., 2020). Overall, the MP composition in sediments exhibited greater regional consistency compared to that in surface water.
The size distribution of MPs in sediments in Dongting Lake is shown in Figure 3c. For sediment samples, the differences in MP sizes across the four regions (166 ± 144 to 193 ± 229 μm) were relatively small. The average size of MPs was 184 ± 213 μm, and SMPs (91%) were also predominant in sediments. This is because SMPs have a relatively larger surface area, making them more susceptible to changes in biofilm density and hydrophilicity, thus more prone to sinking (Li et al., 2024; Zhang et al., 2023). Meanwhile, fibers were not conducive to the colonization of multicellular organisms (Amaral-Zettler et al., 2021), resulting in the dominance of non-fibers in sediments.
3.2 SSD model of MPs in Dongting Lake
The SSD model was constructed to calculate the threshold of MPs in the study area. In total, 12 effective NOEC/HONEC/LOEC toxicity data points of MPs exposed to water were gathered for native species in Dongting Lake (Supporting Information S1: Table S1). The NOEC/HONEC/LOEC values for MPs ranged from 0.182 to 7640 items/mL. The species in the study included animals and plants, spanning six phyla and ten families. The tested MPs consisted of fragments, spheres, and irregular shapes. Polymer types included PE, PS, PP, and PVC, with particle sizes ranging from 35 to 400 μm. The most sensitive species based on number concentrations was Carassius auratus (NOEC = 0.182 items/mL) in the chordata phylum, showing adverse effects on growth after 7 days of exposure to spherical PS with a size of 50 μm. The least sensitive species was Allonais inaequalis in the Annelida phylum (HNOEC = 7640 items/mL), which experienced mortality after 4 days of exposure to irregular PE of 44 μm. The SSD model was fitted using the Weibull distribution and Metropolis-Hastings method based on the Bayesian p-values. The SSD results are shown in Figure 4a, and the PNEC value for species was determined from the fitting results. In this study, the calculated HC5 value was 43100 items/m3, which after dividing by an AF of 5 (ECHA, 2008), yielded a PNEC value of 8620 items/m3.
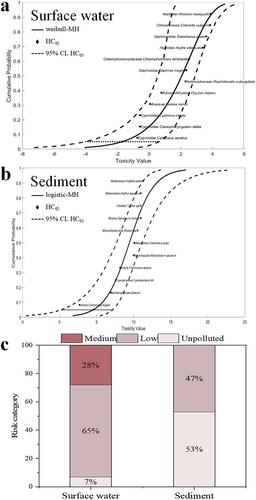
A total of 11 effective MP toxicity data points (NOEC/HONEC/LOEC) exposed to sediment media were compiled in this study (Supporting Information S1: Table S1). The chronic NOEC values after extrapolation ranged from 500 to 2.1 × 10¹¹ items/kg. The species encompassed six phyla and eight classes. The tested MPs included fragments and spheres composed of PE, PS, and PVC, with particle sizes ranging from 1 to 500 μm. Among the species tested, Chironomus tepperi (insecta) exhibited the highest sensitivity, with a NOEC of 500 items/kg, showing adverse effects on growth after 10 days of exposure to various sizes of spherical PE (1–54 μm). Conversely, the least sensitive species, Hyalella azteca (malacostraca), had a NOEC of 2.1 × 10¹¹ items/kg, experiencing mortality after 28 days of exposure to fragmented PE (200–500 μm). Using the Logistic distribution and Metropolis-Hastings method, an SSD model was developed, and the results are depicted in Figure 4b. The calculated HC5 value for sediment samples was 35,100 items/kg, which after division by an AF of 5, yielded a PNEC value of 7020 items/kg.
3.3 Pollution risk assessments
We evaluated the MP pollution using the enhanced PLI model, and the results are shown in Figure 4c and Table S2. The results indicated a low pollution risk of MPs in the surface water. Moreover, we noted that MPs in surface water had a probability of 0.28 of deteriorating to the “medium” category. The pollution risk of MPs in sediments was classified as unpolluted, with a probability of 0.47 for MPs deteriorating to the “low” category. Therefore, more attention should be paid to the potential pollution risk posed by MPs in surface water. To validate the enhanced PLI model, we applied it to historical data on MPs in Dongting Lake (using the same quantification units). The results indicated that past MP pollution risk levels were classified as “unpolluted” (Wang, Yuan, et al., 2018; Yin et al., 2020; Yin et al., 2021). Furthermore, the historical data revealed a gradual increase in MP abundance over time, consistent with the trends observed in our current study. This cross-validation using data from different periods confirms the reliability of the model.
The assessment results for the conventional PLI method are also listed in Table S2 using the PNEC value. The advantages of the enhanced PLI model were demonstrated by comparing its assessment results with those of the conventional PLI method. The assessment results for the conventional PLI method, using the PNEC value for MPs as the reference, showed unpolluted conditions for both surface water and sediments. The pollution categories of MPs in sediments evaluated using the conventional method were consistent with those from the enhanced PLI model. However, the conventional method underestimated the risk of MP pollution in surface water and the impact of heavily polluted sites. Additionally, the conventional PLI method failed to reveal the potential deteriorative risks of MPs in surface water and sediments. In conclusion, the enhanced PLI model exhibits higher predictability for MP pollution assessment.
3.4 MP source identification in Dongting Lake
3.4.1 Fragmentation and stability of MPs
The conditional fragmentation model was used to depict the fragmentation and stability of MPs in Dongting Lake (Figure 5 and Supporting Information S1: Table S3), which varied across different regions within the lake. A higher α value implies greater stability and a lower possibility of further MP fragmentation. The α values exceeding 1 in all regions of Dongting Lake (ranging from 1.10 to 2.40) suggested that larger MPs were more susceptible to weathering and fragmentation (Wang, Li, et al., 2021). The range parameter λ value is linked to MP sizes, with a higher value indicating a greater degree of MP fragmentation. When the cumulative percentage reached 63.2%, the characteristic particle size of MPs in surface water was 115, 189, and 217 μm in southern tributary inflows, Yangtze River inflows, and lake areas, respectively. The characteristic particle size of MPs in sediments was 154, 168, and 156 μm, respectively. The λ value in southern tributary inflows was higher than that in Yangtze River inflows and lake areas for both surface water and sediments, indicating a high degree of MP fragmentation. The exposure pathways and biological effects of MPs vary with particle size. SMPs tend to induce more severe toxic responses and combined toxic effects through interactions with other toxic substances in the environment, such as heavy metals and persistent organic pollutants (Ziajahromi et al., 2017). Additionally, SMPs are more readily ingested by organisms and can be transferred through biomagnification, posing threats to the entire ecosystem and even human health (Bouwmeester et al., 2015). Therefore, assessing the characteristic particle size of MPs is crucial for understanding their environmental risks and developing effective management strategies.
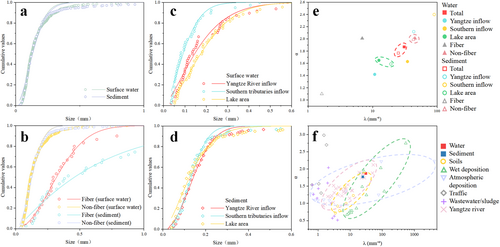
The size distribution of MPs was also associated with their morphologies, indicating that the stability and fragmentation characteristics of MPs varied with different morphologies. The characteristic particle sizes of non-fibrous MPs and fibers were 152 and 517 μm, respectively. The λ and α values of non-fibrous MPs (52.25 and 2.10) were both greater than those of fibers (2.31 and 1.27), suggesting that non-fibrous MPs exhibit higher stability. This is likely because fibers, with a higher surface area-to-volume ratio, are more susceptible to natural weathering (Wang, Li, et al., 2021).
Differences in the stability and fragmentation characteristics of MPs across various environmental media were also observed (Figure 5e). The λ and α values of non-fibrous MPs in the surface water and sediments were similar. In contrast, the λ and α values of fibers varied between surface water and sediments. This indicates that non-fibrous MPs are more likely to migrate within the water column. Due to the dominance of non-fibrous MPs in Dongting Lake, the λ and α values of MPs in sediments and water were relatively close. For different regions, the λ and α values in surface water and sediments were similar in lake areas but exhibited disparities in the inflows, which could be attributed to variations in hydrodynamic conditions.
3.4.2 MP source identification
MP sources in the environment encompass human activities, agriculture, and industrial manufacturing (Lin et al., 2021). Dongting Lake, with its abundant aquatic resources, is one of China's important bases for grain and aquaculture. Numerous agricultural lands and fisheries surround Dongting Lake, and the plastics utilized in equipment, such as greenhouses and fishing nets contribute to MPs (Kim et al., 2021). The developed land and water transportation systems also introduce MPs into Dongting Lake through processes such as ship paint erosion and tire abrasion from vehicles (Ding et al., 2019). The special industry also constitutes a noteworthy MP source that cannot be overlooked. PMMA and PS were the predominant polymer types in outflow because there is an imported vehicles port built near this sampling point. PMMA and PS are commonly employed in the shells, lampshades, and decorations of automobiles. Additionally, Dongting Lake, as a popular tourist attraction, also faces the challenge of MP pollution from domestic waste generated by the resident population and tourists.
Information on fragmentation and stability in various environmental media from the conditional fragmentation model provides useful evidence for the MP source identification (Wang, Li, et al., 2021). In this study, λ and α in Dongting Lake and other environmental media, including soil, dry and wet deposition, traffic, wastewater/sludge, and the Yangtze River, are shown in Figure 5f and Supporting Information S1: Table S3. It can be observed that MPs in different environmental media differ in their λ and α values. The λ and α values in Dongting Lake fell within the range of those from dry and wet deposition. Dongting Lake receives multiple inflows, resulting in a significant influx of MPs into the lake (Li et al., 2013). The λ and α values of MPs also aligned with those from the Yangtze River, indicating its contribution to MPs in the lake. Additionally, the λ and α values were close to those from soil samples, suggesting soil and agricultural activities as potential MP sources in Dongting Lake. Overall, dry and wet deposition, agriculture, and upstream inputs were identified as the main MP sources in Dongting Lake.
4 CONCLUSION
This study investigated the occurrence, pollution risk, and sources of MPs in the surface water and sediments of the Dongting Lake basin. The average MP abundances were 4889 items/m3 and 7058 items/kg in the surface water and sediments, respectively, with diverse MP compositions found in different regions and environmental media. SMPs constituted a high proportion of the total MPs and were more prone to sinking than NMPs. The conditional fragmentation model may help identify MP sources based on their fragmentation and stability. Results showed that dry and wet deposition, soil, and upstream inputs from the Yangtze River could be important sources of MPs in Dongting Lake. Furthermore, an enhanced PLI model was developed to address the limitations of the conventional PLI method. The enhanced PLI model enables more comprehensive and accurate pollution evaluation of MPs in the environment. According to the model, MPs in the surface water of Dongting Lake showed a low pollution risk, while MPs in sediments were classified as unpolluted. The probability of MPs in surface water deteriorating to the “medium” category was 0.28. The enhanced PLI model can serve as a valuable tool for assessing and predicting MP pollution, thereby facilitating the refinement of MP control strategies.
ACKNOWLEDGMENTS
This study was funded by the National Natural Science Foundation of China (42277262) and the Research & Development Support Program of China Institute of Water Resources and Hydropower Research (WE0199A042021).
Open Research
DATA AVAILABILITY STATEMENT
Data is available upon request due to privacy/ethical restrictions.
None declared.


