The significance of morphometric analysis of Shimsha River, Karnataka, India to understand the hydrological and morphological characteristics
Abstract
Morphometric analysis is crucial for advancing in various fields, including geomorphology, hydrology, environmental sciences, and geological studies. The objective of the present study is to understand the hydrological and morphological characteristics of the Shimsha River, which flows through the fluvial deltaic plain in the semiarid environment of Karnataka. Remote sensing and geographic information system have been used as mapping and efficient tools for drainage basin morphometry. The emphasis is laid on geological, geomorphological, hydrological, and fluvial features under linear, aerial, shape, relief, geometric, morphotectonic, and social morphometric parameters. The basin area is about 8741 km2, with a dendritic to subdendritic pattern. The sinuosity index is 1.6, which indicates meandering in nature. Areal parameters suggest that the drainage basin has a moderate surface permeability, homogenous lithology, run-off, erodibility, low relief conditions, infiltration rate, and a well-developed drainage network. Shape parameter indicates that the basin is subelongated with flatted peak flow and longer duration. Relief factor indicated low relief and intermediate stage of the incision rate. The river has an asymmetry factor is 38.65 and it shows that the channel has shifted southwest. The river shows a perfectly graded profile, with a considerable amount of incision and deposition along its profile showing tectonically unstable, based on the spatial distribution of the potential groundwater zone of about (5260 km2), other waterbody masks covered (285 km2). Standard visual interpretation techniques were applied to recognize and interpret the land use and land cover patterns. A basin rich in clay-rich soil may lead to a massive flood. Essentially, physiographical and structural conditions controlled the stream order of the basin. The increase in the stream length ratio from lower to a higher order. That indicates a mature geomorphic stage of the study area. Rainfall and local lithology impact the development of segments of the stream.
1 INTRODUCTION
A watershed is an area where runoff from rainfall collects and flows through a common outlet point (Schwab et al., 1981). Climate change and human activities have profoundly altered the evolutionary processes and developmental trends of the hydrology and geomorphology of rivers.
Morphometry is the measurement and mathematical analysis of the configuration of the land surface, shape, and dimensions of its landforms (Clarke, 1966; Pareta & Pareta, 2011; Strahler, 1964). The estimations of morphometric parameters like stream order, stream length, bifurcation ratio, channel length, relative relief, drainage density, stream frequency, form factor, shape factor, texture ratio, elongation ratio, circularity ratio, and compactness constant are dependent on the formulae proposed by (Bharath, Maddamsetty, Manjunatha, et al., 2023; Bharath, Maddamsetty, & Uttam, 2023; Gautam et al., 2023; Gautam et al., 2020; Horton, 1945; Kumar et al., 2018; Miller, 1953; Schumm, 1956; Strahler, 1964). The gradient of drainage and slope of the fluvial systems is the important component of morphometric characteristics of the river basin (Nautiyal, 1964; Strahler, 1964).
Morphometric characterization requires measurement of the aerial, linear, and relief aspects of the drainage basin (Gautam et al., 2020; Magesh et al., 2013; Nag & Chakraborty, 2003; Shreve, 1966). A drainage basin's spatial and isomorphic aspects are relevant for hydrological investigations, including estimating groundwater potentiality, river management, and environmental assessment (Gautam, Singh, Kumar, et al., 2022). Drainage morphometry is necessary for analyzing many hydrological processes within the watershed (Magesh & Chandrasekar, 2014). Morphometric analysis is used to evaluate flood susceptibility (Obeidat et al., 2021). Soil erosion is related with linear and relief aspects such as bifurcation ratio, drainage density, stream frequency, drainage texture, relief, ruggedness number (Javed et al., 2011).
Landscape changes and drainage evolution can be understood by evaluating geomorphic features and geographic indices, such as longitudinal profile, slope, asymmetry factor, and basin elongation ratio (Bull et al., 1977; Cox, 1994; Cuong & Zuchiewicz, 2001; Dehbozorgi et al., 2010; Gautam et al., 2020; Gautam & Singh, 2023; Hack, 1957; Hare et al., 1985; Keller, 2002; Perez-Pena et al., 2010; Raj, 2012; Singh & Awasthi, 2011a, 2011b; Singh et al., 2018). Asymmetric factors related to basin side slopes are associated with major waterways (Cox, 1994; Cuong & Zuchiewicz, 2001; Dehbozorgi et al., 2010; Gautam & Singh, 2023; Hare et al., 1985; Keller, 2002; Pérez-Peña et al., 2010; Raj, 2012).
Remote sensing and geographic information system (GIS) technology, calculation of hydro morphometric features and terrain analysis of the catchment (Aparna et al., 2015; Odiji et al., 2021; Rekha et al., 2011). Many previous researchers have used drainage analysis using remote sensing techniques (Biswas et al., 1999; Gautam, Singh, Singh, et al., 2022; Krishnamurthy & Srinivas, 1995; Nag, 1998; Nag & Chakraborty, 2003; Nongkynrih & Husain, 2011; Sarkar et al., 2020; Srivastava, 1997; Waikar & Nilawar, 2014; Withanage et al., 2015). Delineation of stream networks and the river boundary can be accomplished by traditional methods using toposheets and onsite observations or by sophisticated approaches using remote sensed data and GIS tools (Bharath et al., 2021; Gautam & Singh, 2022; Kadam et al., 2022; Rajasekhar et al., 2020).
The Shimsha River is a significant river in Peninsular India, primarily flowing through Karnataka. It is a left tributary of the Cauvery River (Bharath, Maddamsetty, Manjunatha, et al., 2023; Bharath, Maddamsetty, & Uttam, 2023). In this study, river morphometry plays an important role in the modern perspective by providing insights into various aspects of river systems and their management such as flow characteristics, flood risk assessment, floodplain mapping, erosion control, habitat assessment, sediment dynamics, land use planning, and water resource management. It aids in sustainable river management, disaster risk reduction, and the preservation of vital aquatic ecosystems. Hence, this study aims to analyse the morphometric and morphotectonic parameters of the Shimsha basin in Karnataka, India, using topographic maps of Survey of India and Shuttle Radar Topography Mission (SRTM) digital elevation model (DEM) data.
In this study uses the GIS technique to consider their hydrological behavior to describe the characteristics of the Shimsha River in the western ghats. The objectives of this study are to (1) delineate the drainage characteristics, (2) assess the linear, areal, and relief, geometric, and morphotectonic parameters of the basin, and (3) to develop important measures for adequate water and soil conservation.
2 STUDY AREA
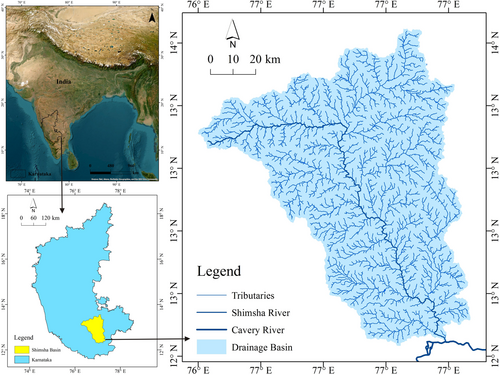
The Shimsha River is a left tributary of Cauvery River. Geographically it lies between 12°14′ and 13°37′N latitude and 76°7′ and 77°27′E longitude (Figure 1). The basin runs roughly in a northwest–southeast direction. It originates from Tumkur district at an elevation of 214 m and, after 224 km distance, drains into the Cauvery River as a six-order stream near Ganalu waterfall, Ganalu district, Karnataka. In the western part, the basin has high relief and steep slopes and while the rest of the part is moderate to the low slope. That is characterized by irregular branching in many directions of tributary streams joining the main channel. Subtributaries, namely Eravaishnavi, Kanihalla, Chickkhole, Hebbahalla, Mullahalla, and Kanva. Physiographically is occurs in fluvial-deltaic plains. The basin is hot and subtropical. The temperature of the area varies from 20°C to 38°C. The mean rainfall varies from 600 and 800 mm in semiarid areas. The major rainfall seasons in the area are south-west monsoon (Bharath, Maddamsetty, Manjunatha, et al., 2023; Bharath, Maddamsetty, & Uttam, 2023).
2.1 Geology
The entire district of Tumkur is situated west and east of Dharwar Craton and is essentially part of the hard rock terrain and comprises mainly two rock types namely Closepet Granite and Peninsular Gneissic Complex (Geological Survey of India, 1981).
3 MATERIALS AND METHODS
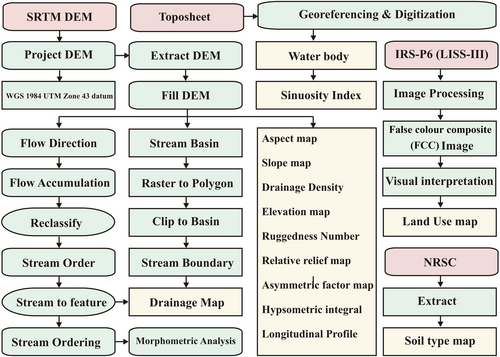
The base maps of the Shimsha River are prepared based on Survey of India topographic maps on a 1:50,000 scale 57C7/8/11/12/15/16, 57D9/10/13/14/15, 57G2/3/4/7, and 57H1/2/3/5/6/7 and stream network is extracted using SRTM DEM with the help of ArcGIS 10.4. SOI topographic maps of scale 1:50,000 are georeferenced and projected to WGS 1984 UTM zone 43 North datum. The soil map was prepared by digitizing the National Remote Sensing Centre (Table 1). For classification of land use/land cover features of the study area (Resourcesat-II, Indian Remote-Sensing Satellite-P6, Linear Imaging Self-Scanning System-III) of December 22, 2011 imagery. The slope gradient, aspect, and hydrological map for the rivers were prepared based on these results. Channels were classified (Strahler, 1964) following the drainage order and followed by drainage extraction, accumulation module, and calculation of the morphometric parameters using the stream ordering module. The drainage network was analyzed according to Horton's laws (Horton, 1945) and (Strahler, 1964) law specifying the stream orders (Figure 2).
| Data type | Range | Data source |
|---|---|---|
| Toposheets | 57C7/8/11/12/15/16 | Survey of India |
| 57D9/10/13/14/15 | ||
| 57G2/3/4/7 | ||
| 57H1/2/3/5/6/7 | ||
| SRTM | DEM (90 m) | https://srtm.csi.cgiar.org/srtmdata |
| Soil | NRSC, India | |
| LULC | Resourcesat-II, IRS-P6, IRS-P6, LISS-III (23.5 m) | https://bhuvan-app3.nrsc.gov.in/data |
- Abbreviations: DEM, digital elevation model; IRS-P6, Indian Remote-Sensing Satellite-P6; LISS-III, Linear Imaging Self-Scanning System-III; LULC, land use/land cover; NRSC, National Remote Sensing Centre; SRTM, Shuttle Radar Topography Mission.
4 RESULTS
Various morphometric parameters such as linear, aerial, shape, relief, geometric, and morphotectonic have been computed and analysis of morphometric analysis of Shimsha River is discussed in the following sections.
4.1 Linear aspects of the basin
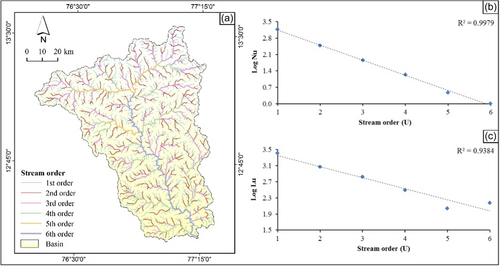
The Shimsha basin is a sixth-order river basin with lower-order stream dominance (Figure 3a). The total stream number declines slowly as the stream order increases the stream number and the total stream number (Figure 3b). The total stream number of all orders is 1871. The river basin exhibits 1476, 302, 72, 17, 3, and 1 of first, second, third, fourth, fifth, and sixth order, respectively. The total stream length of all orders is 4975 km and the total (Lµ) of first, second, third, fourth, fifth, and sixth order streams is 2574, 1172, 660, 311, 110, and 148 km, respectively. Stream length ratio is 0.64 for this basin. The values of the mean bifurcation ratio are 4.40 (Table 2).
| Parameters | Result | Formulae | References | |||||
|---|---|---|---|---|---|---|---|---|
| Linear aspect | ||||||||
| Stream order | I | II | III | IV | V | IV | Hierarchical rank | Strahler (1964) |
| Stream number | 1476 | 302 | 72 | 17 | 3 | 1 | N1 + N2++ … Nμ | Horton (1945) |
| Stream length (km) | 2574 | 1172 | 660 | 311 | 110 | 148 | L1 + L2++ … Lμ | Horton (1945) |
| Stream length ratio | II/I | III/II | IV/III | V/IV | V/VI | Lμ/(Lμ − 1) | Horton (1945) | |
| 0.46 | 0.56 | 0.47 | 0.35 | 1.35 | ||||
| Bifurcation ratio | I/II | II/III | III/IV | IV/V | V/VI | Nμ/Nμ + 1 | Strahler (1964) | |
| 4.89 | 4.19 | 4.24 | 5.67 | 3.00 | ||||
| Areal aspect | |||
| Drainage density (km/km2) | 0.57 | (Lμ)/A | Horton (1945) |
| Stream frequency (km/km2) | 0.21 | (Nμ)/A | Hadley and Schumm (1961) |
| Drainage texture (km−1) | 3.24 | Dd × Fs | Smith (1950) |
| Length of overland flow | 0.88 | Lg = 1/2Dd | Horton (1945) |
| Shape aspects | |||
| Elongation ratio | 0.79 | (2/Lb) (A/π)0.5 | Schumm (1956) |
| Circulatory ratio | 0.33 | Rc = 4πA/P2 | Miller (1953) |
| Form factor | 0.49 | Ff = A/Lb2 | Horton (1932) |
| Relief aspect | |||
| Basin relief | 943 | H − h | Hadley and Schumm (1961) |
| Relative relief ratio | 163.43 | R × 100/P | Strahler (1956) |
| Ruggedness number | 0.53 | Dd ×(R/1000) | Strahler (1956) |
| Hypsometric integrals | 0.5 | Sbm − h/H − h | Strahler (1952) |
| Geometric aspect | |||
| Basin area (sq. m) | 8741 | A | Schumm (1956) |
| Basin perimeter (km) | 577 | P | Schumm (1956) |
| Basin length (km) | 133 | Lb | Schumm (1956) |
| Channel length (km) | 224 | Cl | |
| Morphotectonic aspect | |||
| Sinuosity index | 1.65 | Cl/Vl | Leopold et al. (1964) and Mueller (1968) |
| Asymmetry factor | 38.65 | 100 (Ar/At) | Molin et al. (2004) |
| Longitudinal profile (m) | Lg | GIS analysis/DEM | |
- Abbreviations: DEM, digital elevation model; GIS, geographic information system.
4.2 Areal aspects of the basin
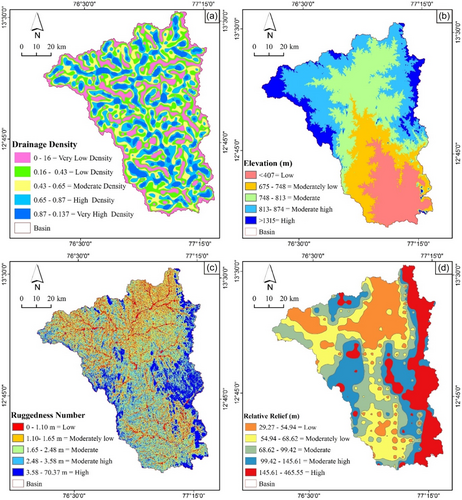
The drainage density is characterized by stream length per unit area in a region (Figure 4a). It is 0.57 km/km2 for this basin. The stream frequency for this basin has been calculated to be 0.21 km/km2. The drainage textures values are 3.24 (km−1). The length of overland flow are 0.88 (Table 2).
4.3 Shape aspects of the basin
The elongation ratio of basin is 0.79 km/km2, circulatory ratio values are 0.33, and form factor values are 0.49 (Table 2).
4.4 Relief aspects of the basin
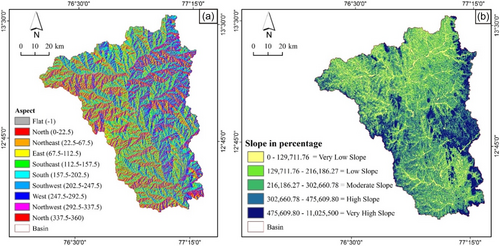
Relief aspect is included concerning topographic parameters (e.g., basin relief, ruggedness number, relative relief, aspect, and hypsometric integrals [HI]). Here, the highest point of the basin is 1315 m amsl and the lowest point 407 m amsl (Figure 4b). The basin relief of the Shimsha basin is 943 m. The ruggedness number of the basin is 0.53 (Figure 4c). Relative relief (Rrp) is 163.43 m for Shimsha basin (Figure 4d). The aspect map probably applies to know a slope's direction. According to the aspect analyses, the area comes under flat 1.29%, sides facing the north 6.12%, sides facing the northeast 12.54%, sides facing the east 13.92%, sides facing the southeast 13.29%, sides facing the south 12.34%, sides facing the southwest 12.75%, sides facing the west 12.1%, sides facing the northwest 11.04%, and sides facing the north 4.62% (Figure 5a). HI of the basin is calculated the HI < 0.5 (Table 2).
4.5 Geometric aspects
The basin area of the Shimsha River is 8741 km2, basin length and perimeter are 133 and 577 km, respectively.
4.6 Morphotectonic aspect
Rivers having a sinuosity of 1.65. The Shimsha River has AF 38.65.
5 DISCUSSION
5.1 Areal aspect
The evaluation of aerial (two-dimensional) morphometric parameters (Table 2). Drainage density is calculated as the ratio of the total length of all streams (Lµ) within the drainage basin to the total area (A) of the basin, that is, Lµ/A. In the study area, Dd is 0.57 km/km2, which indicates, that surface permeability, runoff, infiltration rate, and erodibility are moderate to high (Horton, 1932). This is mainly influenced by the resistance of the subsurface geology to erosion and infiltration capacity (Singh et al., 2015). The resulting drainage density is an indicator of the potential of Groundwater. The low drainage density indicates the higher potentiality and the high drainage density shows the low potentiality of groundwater (Sarmin & Zaman, 2018).
The stream frequency of the basin is 0.21, which indicates a moderate-to-high infiltration rate, surface permeability, and low relief condition. It depends on the climate, rainfall, runoff, permeability, vegetation, rock/soil type, penetration rate, relief, and developmental stage (Schumm, 1956).
Drainage texture refers to the relative distance between the streams in the unit area along a linear path (Howard, 1967). It is calculated by dividing the total length of all stream channels by the total perimeter of the basin (Table 2). It is classified into five categories, that is, very coarse (<2), course (2–4), moderate (4–6), fine (6–8), and very fine (>8) (Smith, 1950). In the Shimsha basin, the drainage texture ratio is 3.24 (km−1) which indicates the coarse-textured, surface runoff and infiltration rate is moderate. It prominently depends on climate, rainfall and rock type, relief, and development (Horton, 1945; Smith, 1950).
The length of overland flow is about half the reciprocal densities of the drainage basin (Horton, 1945). It is among the most important independent variables influencing the physical and hydrological development of the drainage basin (Waikar & Nilawar, 2014). When the intensity of rainfall exceeds the infiltration capacity of the soil, the surplus water flows on the land surface in the form of ground flow (Suresh, 2000). In the present study, the length of the overland flow of the river is 0.88 (Table 2), indicating a well-developed drainage network. It depends on the rock type, permeability, climatic regime, vegetation and relief, and duration of erosion (Schumm, 1956).
5.2 Shape aspect
The elongation ratio is a shape parameter that is used to describe the geometric characteristics of a drainage basin. It's an important metric for understanding the shape and form of a basin in relation to its hydrological behavior. This parameter was introduced by Schumm (1956) and has since been widely used in hydrological and geomorphological studies. The value of the elongation ratio can provide insights into the potential for streamflow generation, runoff concentration, and flood dynamics within the basin. The elongation ratio is calculated given the formula Re = (2/Lb) (A/π)0.5. Re is an elongation ratio, and A is a basin area (sq. km). Pi is a “Pi” value, that is, 3.14, Lb is a basin length and Re values help in flood forecasting. The values of Re are <0.5 for a more elongated basin, Re is <0.7 for the elongated basin, 0.8–0.7 for a less elongated basin, 0.9–0.8 for an oval basin, and >0.9 for a circular basin. Re of the basin is 0.79 which suggests that the drainage basin is subelongated (Table 2).
The circularity ratio is a geomorphological parameter that is used to describe the shape of a drainage basin in hydrology and geomorphology studies. It provides insights into the degree of circularity or compactness of a basin's shape. It describes the shape of the basin, and it correlates with subsurface lithology and surface run-off (Miller, 1953). The basins approaching circular shape are generally slow to move, and have a depositional layer, whereas linear catchments tend to have faster channel drainage (Dowling et al., 1998). Unit circularity ratios show the circular shape and indicate uniform infiltration with a long time for surplus water to reach the outlet or confluence, which also depends on the slope, and land cover (Reddy et al., 2004). The Rc for the study area is 0.33 (Table 2). This indicates subelongated. It shows both rivers are at an early stage of topographical maturity.
The form factor can be described as a basin area ratio to the square of the river length (Horton, 1932). This parameter shows the flow intensity of the drainage of the designated area (Horton, 1945). The value of the form factor for the Shimsha basin is 0.49 which represents that the formation of the basin is subelongated with flatted peak flow and longer duration (Table 2).
5.3 Relief aspect
Absolute relief is the actual change in height between two locations, regardless of the terrain's shape or slope between those points. It shows the maximum height of any field morphology, which also gives estimate information. The form and strength of occupational denudation forces (Thakur, 2005 and Tejpal, 2013). It defines how much erosion has occurred in the area's existing summits. Shimsha basin indicates that 56.34% is in the moderate low and moderates an area of total relief that occupies most of the basin, while moderately high-to-high relief covers 33.72% and the low-relief field is only 10.04%. It suggests low run-off and high infiltration in the basin area. Therefore, it was expected that there would be no regular flooding in the basin (Figure 4b and Table 2).
Basin relief refers to the difference in elevation between the highest and lowest points within a drainage basin. It defines the slope and so the run-off and sediment transport. The low basin relief indicates low run-off, low sediment transport, and spreading of water within the basin, according to Hadley and Schumm (1961). The basin relief provides insights into the topographic variability and ruggedness of the landforms within a specific drainage basin. Basin relief is a prime factor in interpreting the denudational properties of the basin. It plays a significant role in developing the landform, drainage, surface and subsurface water flow, permeability, and terrain erosion. The total reliefs of the Shimsha River are measured 943 m (Table 2).
The ruggedness number is defined as the product of basin relief and drainage density (Strahler, 1956; Vijith & Satheesh, 2006) and practically mixes steep slopes with long slopes (Pareta & Pareta, 2011; Patel et al., 2013). The ruggedness number provides insights into the complexity of the terrain. A higher ruggedness number indicates a more rugged or rough terrain, while a lower value suggests a smoother landscape. It formulated Dd × (R/1000), which results in 0.53 (Table 2), it reveals that the medium surface rock-permeability, run-off, and infiltration rate. Found to cover 54.04% basin (Figure 4c), that used interpreted as a basin with low relief and minimize soil erosion - the rugged regions of the east-west of the basin as revealed.
Relative relief is defined as the difference in height in a unit area. It is a significant morphometric parameter used for the overall analysis of morphological attributes of the terrain. Partsch (1911) gave the first idea about relative relief and subsequently (Johnson, 1933; Krebs, 1922; Schrepfer & Kallner, 1930; Smith, 1935) followed it. The first time a scientific and systematic study of relative relief was done by Smith (1935). Further improvement in relative relief analysis was done by Nir (1957) using a relief classification by suggesting the ratio between relative relief and absolute relief. The calculated relative relief of the basin is 163.43. Table 3 shows the relative relief classes of the Shimsha basin. It shows that 22.05% of the basin is either in the moderate low and 21.42% moderate, an area of total relief that occupies most of the basin, while moderately high to high relief covers 38.50%, and only 18.04% of the area consists of low relief, which indicates low runoff and high infiltration rates in the basin. This part of the river whose relative relief is measured <54.94 is the more significant part. Therefore, it is expected that flooding in the basin will not be regular (Figure 4d).
| Parameters | Range | Inferences | Area (sq. km) | Area (%) |
|---|---|---|---|---|
| Dd (km/km2) | <0.16 | Very low density | 1678.4 | 19.2 |
| 0.16–0.43 | Low density | 2163.4 | 24.75 | |
| 0.43–0.65 | Moderate density | 2167.4 | 24.8 | |
| 0.65–0.87 | High density | 1856.4 | 21.24 | |
| >0.87 | Very high density | 875.4 | 10.01 | |
| Elevation (m) | <407 | Low absolute ratio | 885 | 10.04 |
| 675–748 | Moderately low absolute ratio | 2391 | 27.41 | |
| 748–813 | Moderate absolute ratio | 2523 | 28.93 | |
| 813–874 | Moderate high absolute ratio | 1459 | 16.66 | |
| >1315 | High absolute ratio | 1485 | 16.96 | |
| Rr (m) | <54.94 | Low | 1577 | 18.04 |
| 54.94–68.62 | Moderately low | 1927 | 22.05 | |
| 68.62–99.42 | Moderate | 1872 | 21.42 | |
| 99.42–145.61 | Moderate high | 1681 | 19.23 | |
| >145.61 | High | 1684 | 19.27 | |
| Rn (m) | <1.10 | Low | 2408 | 27.55 |
| 1.10–1.65 | Moderately low | 1878 | 21.49 | |
| 1.65–2.48 | Moderate | 1138 | 13.02 | |
| 2.48–3.58 | Moderate high | 1992 | 22.79 | |
| >3.58 | High | 1323 | 15.14 | |
| Sb (%) | 0–259423.52 | Very low slope | 3778 | 43.22 |
| 259,423.52–821,507.84 | Low slope | 4481 | 51.26 | |
| 821,507.84–1,945,676.47 | Moderate slope | 334 | 3.82 | |
| 1,945,676.47–3,761,641.17 | High slope | 106 | 1.22 | |
| 3,761,641.17–11,025,500 | Very high slope | 42 | 0.48 | |
| Total | 8741 | 100 | ||
Slope analysis in geomorphic studies is a significant parameter. Besides, the slope elements are dominated by the morphogenic climate processes in areas with a rock of different resistance. A slope map gives information on settlement planning for agriculture, deforestation, planning for infrastructure, retaining practices, and so forth, provided by Sreedevi et al. (2005). The slope analysis method is also suggested by geomorphologists of various shades and styles (Hammond, 1964; Russell, 1949; Schumm, 1956; Strahler, 1956; Young, 1971), and has contributed a great deal to physiographic investigation and research directed toward the evolution of earth's surface. The average value change rate between each cell and its neighbors (Burrough, 1986). A significant contribution to slope study has been made by (Horton, 1945; Raize & Henry, 1937; Strahler, 1956; Wentworth, 1930). The drainage slope (in percentage) is classified into “5” classes (Table 3), which shows the land area and the percentage of each category as well as the five classified categories—revealing that the low to very low slope within the basin (94.48%). It clarifies the basin's low-relief character regions with a high gradient (1.70%) of the basin area (Figure 5b).
Aspect usually refers to the direction of the slope and this factor can have a very significant impact on the local climate because the hottest afternoon sunlight is in the west so a west-facing slope will be cooler than a protected east-facing slope. These could significantly affect crop growth and biodiversity in the study area. The output raster data set value represents the compass aspect direction. 0 is true for the answer; 90 is on the covered north side (Magesh et al., 2011). The aspect map of Shimsha River (Table 4). It is clearly seen that east-facing slopes are mainly found in 13.92% area. Therefore, these slopes have higher moisture content and lower evaporation rates and some parts falling toward the west have lower moisture content and higher evaporation rates (Rai et al., 2017).
| Azimuth | Abbreviation | Area (sq. km) | Area (%) |
|---|---|---|---|
| Flat | −1 | 112.7 | 1.29 |
| North | 0–22.5 | 534.7 | 6.12 |
| Northeast | 22.5–67.5 | 1095.7 | 12.54 |
| East | 67.5–112.5 | 1216.7 | 13.92 |
| Southeast | 112.5–157.5 | 1161.7 | 13.29 |
| South | 157.5-202.5 | 1078.7 | 12.34 |
| Southwest | 202.5–247.5 | 1114.7 | 12.75 |
| West | 247.5–292.5 | 1057.7 | 12.1 |
| Northwest | 292.5–337.5 | 964.7 | 11.04 |
| North | 337.5–360 | 403.7 | 4.62 |
| Total | 8741 | 100 | |
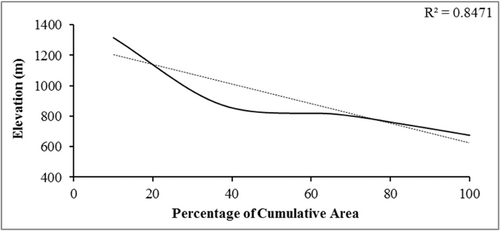
The hypsometric curve of a basin presents the area's horizontal distribution and the basin's altitudes (Strahler, 1952). Hypsometric curves are attributed to drainage basins' geomorphic and tectonic evolution in terms of their forms and processes (Keller & Pinter, 1996; Strahler, 1964). HI is calculated by following the equation HI= Sb − h/H/h. Where HI of the basin is 0.5, Figure 6, the HI results show three basin stages: (1) basin with (HI > 0.5) indicating deep vertical incision and slight erosion by neotectonics; (2) basin with (0.4 < HI < 0.5) indicates approximate equilibrium and an intermediate stage of incision and recent tectonic erosion of the active agents; and (3) basins with low relief and extreme erosion distinguished by (HI < 0.4). Here, to demonstrate the relationship between the canal level and the drainage region using the hypsometric curve. The integral hypsometric and the hypsometric curves are essential to show the basin (Table 5).
| Social aspect | Category | Area (sq. km) | Area (%) |
|---|---|---|---|
| LULC class | Water bodies | 240 | 2.75 |
| Wasteland | 4 | 0.05 | |
| Shrubland | 181 | 2.07 | |
| Permanent wetland | 6 | 0.07 | |
| Mixed forests | 180 | 2.06 | |
| Fallow land | 3921 | 1654 | |
| Deciduous forest | 135 | 1.55 | |
| Cropland | 1158 | 13.25 | |
| Built-up land | 104 | 1.19 | |
| Barren land | 16 | 9.09 | |
| Agriculture | 2795 | 31.98 | |
| Total | 8741 | 100 | |
| Waterbody | Firstst order | 2574 | 49 |
| Second order | 1172 | 22 | |
| Third order | 660 | 13 | |
| Fourth order | 311 | 6 | |
| Fifth order | 110 | 2 | |
| Sixth order | 148 | 3 | |
| Waterbody mask | 285 | 5 | |
| Total | 5260 | 100 | |
| Soil type | Clay | 3376 | 38.62 |
| Clay skeletal | 5365 | 61.38 | |
| Total | 8741 | 100 | |
- Abbreviation: LULC, land use/land cover.
5.4 Geometric aspect
The basin area of the study area is 8741 sq. m. There is a significant relationship between total watershed areas and total stream length, which is supported by the areas contributing (Schumm, 1956). Basin length is defined as the longest dimension of the basin parallel to the principal drainage line (Schumm, 1956). Gregory and Walling (1973) defined the length of the basin as the longest in the basin with a mouth at the end. The basin length calculated for this basin is 133 km. Basin perimeter refers to the total length of the boundary that defines the outer extent of a drainage basin. The basin's perimeter is 577 km, illustrating that the southern portion is stretched widely.
5.5 Morphotectonic aspect
The sinuosity index has been determined for all these sections for monitoring the channel sinuosity parameters measured using the procedure (Leopold et al., 1964). A sinuosity range straight 1.1, sinuous 1.1–1.5, and meandering >1.5 (Leopold et al., 1964). According to Muller (1968), the sinuosity index is the ratio between the channel length to the valley length which is expressed as SI = Cl/Vl. The average sinuosity of the river is 1.6 which indicates the river course as meandering in nature.
The Shimsha River is estimated to be 224 km long, and the river segments were demarcated into 30 sections into a series of equal-length reaches (Figure 7). The length of each section is 7.47 km. The sinuosity range of the river has been measured from 1.08 to 2.71.
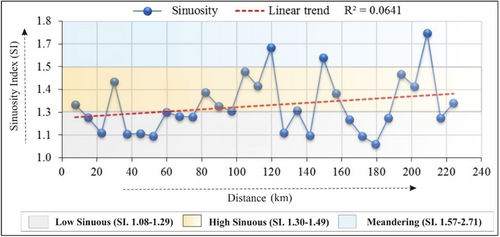
Meandering zone: The sinuosity index of this zone has been calculated between 1.57 and 2.71 which indicates that the river follows a meandering pattern (Leopold & Wolman, 1957).
High sinuosity zone: In this zone sinuosity index of the river ranges between 1.30 and 1.49, this value shows high sinuosity, which leads to lateral erosion.
Low sinuosity zone: The range of this zone measures between 1.08 and 1.29 which indicates the low sinuosity. Erosion and accretion along river banks are affected by sinuosity index (Prasad et al., 2021). The sinuosity of a river depends on the structure and geomorphology of the area (Aswathy et al., 2008). The sinuosity of the river channel depends on the structure, geomorphology, river discharge, bank erosion, channel bed, sediment load, and groundwater seepage (Brice, 1964; Leopold & Wolman, 1957; Woolderink, 2021).
The asymmetry factor refers to the lateral tilting of a basin concerning the main watercourse (Cox, 1994; Cuong & Zuchiewicz, 2001; Hare et al., 1985; Mohan et al., 2007; Raj, 2012; Singh & Srivastava, 2011). This index also provides directions for potential differential neotectonic activity and is responsible for the upliftment and subsidence of distinct blocks versus large tilting (Pinter, 2005). The Shimsha River has AF 38.65 (Table 5). It shows that the channel has shifted southwest (Figure 8).
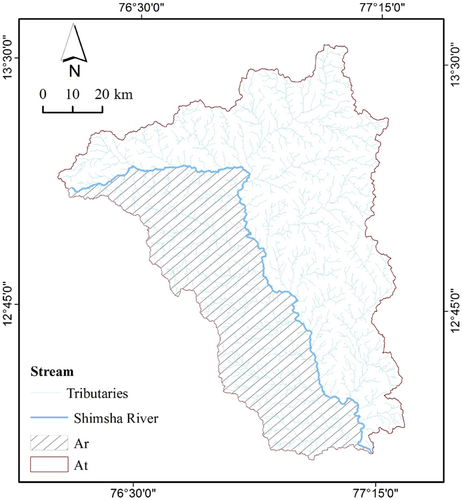
The longitudinal profile is a curvature that shows the relationship between heights versus distance downstream of a channel. Deviations from a curved-up shape of longitudinal channel profiles may indicate channel instability due to climatic and rock-type and tectonic factors (Hack, 1957). The irregularity in the profile occurs due to neotectonic and confluences of tributaries (Schumm, 1986). The slope of the study area is 13.36°. The slope of the river decreases at a gradient (∼2.3 m/km) toward to downstream direction of the river. The longitudinal profiles of the streams show a sudden change in slopes. The river shows a perfectly graded profile, a considerable amount of incision, and deposition along their profiles showing tectonically instability (Figure 9).

5.6 Social aspects
Land use and landcover studies are important information studies about the utilization of land resources for various purposes based on the availability of the necessary support and transport around the world (Nagarajan & Poongothai, 2012). Standard visual interpretation techniques of remote sensing were applied using satellite imageries to recognize and interpret the land use pattern of the area. Forest and the growth of vegetation reflect the presence of groundwater in an area (Sarmin & Zaman, 2018) (Figure 10a).
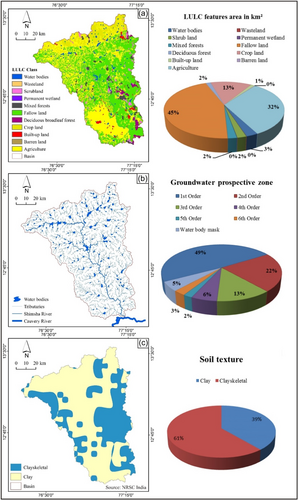
Groundwater–surface water interactions occur in different ways across Earth's landscapes (Winter et al., 1998). The groundwater perspective area helps determine the suitability of access to groundwater because surface water is linked to groundwater. Bar diagram showing the percentage of water in the subsections of the Shimsha River followed by (first order 49%), (second order 22%), (third order 13%), (fourth order 6%), (fifth order 5%), (sixth order 3%), and (other water body mask 5%) (Figure 10b and Table 5).
Bar soil is very susceptible to soil erosion because rich in water content and therefore characterized by high drainage density and high surface runoff, thus implying significant flood peaks and volume (Gardiner, 2003). Clay contains (3376 sq. km) about 39% and clay skeletal (5365 sq. km) covers 61% (Figure 10c and Table 5). Most of the study area was covered with clay skeletal soil with low to moderate infiltration rates.
6 CONCLUSIONS
To estimate and calculate the erosion potential in the Shimsha basin, 25 morphometric parameters linear, areal, and relief, geometric, and morphotectonic parameters of the basin were analyzed accurately by integrating quantitative and spatial techniques with the help of GIS techniques. Detailed morphometric study of river shows dendritic to subdendritic drainage patterns. The mean bifurcation ratio of the Shimsha basin is 4.40 which indicates that the basin is normal and control of the drainage network by geomorphology. The drainage density, stream frequency and drainage texture of Shimsha basin show a moderate surface permeability, homogenous lithology, run-off, erodibility, low relief conditions, infiltration rate, and a well-developed drainage network. Ruggedness number interpreted as a basin with low relief and minimized soil erosion—the rugged regions of the east-west of the basin. Elongation ratio, circularity ratio, and form factor indicate that the basin consists of a subelongated basin with flattened peak flow and long duration. Relief factor indicated low relief and intermediate stage of the incision rate. Hypsometric analysis of the Shimsha basin specifies a mature stage of geomorphic evolution of the basin. The AF indicates that the channel has shifted to the southwest. The results indicate that the study area consists of a subelongated basin with flattened peak flow and long duration. Most of the study area was covered with clay skeletal soil with low to moderate infiltration rates. The study results are highly beneficial for developing and planning soil and water conservation structures and watershed management strategies. These maps can inform decisions about sustainable groundwater management, potential groundwater zones, water harvesting sites, and groundwater conservation.
ETHICS STATEMENT
None declared.
Open Research
DATA AVAILABILITY STATEMENT
Data will be made available on request.


