Aeration strength analysis of overflow weir in siphon well based on numerical simulation of water–air two-phase flow
Abstract
The phenomenon of water aeration is serious after the overflow weir in the siphon well at the cooling water circulation system of coastal power plants. At present, designing special hydraulic structures is an effective way to reduce the intensity of aeration. In this paper, three engineering structure schemes were designed, and the three-dimensional Realizable k–ε turbulence model was used. The volume of fluid method was introduced to capture the free water surface, and the unstructured grid was used to construct the two-phase turbulent flow field. The aeration concentration and pressure distribution, obtained by numerical simulation, were basically consistent with the physical model test results. The results showed that the flow field at the orifice plates of cases 1 and 2 changed drastically, and the turbulent kinetic energy downstream of the orifice plate decreased with the increase of the number of holes. As for case 3, it showed that the high-speed water flow fell into the water cushion pool, tumbling and sucking up a lot of air, and the turbulent kinetic energy and Reynolds stress were significantly greater than the other two cases. The hydraulic structure changed the cavitation characteristics of the downflow water, and the sequence of aeration concentration of the horizontal section was case 3 > case 1 > case 2. The aeration concentration was only 9.18%–17.86% in case 2. The aeration concentration at stable time is expressed as a function of the relative water depth y/y90 and the turbulent diffusion coefficient D. The distribution formula of aeration concentration was established, and its validity was verified by literatures. The results of this study will provide a certain reference for in-depth analysis of water–air mixing motion characteristics, and simultaneously, it will have a guiding significance for the design of siphon well defoaming engineering.
1 INTRODUCTION
The cooling water circulation system of coastal power plant takes water from the sea through the pump and cools the steam in the condenser. After heat exchange, the cooling water enters the siphon well and finally discharges to the sea. Generally, the siphon well is equipped with an overflow weir to maintain the stable water level and a certain degree of siphon height of the drainage system. The heat exchange pipelines of the condenser are guaranteed to have certain pressure, thereby reducing the head of the water pump and its operation cost (Fu et al., 2017). However, the high-speed water flow generated by the fall of the overflow weir collides violently with the underlying water body, mixing and tumbling, drawing a large amount of air into the water to create bubbles. A large number of bubbles gather into pale yellow foam, then the foam floats around under the action of ocean currents, waves, and wind. The large-scale foam pollution zone seriously affects the water quality and the appearance of the receiving waters (Oh et al., 2012).
Currently, the research on foam problem of coastal power plant has made certain achievements, and various foam suppression methods such as chemical defoamer, engineering structural renovation and biological treatment have been continuously tested and optimized in actual projects. The chemical defoaming method is expensive, most power plants cost at least 5 million yuan a year by adding antifoaming agents and other temporary remedies, which may cause ecological and environmental risks to the surrounding sea area. The biological treatment method provides a novel idea for antifoaming, but in practice, it is difficult to find suitable target creature and determine the technical standards. Therefore, when existing power plants are renovated or newly built, a more effective antibubble measure is to design special hydraulic structures to reduce or even eliminate the aeration caused by falling water in the circulating drainage system. By cutting off the sufficient conditions for foam formation, the purpose of inhibiting foam formation is achieved.
At present, the institute has carried out a large number of physical model optimization tests (Du et al., 2003). However, in the physical model of siphon well reduced according to the gravity similarity scale, it is difficult to extrapolate the aeration scale to the actual prototype according to the gravity similarity principle. With the improvement of computer performance and maturation of calculation methods, numerical simulation methods for water–air two-phase flow problems have made some progress in the past decade. Studies have proved that computational fluid dynamics (CFD) can complement and assist the solution of water–air two-phase flow problems. Among these studies, we list the followings: Molholklar and Pandit (2001) conducted a numerical simulation of the hydrodynamic properties of the Venturi bubble flow, using a continuous bubble mixing model, to study the one-dimensional (1D) bubble flow in the Venturi. The simulation results show that the structural parameters of the hydrodynamic cavitation reactor, such as the downstream recovery pressure, the initial air content of the section, and the initial size of bubbles make an important influence on the hydrodynamic characteristics of the bubble flow (Moholkar & Pandit, 2001). Cihan Aydin and Ozturk (2009) found that the air-entrainment rates obtained from the CFD analyses are in reasonable agreement with the prototype data and the values calculated from empirical equations, and are better than the physical model data, which include considerable scale effects. Luo et al. (2012) took the spillway tunnel of Xiluodu Hydropower Station as the research object and applied the piecewise calculation method to conduct 3D turbulence numerical simulation analysis. The results show that RNG k–ε turbulence mathematical model and volume of fluid (VOF) method could better analyze the aeration reduction problem of spillway tunnel (Luo et al., 2012). Dong et al. (2013) used 3D particle image velocimetry and high-speed photography to experimentally study the hydraulic properties of multisquare orifice plates in hydrodynamic cavitation reactors. Arrangements of holes in the orifice plates were divided into diagonal, cross, and checkerboard categories. Bayon-Barrachina and Lopez-Jimenez (2015) used OpenFOAM to study the hydraulic leap, and used the standard k–ε, RNG k–ε, and shear stress transport k–ε models to simulate. The results achieved more than 98% accuracy under all working conditions (Bayon-Barrachina & Lopez-Jimenez, 2015). Li et al. (2016) used numerical simulation and physical model to conduct a comparative study on the air–water flows in curve-connective tunnel including ogee segment, steep segment, and antiarc segment. The results show that the whole cross-section aerator not only weakens the backwater in bottom aeration cavity, thereby increasing the length of the bottom cavity, and is beneficial to the protection of the sidewalls. The aeration performance of bottom-inlet aerators was investigated for different Froude numbers and ramp heights by Cihan Aydin (2017). Some practical formulas based on experimental and numerical data were obtained to estimate the air entrainment coefficient (and thus the average air concentration) of the bottom-inlet aerators (Cihan Aydin, 2017). Jesudhas et al. (2018) used the large eddy simulation method to analyze the hydrojump process and obtained flow field information such as turbulence structure characteristics. Hohermuth et al. (2021) used Flow-3D to simulate self-aerated water flow within a certain slope range, and the error was only about 10%.
In this paper, the interFoam solver in OpenFOAM was used to simulate and calculate the motion of the two-phase flow in the overflow weir of the siphon well, and the physical model test results were used for verification. The cases were inspired from the actual construction of a coastal power plant, and the design and research of the operating conditions were carried out with reference to the foam suppression structure of the power plant. This paper analyzed the hydraulic characteristics of the hydraulic structure section, such as water flow pattern and turbulent kinetic energy, and explored the distribution law of aeration concentration under different cases, to make up for and improve the insufficiency of the indoor model test, expand the extension to the prototype, and optimize the coastal power plant. The research results provide a reference for optimizing the hydraulic foam suppression measures of the siphon well in coastal power plant.
2 CONSTRUCTION OF MATHEMATICAL MODEL
2.1 Numerical simulation calculation domain
Three groups of hydraulic structures were constructed to carry out numerical modeling calculation, and the calculation domain is shown in Figure 1. The overflow weir adopts the utility weir type. The upper part of the top is the arc shape, the downstream of the top uses the curve smooth connection, then the curve suddenly changes to a vertical shape until the bottom of the weir. The hydraulic structure behind the weir adopts a double-layer orifice form along with a retaining wall. The orifice shape is round and its diameter is equal to 0.3 m. The three cases are different in the height of the vertical section of the weir surface and the design of the hydraulic structure. In the case 1, the weir surface is abrupt at 1.2 m below the top of the weir, and the height of the vertical section is 3.2 m. In the case 2, the curved surface of the practical weir type is extended, and the height of the straight section is reduced to 1.7 m. And for the case 3, the weir type is the same as case 2.
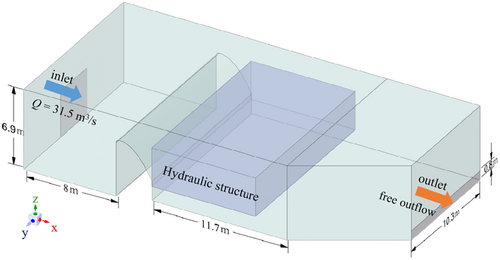
In terms of hydraulic structure, case 1 is a combination of two-step double-layer orifice plate and double retaining wall. The upper orifice plate of the first stage is uniformly arranged, the lower orifice plate adjacent to the overflow weir is a solid plate, and the net height difference of the orifice plate is 1.38 m. The first retaining wall adopts the form of orifice plate whereas the second retaining wall adopts the form of upper entity and lower orifice plate combination where its height is 3.48 m. Case 2 is the combination of the third-step double-layer orifice plate and the triple retaining wall. The upper and lower orifice plates of the first step are, respectively, set with four rows and nine rows of circular holes. The net height difference of the orifice plate is reduced to 1.0 m, and the first retaining wall is a solid structure with a height of 3.6 m. In addition, considering that in actual projects, most hydraulic structures constructed by power plants are not set with orifice plates, so only one retaining wall is set in the case 3. The case 3 can be understood as a control group for the other two cases and represents the basic foam suppression structure currently used in coastal power plants. The position and structural parameters of the retaining wall are the same as those of case 2.
2.2 Governing equations of water–air two-phase flow
2.3 Grid division and boundary condition setting
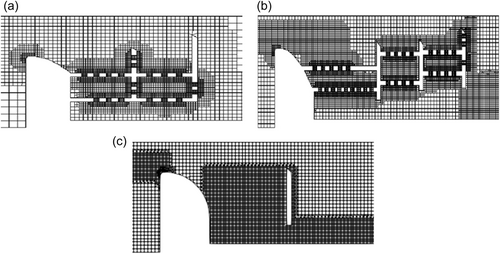
Due to the complexity of the additional defoaming hydraulic structure in the siphon well of each case, the calculation area used unstructured meshes. During the trial calculation, the mesh division was relatively rough to ensure the convergence of the calculation. On this basis, in view of the high requirement of aerated concentration on mesh size, refinement was focused on the water–air interface and structural mutation positions (Sussman & Ohta, 2009). The explicitly final number of grids and cell sizes were determined considering the balance between calculation time and accuracy, and the number of grid cells in cases 1, 2, and 3 is about 400,000, 1.3 million, and 800,000, respectively.
In the model, the left side was set as the inlet of water velocity, and the control flow under simulation condition was 31.5 m3/s which represented the maximum flow rate for the operation. That is to say, the simulated operating condition in the paper is the most unfavorable condition for the power plant. The free outflow outlet was set on the right side of the model, corresponding to the actual offshore tide level of −0.99 m. The pressure at the top of the model was standard atmosphere. The other surfaces adopted wall nonslip boundary conditions.
During the simulation, Euler discretization was used for the time term, Gaussian linear upwind discretization was used for the convection term, and Gaussian linear calculation method with orthogonal correction was used for the Laplace term. The time step was automatically adjusted. The meshes and time steps were refined and adjusted, and there is no significant difference in the numerical solutions obtained, indicating that the mesh division is reasonable, and the steady state solution of bubble entrainment is sufficient within the simulation time range. Figure 2 shows the grid division at the hydraulic structure of each case.
2.4 Verification of mathematical model
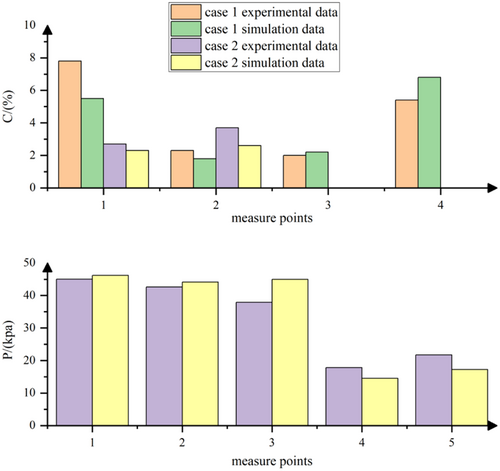
To verify the numerical simulation results, the physical model study on foam suppression of power plant was conducted at the experimental base. Based on the purpose and requirements of experimental research, the physical model was designed according to the gravity similarity criterion, namely the Froude similarity criterion. Taking into account factors, such as site size and water supply conditions, the model adopted a normal model with a geometric scale of 1:20. Thus, the hydraulic scales of the model were obtained, such as velocity scale, flow scale, and roughness scale. The locations of the measuring points are shown in Figure 3. In the case 1 and case 2, four air aeration test points were set up on the first orifice plate of the first stage, below the orifice plate of the second stage of the first stage, above and behind the orifice plate of the second stage of the hydraulic structure. Three pressure measurement points were evenly arranged on the orifice plate, and the other two points were arranged at the top and bottom of the first retaining wall. The CQ6-2005 aeration concentration meter with the measurement range of 0%–100% was used. Also the CY200 intelligent digital pressure sensor which covers the range of 0–50 kPa with the accuracy of 0.1% was used to analyze the pressure of the foam suppression structure.

The comparison between the model simulation results and the test results is shown in Figure 4. It can be seen from Figure 4 that the aeration concentration of each measuring point in case 1 is less than 8%, and the absolute value of the simulation error of measuring point A is slightly larger (equal to 29.49%). The aeration concentration of the measurement points in case 2 is all less than 4%, and the absolute value of the simulation error of measurement point B is the largest (equal to 29.73%). Comparing the pressure values, the pressure on the upper orifice plate of case 2 is about 40 kpa, and the pressure of point 1 is the largest, which is 45.05 kpa; the pressure distribution at the retaining wall is about 20 kpa, which is about half of the pressure of the orifice plate, among which the pressure of point 4 is the smallest, which is 17.80 kpa. The calculation and simulation errors of pressure are all within 20%. In conclusion, the numerical model established in this paper has strong reliability.
3 ANALYSIS OF HYDRAULIC CHARACTERISTICS OF HYDRAULIC STRUCTURE SECTION
3.1 Analysis of water flow pattern
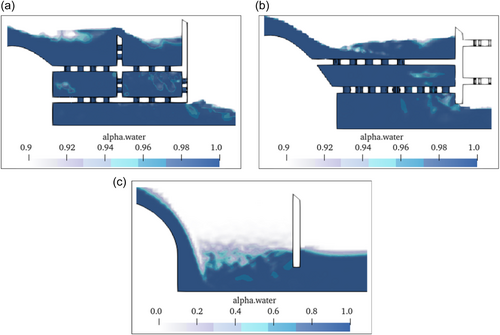
By taking the longitudinal section at the position of the central axis, the water–air cloud maps of the hydraulic structural sections of each case in stable state were obtained, as shown in Figure 5. It can be seen that the simulation reproduces the general pattern of water aeration in the overflow weir, such as impinging jet, cavity, water splash, and so forth (Mordasov et al., 2016). The water surface evolves from a relatively smooth and continuous shape to a rough and broken shape, and finally tends to in stability. As the fluid flows downstream, the large and small vortices are continuously generated, broken, and disappeared. In the end, the water flow of case 1 jumped over the first retaining wall and entered the second stage; the water flow of case 2 was blocked by the first retaining wall, and the water flow all fell on the first stage; in the case 3, there is a retaining wall and a water cushion pool with a certain thickness behind the weir. Strong turbulent shear occurred between the incident water flow and the water body in the pond, and only a small part of the water flow was blocked by the retaining wall during the flow process. Under the simulated flow, the horizontal drainage section of the siphon well entrained a large amount of air and formed a certain length of aerated water flow.
3.2 Study on turbulent characteristics
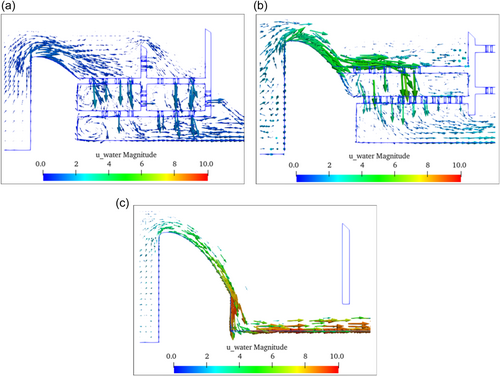
The velocity vector diagrams at the hydraulic structure of each case are shown in Figure 6. It can be seen that the water flowed through different flow structures, affected by the geometric boundary of the structure, forming a complex rapid flow. The case 1 and case 2 belong to the porous jets, and the flow velocity distribution in the flow field has great occasionality and randomness. Certain vortices were formed in the area between the upper and lower orifices, and the location and range of vortices were also extremely irregular. As the length of the curve section of the weir surface was extended in the case 2, the flow velocity of the water falling to the upper orifice plate of the first stage was greater than that of the case 1. Simultaneously, the increase of the length of the orifice plate slowed down the impinging efflux of water to a certain extent. After passing through the second orifice plate, the flow velocity of the discharge water decreased significantly. The water velocity after passing through the hydraulic structure in case 1 and case 2 was about 1.2 and 2 m/s, respectively. However, in the case 1, due to the holes at the bottom of the second retaining wall, part of the water flow jumped out of the holes to form hydraulic jumps, resulting in a certain turbulence in the horizontal drainage section, and the downstream water flow speed increased slightly. The flow velocity at the exit position of case 1 and case 2 was not much different. In comparison, in the case 3, since there was no orifice behind the weir, the water flow directly fell into the water cushion pond with a high flow velocity of about 5.8–7.5 m/s. Then, the water flow velocity in the horizontal drainage tank culvert was basically unchanged, and the flow velocity at the outlet was about 6.2 m/s.
- 1.
Case 1 below the orifice plate (z = 3.2 m and z = 1.4 m).
- 2.
Case 2 below the orifice plate (z = 3.0 m and z = 1.9 m).
- 3.
Case 3 above the water cushion pond (z = 1.5 m).
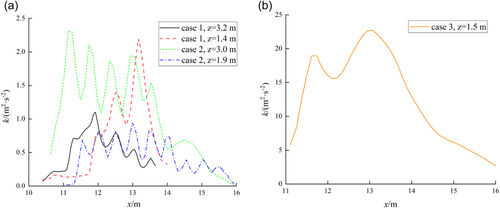
It can be seen from Figure 7 that due to the existence of circular holes on the orifice plate, the turbulent kinetic energy of the water flow through the orifice plate in case 1 and 2 fluctuated violently, with multiple peaks appearing. Among them, the turbulent kinetic energy distribution curves of case 1 had four and three peaks, respectively, and case 2 had five and nine peaks, respectively. The number of peaks is the same as the number of holes, and the turbulent kinetic energy of the section near the orifice is larger than that of the center of the hole. In contrast, the turbulent kinetic energy of case 3 had little fluctuation along the distribution, with only two peaks, and the maximum turbulent kinetic energy was equal to 22.73 m2/s2 at x = 13.05 m. After the hydraulic structure, the order of the turbulent kinetic energy of the water flow in the three cases is case 3, case 1, and case 2. The reason for the analysis is that the number of holes in case 2 is densely distributed, and the existence of holes makes the flow field change drastically (You & Li, 2009). Hence, large vortices split into several small vortices, which disappear due to viscous dissipation, transforming energy into internal energy of the fluid (Yoon & Shin, 2016) and further weakening the turbulence intensity of the water flow. In addition, the magnitude of the turbulent kinetic energy directly affects the cavitation characteristics of the flow field. Generally speaking, the larger the turbulent kinetic energy is, the more likely cavitation phenomenon is to occur (Bai et al., 2020).
In the Reynolds-averaged Navier–Stokes (RANS) equation adopted in this paper, the calculated turbulence stress is not only due to viscosity, but also to the additional stress due to turbulent pulsation, namely the Reynolds stress τR. The Reynolds stress is proportional to the velocity gradient and is also affected by the eddy viscosity coefficient (Singh & You, 2013).
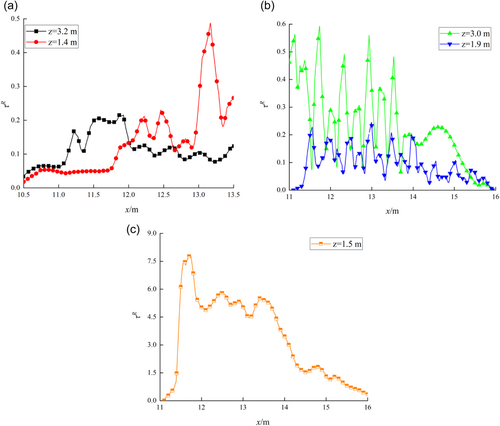
In this paper, the velocity gradients in each direction were calculated, and the six components of the Reynolds stress tensor were further calculated to obtain the Reynolds stress distribution of the three cases. The results are shown in Figure 8. Considering that the Reynolds stress is caused by the uneven distribution of flow velocity in the flow field, the larger the Reynolds stress is, the more uneven the flow velocity distribution and the more intense the turbulence will be (Mamori & Fukagata, 2010). Therefore, it can be seen from Figure 8 that the distribution trend of Reynolds stress in all cases was similar to that of turbulent kinetic energy, especially in case 1 and case 2. As for case 3, the calculation range yield to the maximum value of Reynolds stress at x = 11.73 m, and its value was 7.85, after which the Reynolds stress decreased along the path. After the hydraulic structure, the Reynolds stress of case 2 was the smallest, which was approximately distributed in the range of 0–0.25.
4 AERATION CONCENTRATION DISTRIBUTION
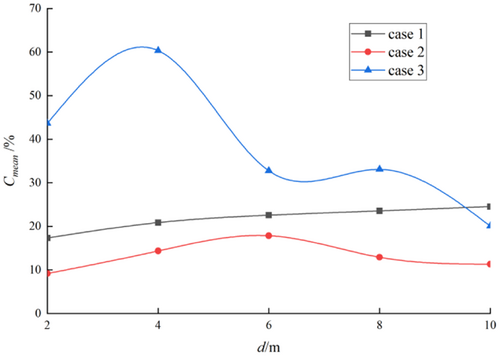
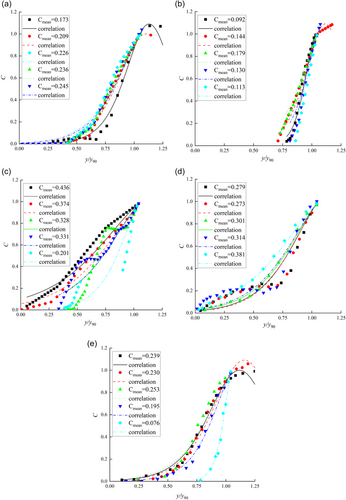
According to the above numerical model results, considering the uniform distribution characteristics of aeration and the main influencing factors of aeration, the vertical aeration concentration distribution of the section was expressed as a function of two dimensionless numbers, the relative water depth y/y90 and the turbulent diffusion coefficient D. The function expression is shown in Formula (10). Back to this equation, one can note the following: tanh is a hyperbolic tangent function, and K is a parameter (which can be calculated by the turbulent diffusion coefficient D).
| Case | Cmean | K | D | R2 |
|---|---|---|---|---|
| Case 1 | 0.173 | 4.206 | 0.129 | 0.983 |
| 0.209 | 3.545 | 0.155 | 0.986 | |
| 0.226 | 3.301 | 0.168 | 0.979 | |
| 0.236 | 3.175 | 0.176 | 0.982 | |
| 0.245 | 3.058 | 0.183 | 0.965 | |
| Case 2 | 0.092 | 7.703 | 0.068 | 0.969 |
| 0.144 | 5.022 | 0.107 | 0.985 | |
| 0.179 | 4.092 | 0.133 | 0.962 | |
| 0.129 | 5.551 | 0.096 | 0.916 | |
| 0.113 | 6.305 | 0.084 | 0.872 | |
| Case 3 | 0.436 | 1.855 | 0.327 | 0.955 |
| 0.374 | 2.112 | 0.280 | 0.969 | |
| 0.328 | 2.368 | 0.245 | 0.823 | |
| 0.331 | 2.348 | 0.248 | 0.890 | |
| 0.201 | 3.677 | 0.149 | 0.818 | |
| Chanson (1995b) | 0.279 | 2.724 | 0.209 | 0.902 |
| 0.273 | 2.778 | 0.204 | 0.880 | |
| 0.302 | 2.544 | 0.226 | 0.996 | |
| 0.314 | 2.454 | 0.235 | 0.899 | |
| 0.381 | 2.078 | 0.286 | 0.994 | |
| Toombes (2002) | 0.239 | 3.133 | 0.178 | 0.950 |
| 0.230 | 2.974 | 0.189 | 0.924 | |
| 0.253 | 1.577 | 0.400 | 0.962 | |
| 0.195 | 3.768 | 0.145 | 0.991 | |
| 0.076 | 9.197 | 0.056 | 0.988 |
5 CONCLUSION
Aiming at the aeration problem of falling water in overflow weir of siphon well, this study calculated and simulated three kinds of antibubble engineering cases. The case 1 adopts the hydraulic structure form of double floor with hole and double retaining wall combination; the case 2 adopts the combination form of three-step double-layer orifice plates; and the case 3 adopts the structural form with only retaining wall. Through CFD technology and based on the VOF method, the RANS turbulence model was adopted to accurately simulate the process of water aeration in the overflow weir of the siphon well. The hydraulic characteristics of the hydraulic structure section and the aeration concentration distribution of the horizontal drainage section were studied, and the mechanism between hydrodynamic characteristics and water–air mixing strength was analyzed.
By comparison and verification with the physical model test results, the aeration concentration and pressure distribution obtained by numerical simulation are basically consistent with the experimental phenomenon, and the simulation results are reliable. Due to the difference of the additional hydraulic structures, the water flow turbulence characteristics of the three cases are changed. The turbulent intensity of the water flow through the orifice plate in the case 1 and case 2 is significantly reduced. The results show that the greater the number of holes in the orifice plate is, the more obvious the reduction of the turbulent intensity at the hydraulic structure will be, and the smaller the degree of aeration in the rear horizontal drainage section will be. The established aeration concentration distribution model of water–air two-phase flow simplifies the proposition of water–air mixing and the aeration concentration is expressed as a function determined by the relative water depth and turbulent diffusion coefficient. The calculated aeration concentration distribution along the water depth direction is well verified by the literature outcomes. To sum up, the numerical simulation of the water and air flow process in the overflow weir of the siphon well breaks through the limitation of the existing physical model test measurement methods. Through in-depth analysis of the motion characteristics of the water–air two-phase flow, the causes and influencing factors of air entrainment are explored, and engineering solutions are provided for similar air entrainment problems in siphon well. Among them, the case 2 is recommended as the best foam suppression case.
ACKNOWLEDGMENTS
All authors have read and agreed to the published version of the manuscript. The authors would like to thank all of the interviewees who offered their time and expertise for this study. This research received no external funding.
ETHICS STATEMENT
None declared.
Open Research
DATA AVAILABILITY STATEMENT
Study data are available upon reasonable request.


